

Abstract
Liver cells (HepG2 and primary hepatocytes) overexpressing CYP2E1 and exposed to arachidonic acid (AA) were previously shown to lose viability together with enhanced lipid peroxidation. These events were blocked in cells pre-incubated with antioxidants (α -tocopherol, glutathione ethyl ester), or in HepG2 cells not expressing CYP2E1. The goal of the current study was to evaluate the role of calcium and calcium-activated hydrolases in these CYP2E1-AA interactions. CYP2E1-expressing HepG2 cells treated with AA showed an early increase in cytosolic calcium and partial depletion of ionomycin-sensitive calcium stores. These changes in calcium were blocked by α -tocopherol. AA activated phospholipase A2 (PLA2) in CYP2E1-expressing liver cells, and this was inhibited by PLA2 inhibitors or α -tocopherol. PLA2 inhibitors prevented the cell death caused by AA, without affecting CYP2E1 activity or lipid peroxidation. AA toxicity and PLA2 activation were inhibited in calcium-depleted cells, but not by removal of extracellular calcium alone. Removal of extracellular calcium inhibited the early increase in cytosolic calcium caused by AA. CYP2E1 overexpressing HepG2 cells exposed to AA showed a decrease in mitochondrial membrane potential, which was prevented by the PLA2 inhibitors. These results suggest that AA-induced toxicity to CYPE1-expressing cells: (i) is associated with release of Ca2+ from intracellular stores that depends mainly on oxidative membrane damage; (ii) is associated with activation of PLA2 that depends on intracellular calcium and lipid peroxidation; iii) does not depend on increased influx of extracellular calcium, and iv) depends on the effect of converging events (lipid peroxidation, intracellular calcium, activation of PLA2) on mitochondria to induce bioenergetic failure and necrosis. These interactions may play a role in alcohol liver toxicity, which requires polyunsaturated fatty acids, and involves induction of CYP2E1.
Introduction
The effect of exogenous arachidonic acid (AA, a polyunsaturated fatty acid) on cellular calcium homeostasis cannot be predicted and must be assessed in each experimental model. In different cell types, free AA has been shown to induce calcium oscillations [1], to induce store operated channel (SOC)-mediated calcium entry [2], to activate selective [3] or non selective [4] calcium channels, and to trigger the release of Ca2+ from intracellular stores [5]. In contrast, free AA has also been shown to inhibit Ca2+ oscillations [6], to inhibit SOC-mediated Ca2+ entry [6,7], and to fail to activate Ca2+ permeable channels in liver cells [7].
Exogenous AA induces cell death in different cell types, including: mouse cortical neurons [8], human epithelial cell line [9], pig proximal tubule-like epithelial cell line [10], human promyelocitic cell line [11], neuronal cell line [12], rat hepatoma cell line [13], and CYP2E1-overexpressing human HepG2 cells [14] and rat liver primary hepatocytes [15]. The mechanisms of AA toxicity appear to be complex and are not fully understood [16]. These include oxidative metabolism of AA to biologically active eicosanoids and/or reactive oxygen species [8,9,14], induction of the mitochondrial permeability transition [13,17], accumulation of cellular ceramides [10,11] and intracellular calcium regulation [12]. An increase of intracellular calcium may aggravate the mechanism of cell injury and accelerate the time of onset of the mitochondrial permeability transition [18,19], and activate Ca2+-dependent hydrolases such as calpain and phospholipase A2 [20]. The role of calcium in AA-induced cytotoxicity seems to depend on the experimental model under study, as increased release of calcium from intracellular stores was related to AA-dependent cell death in a neuronal cell line [12], but Ca2+ influx was not involved in AA toxicity in PC12 cells [16].
Alcohol liver toxicity has been shown to require or be enhanced by diets containing high levels of polyunsaturated fatty acids [21–23]. This toxicity is associated with oxidative damage and lipid peroxidation, and with elevations in CYP2E1 levels [24,25]. Compared with other forms of cytochrome P450, CYP2E1 exhibits a higher rate of oxidase activity when purified [26,27]; enhanced oxidase activity would result in the increased production of O2− and H2O2, which in the presence of chelated iron can produce reactive hydroxyl radical [28,29]. The biochemical and toxicological properties of CYP2E1 have recently been reviewed [30,31]. Our laboratory has been studying interactions between CYP2E1 and AA in HepG2 and hepatocyte culture models, to mimic conditions which are believed to occur during in vivo alcohol toxicity [21–23]. Exogenous AA has been shown to promote toxicity in CYP2E1-expressing liver cells [14,15]. The role of CYP2E1 in promoting cellular AA toxicity was related to AA oxidation by CYP2E1-generated reactive oxygen species with the production of toxic lipid oxidation products, rather than direct CYP2E1 metabolism of AA to active metabolites [14,15].
Considering that AA can activate, inhibit, or have no effect on cellular calcium fluxes, and that the role of calcium in AA toxicity seems to depend on the cellular model under study (see above), the objectives of this work were: i) to assess intracellular calcium levels in CYP2E1-expressing HepG2 cells exposed to exogenous AA; ii) to evaluate the role of intracellular calcium and calcium activated enzymes in the toxicity mediated by exogenous AA in CYP2E1-expressing liver cells (HepG2 and primary hepatocytes).
Materials and methods
Chemicals
G418 was from Invitrogen (Carlsbad, CA). Ethanol 95% was from Pharmaco Products (Brookfield, CT). Pluronic acid was from Molecular Probes (Eugene, OR). 3H-AA was from Perkin Elmer (Boston, MA). Protein concentration was measured using the BioRad DC Protein assay (Hercules, CA). Calpeptin was from Biomol (Plymouth Meeting, PA). PD150606 was from Calbiochem (San Diego, CA). Antibodies were from Santa Cruz (Santa Cruz, CA). Most other chemicals used were from Sigma Chemical Company (St Louis, MO).
Culture and treatment of cells
Two human hepatoma HepG2 cell lines described in [32], were used as models in this study: E47 cells, which constitutively express human CYP2E1, and C34 cells, which are HepG2 cells transfected with the empty pCI vector. Both cell lines were grown in MEM containing 10% fetal bovine serum and 0.5 mg/mL of G418 supplemented with 100 units/mL of penicillin and 100 μ g/mL of streptomycin, in a humidified atmosphere in 5% CO2 at 37 °C. Cells were subcultured at a 1:5 ratio once a week. For the experiments, cells were plated at a density of 100000 cells/mL and incubated for 12 h, in MEM supplemented with 5% fetal bovine serum and 100 units/mL of penicillin and 100 μ g/mL of streptomycin (MEMexps). After this period, the medium was replaced with MEMexps or SMEMexps which has the same composition as MEMexps except for the lack of calcium. When SMEM was used, the cell culture medium contained FBS treated with Chelex 100 (10g/100 mL) overnight at 4°C in order to deplete FBS of calcium. The medium was supplemented with antioxidants or enzyme inhibitors for 1h, prior to the addition of AA (0 or 20 μ M). In some experiments, the cells were depleted of calcium before the addition of AA, following the procedure described in [33], pre-incubating the cells for 1h in SMEMexps with 5 μ M thapsigargin + 100 nM ionomycin, washing with PBS, and adding SMEMexps. The cells were incubated with AA for variable periods (up to 12h) before the biochemical analyses. The second model used primary hepatocytes from pyrazole-treated rats. Male Sprague-Dawley rats, 150–170 g body weight were injected intraperitoneally with pyrazole, 200 mg/kg body weight, once a day for 2 days to induce CYP2E1. After overnight fasting, rat hepatocytes were isolated by a two-step collagenase perfusion method [34]. Induction of CYP2E1 was validated by catalytic activity with 7-MFC [35]. Cell viability was generally about 90%. Hepatocytes were seeded at a density of 50000 cells/mL in MEMexps, the medium was changed 6 hours after seeding, and the cell culture experiments were initiated basically as described for HepG2 cells.
Measurement of phospholipase A2 (PLA2) activity in situ
PLA2 activation following exposure to exogenous AA was monitored in cultured cells using tritiated arachidonic acid as described in Sergeeva et al. (2002) [36]. 100000 cells were plated onto 24 well plates in MEMexps. Cells were first labeled with 0.2 μ Ci/ml 3H-AA (1 nM AA), in MEMexps for 12h. Cells were washed three times with PBS, preincubated with inhibitors or depleted of calcium, and incubated with MEMexps or SMEMexps containing 0 or 20 μ M AA for an additional 1 to 6h-period. To evaluate 3H-AA release, the medium containing the released 3H-AA was removed, placed in eppendorf tubes and centrifuged for 5 min at 6000 rpm. The supernatant was transferred to scintillation vials and the pellet containing detached cells was kept. The cells in each well were resuspended by adding 500 μ l of 0.1% Triton X-100. The content of each well was transferred to the eppendorf tubes containing the corresponding cellular pellet, and vortexed. Finally, the suspension was transferred to scintillation vials. 4 ml of scintillation fluid was added to each vial, and after vigorously shaking, the radioactive content was determined by scintillation counting using a β -counter. The data were expressed as percentage of cellular 3H-AA released: 100x[3H-AA released/(3H-AA incorporated+3H-AA released)]. Pilot experiments indicated that 28±1% of the initial 3H-AA was taken up by the cells, and 83±1% of the radioactivity taken up by the cells was esterified in phospholipids.
Cytotoxicity measurements
100000 cells were plated onto 24 well plates and after the corresponding treatment, the medium was removed, and cell viability was evaluated by the MTT test [37].
Measurement of intracellular calcium
Intracellular calcium levels were determined with the fluorescent calcium indicator fluo3-AM by flow cytometry, or with fura2-AM by ratiometric fluorimetry. For fluo3-AM experiments, 5x 10⁵ cells were plated in 10 mm-Petri dishes and at the end of the various treatments the medium was replaced with 3 mL of MEMexps without fetal bovine serum plus 2.5 μ M fluo3-AM and 0.02% pluronic acid (stock solution x1000 in DMSO). Cells were incubated for 30 min at 37 °C. After loading, the cells were washed in PBS (to remove any dye non-specifically associated with the cell surface), trypsinized, and resuspended in 1 mL of MEMexps without fetal bovine serum plus 5 μ g of propidium iodide. Propidium iodide was used to assay for the viable cell population as these cells exclude this dye, whereas non-viable cells take up this dye. The measurement of [Ca2+]i was performed by flow cytometry analysis of 5000 cells using Cell Quest software. Intracellular calcium level was evaluated as fluo3 fluorescence intensity in propidium iodide negative (i.e. viable) cells [38]. 10 μ M ionomycin was applied to one sample before each experiment to check for comparable loading of the cells and thus served as a positive control. The inhibitors tested did not interfere with the quantification of the fluorescence (488/525 nm excitation/emission) of a standard fluo3-Ca2+ solution.
For fura2-AM measurements, we followed the protocol described by Rameh et al. (1998) [39] in HepG2 cells. E47 cells were detached from the plate using HBSS buffer (118 mM NaCl, 4.6 mM KCl, 10 mM glucose, 20 mM Hepes pH 7.2) containing 0.02% EDTA, resuspended in HBSS with 1 mM CaCl2, and incubated with 1 μ M fura2-AM in the dark for 1h at 37°C. Cells were washed with HBSS/CaCl2, and resuspended in HBSS/CaCl2 at a density of 1x10⁶ cells/mL. 10 mM EGTA was added at the beginning of the experiment, followed by a 60s-equilibration period [39]. Intracellular free calcium measurements were performed at 37°C using a ratiometric fluorescence spectrophotometer (Perkin Elmer LS 50B). Intracellular Ca2+ concentration was estimated as described by Grynkiewicz et al. (1985) [40] from the relationship:
, where R is F340/F380 ratio, Rmin and Rmax are the ratios with 50 mM digitonin, and 50 mM digitonin + 11 mM CaCl2, respectively [39]. Kd represents the apparent dissociation constant of Fura-2 (224 nM) and Fmin(380)/Fmax(380) are the fluorescence values of digitonized cells without or with 11 mM CaCl2, respectively.
Lipid peroxidation assay
The production of thiobarbituric acid-reactive substances (TBARS) was assayed as previously described [41]. The protein concentration of the cell suspension was determined using a protein assay kit based on the Lowry assay (BioRad DC kit). The concentration of MDA was calculated from a standard curve prepared using malonaldehyde bisdimethylacetal [42].
Flow cytometry analysis of the mitochondrial membrane potential
The mitochondrial transmembrane potential was analyzed from the accumulation of rhodamine 123, a membrane-permeable cationic fluorescent dye. Cells were plated onto 6 well plates, and at the end of the treatment the medium was replaced with fetal bovine serum-free MEMexps containing 5 μ g/ml rhodamine 123, and incubated at 37 °C for 1 h. The cells were then harvested by trypsinization, washed with PBS, and resuspended in 1 mL of fetal bovine serum-free MEMexps. The intensity of fluorescence from rhodamine 123 was determined using a BD FACSCalibur Flow Cytometer (San Jose, CA) as previously described [41].
Western blots
After washing the cells with PBS, whole cell extracts were prepared by incubating the cells on ice for 15 min in extraction buffer (50 mM Tris-HCl, pH 7.5, 150 mM NaCl, 0.1%SDS, 0.5% Na-deoxycholate, and 1% IGEPAL CA-630). Lysates were centrifuged at 15000 rpm at 4°C to remove insoluble material, and protein concentrations were measured using the BioRad DC protein assay kit. Protein samples (30 μ g) were separated by SDS-PAGE, transferred to nitrocellulose membranes, and incubated with primary and secondary antibodies. Antibodies were used at the following dilutions: anti GRP 94 (1:1000), anti calreticulin (1:1000), anti- β -actin (1:10000) and anti-α -spectrin degradation products (1:1000).
CYP2E1 activity in intact cells
CYP2E1 enzymatic activity was determined in E47 cells, and in primary hepatocytes from pyrazole-treated rats. Incubations (in duplicate) were performed using 1 millon cells/mL of PBS supplemented with 5.5 mM glucose, 1.0 mM MgCl2, and CaCl2 (0 or 1.8 mM), at 37 °C in a CO2 incubator. Reactions were initiated by the addition of substrate at saturating concentration (100 μ M 7-MFC in acetonitrile), and after fixed intervals (0–2 h), cells were scraped and fluorescence of the suspension was determined at 409/530 nm [35].
Statistics
Data are expressed as mean ± standard error of the mean from 3 to 5 independent experiments run in duplicate. One-way analysis of variance (ANOVA) with subsequent post hoc comparisons by Scheffe was performed. A p < 0.05 was considered as statistically significant.
Results
Intracellular calcium stores and toxicity in AA-treated liver cells overexpressing CYP2E1
Initial studies evaluated whether cellular calcium levels were elevated under conditions in which AA promoted toxicity in CYP2E1 expressing liver cells. E47 cells exposed to 20 μ M AA in MEM medium (containing 1.8 mM Ca2+) showed a time-dependent loss of viability evaluated as a decrease of MTT reduction or an increase in PI staining, starting after 3h of incubation, with a 50% inhibition of MTT reduction after around 12h of incubation (Fig. 1A). Experiments were also performed using primary hepatocytes from pyrazole-treated rats (with elevated levels of CYP2E1). There was a concentration-dependent loss of viability in the primary hepatocytes treated with AA for 24h in MEM, with 50% loss of viability occurring at 60 μ M AA (Fig. 1B). Toxicity of AA in E47 cells and in primary rat hepatocytes in MEM was associated with an increase in cell volume, cytoplasmic fragmentation, cell detachment, and blebbing (Fig. 1C).
Fig. 1.
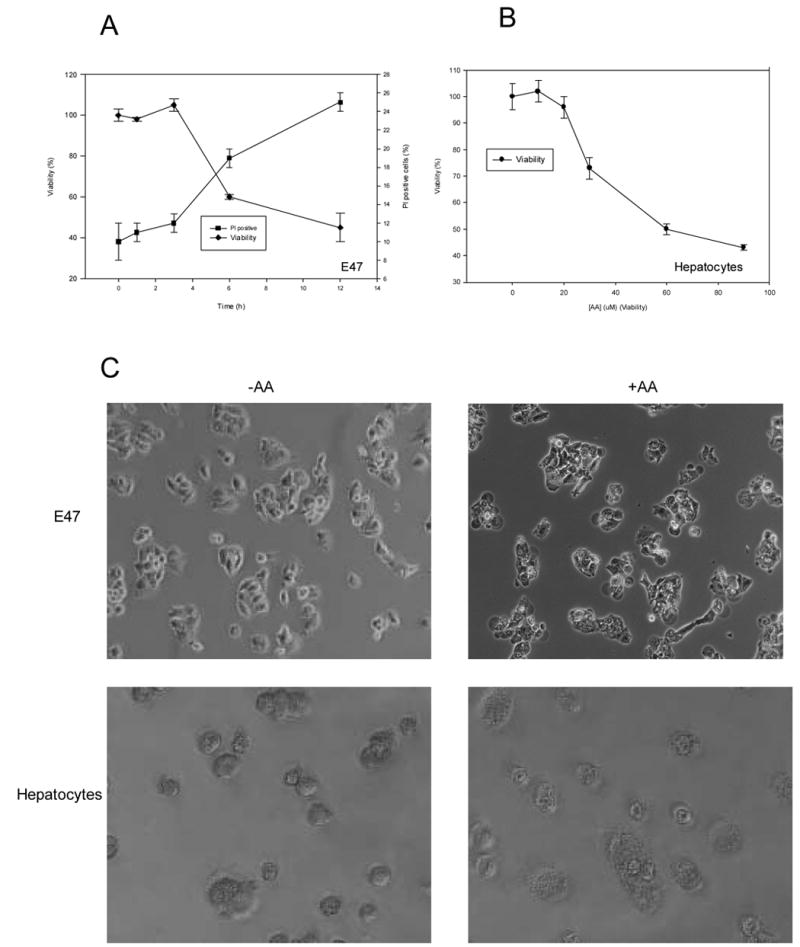
AA toxicity in liver cells. A) E47 cells were incubated for 0–12h in the presence of 20 μ M AA in MEM (1.8 mM Ca2+), and at specific time points viability was assessesed as MTT reduction activity, and plasma membrane integrity was determined as PI staining by flow cytometry. B) Primary hepatocytes from pyrazole-treated rats were exposed to AA (0–90 μ M) for 24h, and viability (MTT reduction activity) was assessed as a function of AA concentration. C) E47 cells or primary hepatocytes from pyrazole-treated rats were left untreated or exposed to AA (20 μ M, 12h for E47 cells and 60 μ M, 24h for primary hepatocytes). After this, cells were examined by phase-contrast photomicrography.
Experiments were carried out to evaluate intracellular calcium levels in the absence and presence of AA. Exogenous AA produced an approximate two-fold sustained increase in intracellular calcium in E47 cells (evaluated with fluo3-AM in viable cells to avoid complexities of calcium leaked in dead cells) (Table 1). This increase was totally prevented by antioxidants such as α -tocopherol and GSHee. These antioxidants largely prevented the decrease in cell viability produced by AA in the E47 cells (Table 1). The addition of AA to HepG2 cells not expressing CYP2E1, C34 cells, did not significantly increase lipid peroxidation, calcium levels or cell toxicity (Table 1).
Table 1.
Lipid peroxidation, intracellular calcium and viability in AA-treated CYP2E1-overexpressing HepG2 cells. E47 or control C34 cells were incubated for 9h with 0 or 20 μ M AA, in the presence or absence of antioxidants (50 μ M α -tocopherol or 1.5 mM glutathione ethyl ester). After this, intracellular calcium (fluo3 fluorescence), lipid peroxidation (TBARS content) and viability (MTT reduction) were assessed.
| Condition | Fluo3-Ca2+ fluorescence (AU) | TBARS (nmol/mg prot) | Viability (%) |
|---|---|---|---|
| E47 cells, -AA | 1.0 ± 0.1 | 0.3 ± 0.1 | 100 ± 2 |
| E47 cells, +AA | 1.8 ± 0.1* | 0.7 ± 0.1* | 56 ± 1* |
| E47 cells, +α T | 1.0 ± 0.1 | 0.2 ± 0.1 | 105 ± 4 |
| E47 cells, +α T +AA | 0.9 ± 0.1 | 0.3 ± 0.1 | 82 ± 3* |
| E47 cells, + GSHee | 0.9 ± 0.1 | 0.2 ± 0.1 | 95 ± 1 |
| E47 cells, + GSHee +AA | 1.1 ± 0.1 | 0.4 ± 0.1 | 84 ± 1* |
| C34 cells, -AA | 1.0 ± 0.1 | 0.2 ± 0.1 | 100 ± 2 |
| C34 cells, +AA | 1.0 ± 0.1 | 0.4 ± 0.1 | 87 ± 1* |
n.d.: not determined
significantly different (p<0.05) with respect to cells incubated in the same conditions, without AA
Because antioxidants blocked the AA-induced elevation in intracellular calcium and the decline in cell viability, lipid peroxidation was evaluated as one index of oxidative stress produced by AA in the E47 cells. TBARS content increased in E47 cells exposed to AA. The increase in lipid peroxidation caused by AA in E47 cells was inhibited by the antioxidants α -tocopherol and glutathione ethyl ester, suggesting that AA plus CYP2E1-induced oxidative stress was central to the subsequent toxicity. α -Tocopherol did not inhibit CYP2E1 activity in situ using 7-MFC, suggesting that α -tocopherol is most probably acting as an antioxidant and not a CYP2E1 inhibitor (data not shown). To evaluate whether TBARS arised from oxidation of AA incorporated into lipids, or of unincorporated exogenous AA, a control experiment was performed where E47 cells were exposed to 20 μ M AA in the presence of 0.2 μ Ci/mL 3H-AA (1 nM 3H-AA). After 3h of incubation, the cells were washed with PBS, lipids extracted by Folch, separated by TLC, and the distribution of the radioactive mark analyzed with the use of authentic standards (phosphatidylcholine, Rf=0; AA, Rf=0.37; corn oil triglycerides, Rf=0.72) [41]. The majority of the 3H-AA was incorporated into triglycerides (73%), followed by phospholipids (26%). Only 1% of the radioactive mark corresponded to free, unincorporated AA. These results suggest that TBARS were mainly produced by the oxidation of AA incorporated into the lipid fraction, and not oxidation of unincorporated exogenous AA.
Studies were carried to evaluate possible sources for the increase in intracellular calcium produced by AA in the E47 cells. To evaluate the possible effect of AA in the amount of Ca2+ stored within the ER in CYP2E1-expressing HepG2 cells cells in the absence of cellular toxicity (3h of incubation, 20 μ M AA), we used ionomycin (Ca2+ ionophore) that, in the absence of external Ca2+, releases Ca2+ from the ER in a receptor independent manner [43,44]. The principle of the assay is shown in Fig. 2A, whereby addition of ionomycin causes an immediate release of Ca2+ from control E47 cells. Intracellular Ca2+ levels, prior to the addition of ionomycin, were higher in the AA-pretreated cells (about 110 nM) than the non-treated cells (about 75 nM), likely, a reflection of Ca2+ release from the ER stores by the AA pretreatment (Fig 2B). Because of this prior depletion of stored calcium, Ca2+ release from ER stores induced by ionomycin was significantly decreased in E47 cells pretreated with AA (about 50 nM increase) with respect to untreated E47 cells (about 140 nM increase) (Fig 2B). To evaluate the possible role of lipid peroxidation on the effects of AA on stored calcium (versus AA metabolites or AA by itself), cells were preincubated with α -tocopherol (an effective liposoluble antioxidant) before exposing the cells to AA. The decrease in Ca2+ release from ER stores induced by ionomycin in AA-treated cells was blocked by preincubating the cells with α -tocopherol (Fig. 2B). Note that α -tocopherol prevents the elevation in Ca2+ levels produced by AA and “restores” the large release of stored Ca2+ produced by ionomycin. Thus, the AA-induced release of Ca2+ from ER stores requires AA-induced lipid peroxidation. Calcium manipulation did not alter in these conditions the levels of typical ER stress proteins calreticulin or GRP94 (data not shown).
Fig. 2.
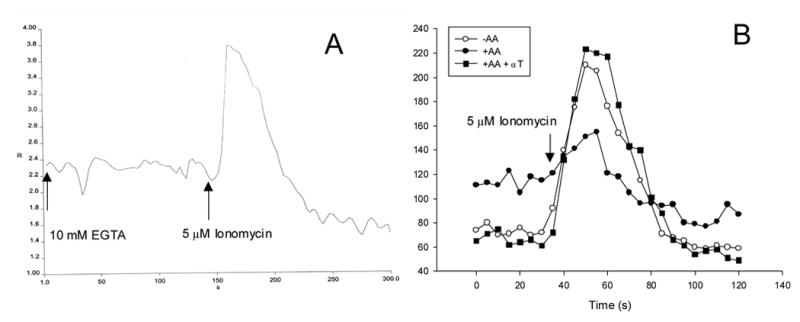
Effect of AA on ionomycin-sensitive Ca2+ stores. Panel (A) shows the principle of the assay whereas panel (B) shows the effect of AA and α -tocopherol (α T). E47 cells were incubated in MEM with or without 20 μ M AA or 100 μ M α T for 3h, detached as described in Materials and Methods, incubated with 1 μ M fura2-AM for 1h, and washed to remove unincorporated fura2. Cells were resuspended in a medium containing 10 mM EGTA at a density of one million cells/mL, in a fluorometer cuvette. After an equilibration period at 37°C with stirring, 5 μ M ionomycin was added. Ratiometric readings (340/380nm excitation, 510nm emission) were taken during 5 min (A). After this period, 50 mM digitonin and 11 mM CaCl2 were added sequentially to obtain minimum and maximum fluorescent readings, respectively, and final results were expressed as concentration of intracellular calcium vs time (B).
If calcium release from intracellular stores is a critical event in the cytoxicity by AA in CYP2E1-expressing cells, then a prior depletion of intracellular calcium should be protective. Calcium depletion was accomplished by washing the cells with thapsigargin + ionomycin in SMEM medium (a medium with the same composition as MEM except for the lack of added calcium), and further incubating the cells in SMEM, as described in Materials and methods. AA toxicity was practically completely prevented in calcium-depleted cells (Fig. 3A and 3B). In contrast, AA caused toxicity in E47 cells and in pyrazole-treated hepatocytes almost to the same extent in SMEM medium as in MEM (Fig. 3A, 3B), thus removal of extracellular Ca2+ did not significantly inhibit the AA toxicity in the liver cells, but depletion of intracellular calcium stores did.
Fig. 3.
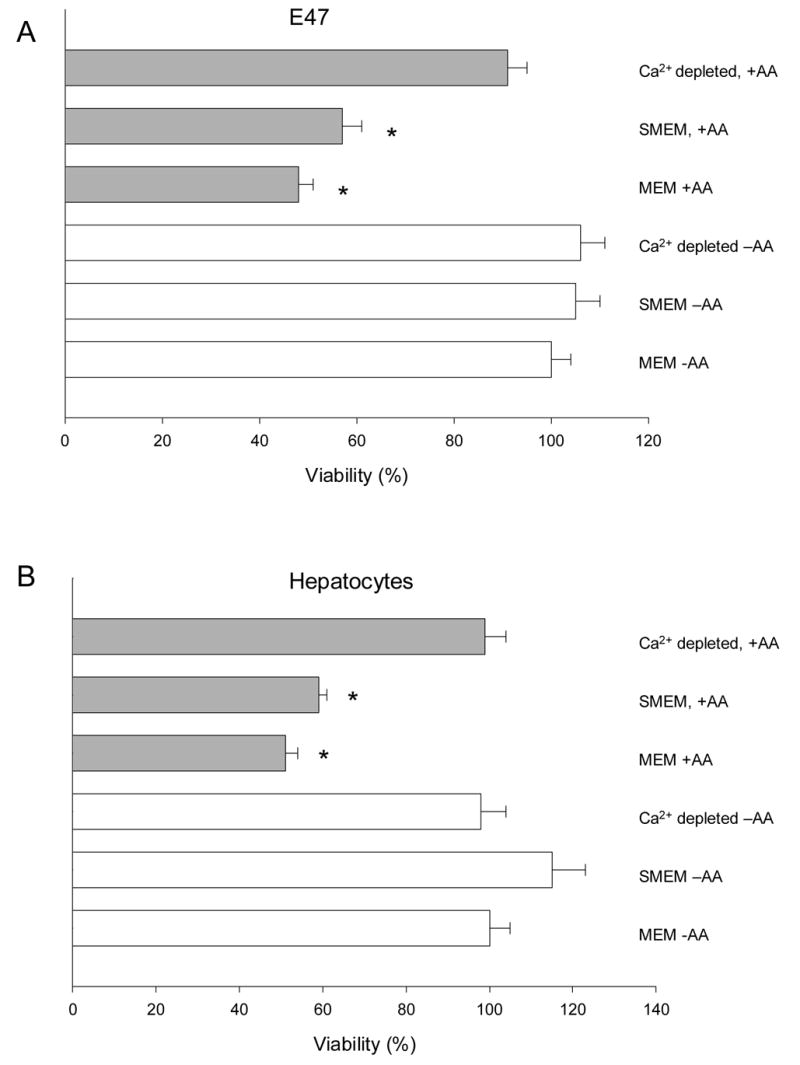
Effect of calcium manipulation on cytotoxicty of AA in CYP2E1-overexpressing liver cells. E47 cells (A), or primary rat liver cells from pyrazole-treated rats (B) were plated onto 24-well plates, and preincubated for 1h with MEM, SMEM, or SMEM with 5 μ M thapsigargin + 100 nM ionomycin. After this, cells were washed with PBS, and culture medium was added back (MEM if preincubated with MEM, or SMEM if preincubated in SMEM). AA (0 or 20 μ M) was added to the medium, and after 12h, viability was evaluated by the MTT test. *Significantly different (p<0.05) with respect to cells incubated in the same conditions, without AA.
To evaluate whether the AA toxicity was primarily necrotic or apoptotic, or whether the different incubations altered the mode of toxicity, cells were stained with PI or annexin V. In the absence of AA, E47 cells in MEM, SMEM or Ca2+-depleted were viable with low PI and annexin V staining (lower left quadrants of the dot plots, Fig. 4). Treatment with AA caused increases in PI staining for E47 cells incubated in MEM and SMEM (Fig. 4, upper left quadrants) but not in Ca2+-depleted conditions. No evidence of annexin V staining (lower right quadrants) was detected in AA-treated E47 cells in any condition, thus toxicity was necrotic and not apoptotic (Fig. 4).
Fig. 4.
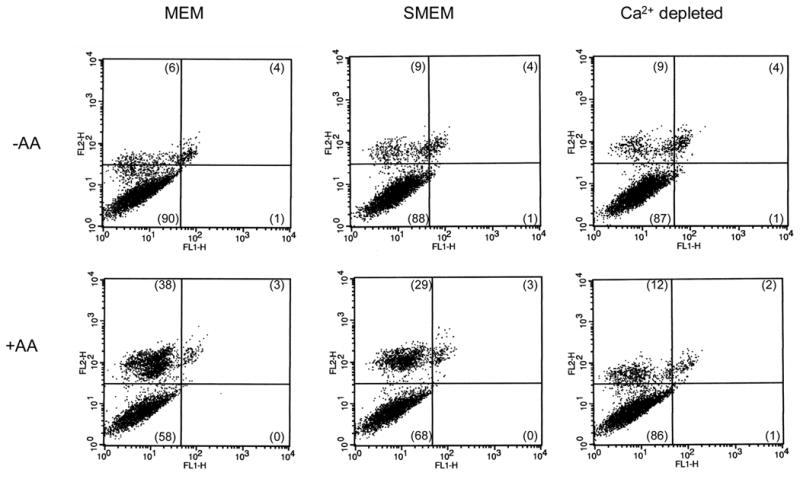
Annexin V-PI staining in E47 cells exposed to AA. E47 cells were depleted of calcium (Ca2+ depleted, 1h preincubation in SMEM + thapsigargin + ionomycin, further incubated in SMEM), or incubated in the absence of extracellular calcium (SMEM, no added extracellular calcium) or left in regular MEM medium (MEM, 1.8 mM extracellular calcium). Cells were exposed to 20 μ M AA for 9h (+AA), or left untreated (−AA). After this period, cells were stained for annexin V and PI following the protocol described in the Biovision kit (Mountain View, CA) for adherent cells. The cells were analyzed by flow cytometry. Representative dot plots where FL2 represents the fluorescence of PI, and FL1 the fluorescence of annexin V. Numbers in parentheses represent the precentage of cells in each quadrant.
Role of Ca2+-activated hydrolases in AA-dependent toxicity in CYP2E1-expressing cells
To link the increase in intracellular calcium to the AA-induced toxicity, the effect of specific inhibitors for Ca2+-activated enzymes that might be involved in the AA-induced cell toxicity was evaluated. Optimal concentrations were first selected considering the maximal concentration of each agent that did not produce significant toxicity by itself under the experimental conditions (data not shown). Inhibitors of calpain (calpeptin, PD150606), or calmodulin (calmidazolium, W13) did not prevent or blunt the AA toxicity in E47 cells (Fig. 5A). Calpain activation as evaluated by fragmentation of α -spectrin to a specific 145 kDa fragment was not observed in E47 cells treated with AA (data not shown). On the contrary, phospholipase A2 inhibitors (quinacrine, PACOCF3, aristolochic acid) significantly (p<0.05, ANOVA) protected against the AA dependent toxicity (Fig. 5A). PACOCF3 also significantly (p<0.05, ANOVA) prevented AA toxicity in the CYP2E1 overexpressing hepatocytes; complete prevention was observed at 5 μ M PACOCF3 (Fig. 5B). PACOCF3 and aristolochic acid have been described as inhibitors of the calcium-dependent isoform of PLA2 [17,45], suggesting that PLA2 activation by calcium may be involved in AA toxicity in CYP2E1-expressing liver cells. To further evaluate this, the activity of PLA2 in situ was assessed, measuring the release from the cells of pre-incorporated tritiated AA. Addition of 20 μ M AA to E47 cells caused a time-dependent release of 3H-AA (Fig. 6A). Release of 3H-AA was prevented by preincubation with α -tocopherol and by the PLA2 inhibitors. AA did not increase 3H-AA release from the C34 cells, indicating that AA stimulation of PLA2 activity was CYP2E1-dependent (Fig. 6A). In primary rat hepatocytes, AA also increased 3H-AA release in a manner that was inhibited by α -tocopherol and PACOCF3 (Fig. 6B).
Fig. 5.
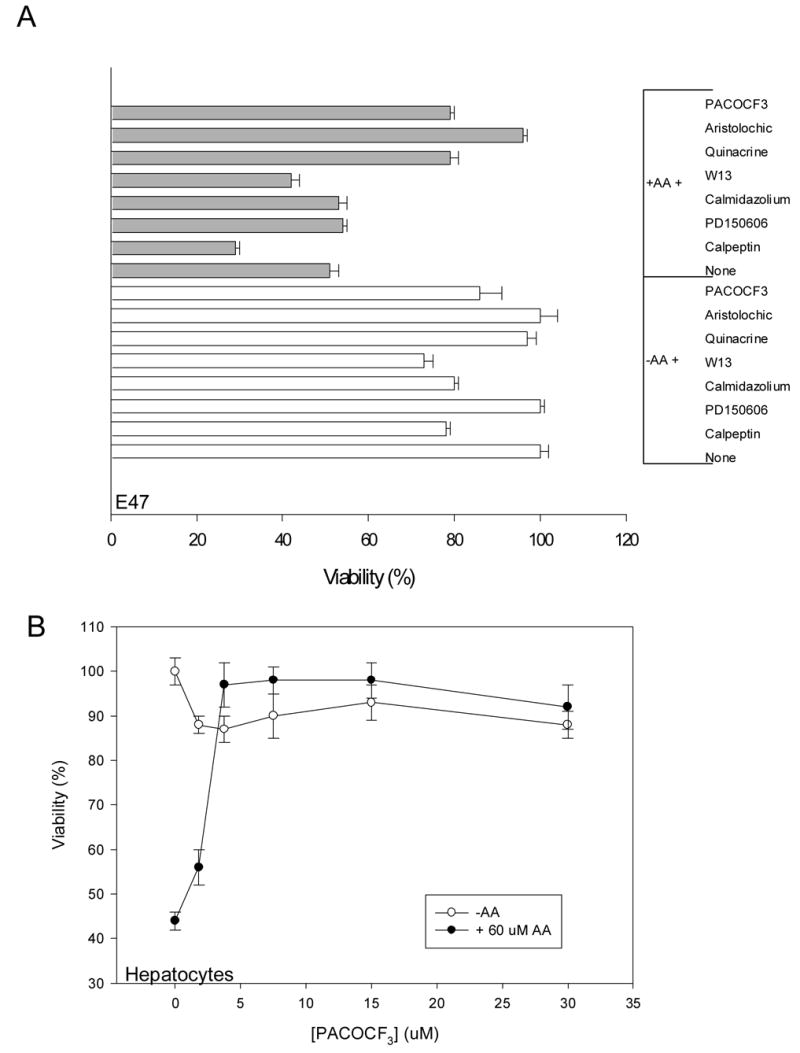
A) Effect of calpain, calmodulin and PLA2 inhibitors on AA toxicity in E47 cells. E47 cells were preincubated for 1h with 50 μ M calpeptin, 100 μ M PD150606, 1 μ M calmidazolium, 5 μ M W13, 10 μ M quinacrine, 100 μ M aristolochic acid, 10 μ M PACOCF3, or solvent (vehicle), followed by the addition of AA (0 or 20 μ M). The cells were incubated for 12h, followed by an MTT assay for viability. B) Effect of PACOCF3 on AA toxicity in primary hepatocytes from rats treated with pyrazole. The cells were preincubated for 1h with different concentrations of PACOCF3 (0–30 μ M), followed by the addition of AA (0 or 60 μ M). After 24h of incubation, cell viability was assessed by MTT reduction.
Fig. 6.
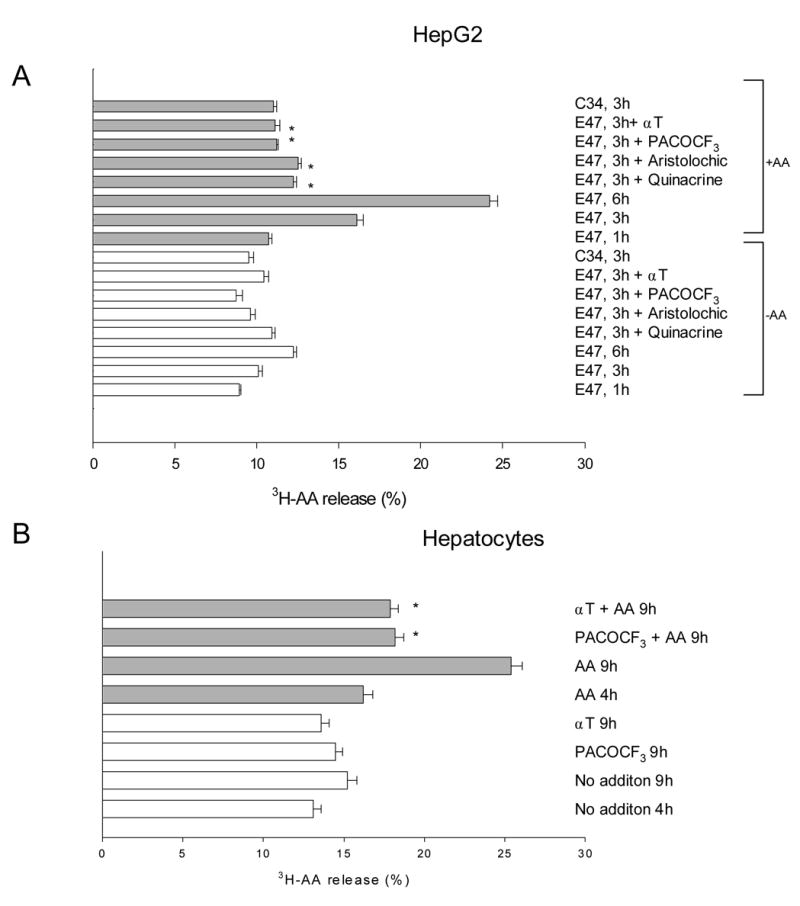
Release of preincorprated 3H-AA in liver cells overexpressing CYP2E1 (HepG2 -A- and primary rat hepatocytes -B-). The cells were loaded with 3H-AA (0.2 μ Ci/mL, 1 nM) overnight, and then exposed to 20 μ M AA. In some experiments, the cells were preincubated for 1h with 50 μ M α -tocopherol, 100 μ M aristolochic acid, 10 μ M quinacrine, or 10 μ M PACOCF3 before the addition of 20 μ M AA. After variable incubation times (1–9h), released 3H-AA was measured as described in Experimental Procedures. *Significantly different (p<0.05) with respect to cells incubated in the same conditions, in the absence of inhibitors.
Since inhibitors of PLA2 protected against the AA plus CYP2E1-dependent toxicity, we evaluated the effect of PACOCF3 and aristolochic acid on CYP2E1 activity and lipid peroxidation to ascertain that these inhibitors were not blocking reactions, CYP2E1, lipid peroxidation, upstream of PLA2. PACOCF3 and aristolochic acid did not affect CYP2E1 activity in situ or the increase in lipid peroxidation caused by AA (Table 2). Aristolochic acid, quinacrine or PACOCF3 did not affect lipid peroxidation in rat liver microsomes exposed to ADP-Fe + NADPH, suggesting they are not acting as direct antioxidants (data not shown). These results suggest that the PLA2 inhibitors were acting downstream of CYP2E1 and the increase in lipid peroxidation. PLA2 inhibitors did not significantly alter the sustained increase in intracellular calcium caused by AA, thus the increase in intracellular calcium is also upstream of PLA2.
Table 2.
Effect of PLA2 inhibitors on intracellular calcium, CYP2E1 activity in situ and lipid peroxidation. E47 cells were incubated for 9h with 0 or 20 μ M AA, in the presence or absence of PLA2 inhibitors (10 μ M PACOCF3 or 100 μ M aristolochic acid). After this, intracellular calcium (fluo3 fluorescence), lipid peroxidation (TBARS content) and CYP2E1 activity in situ (7-MFC oxidation) were assessed.
| Condition | Fluo3-Ca2+(AU) | CYP2E1 activity (AU/h) | TBARS (nmol/mg prot) |
|---|---|---|---|
| E47 cells, -AA | 1.0 ± 0.1 | 35 ± 4 | 0.4 ± 0.1 |
| E47 cells, +AA | 2.1 ± 0.1* | n.d. | 0.7 ± 0.1* |
| E47 cells, +PACOF3 | 1.0 ± 0.1 | 40 ± 6 | 0.3 ± 0.1 |
| E47 cells, +PACOCF3 +AA | 1.7 ± 0.1* | n.d. | 0.6 ± 0.1* |
| E47 cells, +Aristolochic | 1.0 ± 0.1 | 41 ± 5 | 0.4 ± 0.1 |
| E47 cells, + Aristolochic +AA | 1.6 ± 0.1* | n.d. | 0.8 ± 0.1* |
n.d. not determined
significantly different (p<0.05) with respect to E47 cells incubated without AA
Changes in PLA2 activity, lipid peroxidation, CYP2E1 activity and intracellular calcium in control cells or calcium-depleted cells were next determined in order to link these events to the AA-induced toxicity. Removal of extracellular calcium or intra + extra cellular calcium did not decrease CYP2E1 activity or lipid peroxidation elicited by AA in E47 cells (Table 3). The AA induced increase in PLA2 activity as reflected by 3H-AA release was similar in MEM and SMEM (net 3H-AA release) which may explain the similar extent of toxicity by AA in MEM and SMEM (Fig. 3). Thus, extracellular Ca2+ is not necessary for the AA-induced toxicity. However, the Ca2+ depletion almost completely inhibited 3H-AA release induced by AA (Table 3). This may explain the lack of toxicity in Ca2+ depleted cells (Fig. 4) and emphasizes the critical role of stored Ca2+ in the AA-induced toxicity. Removal of extracellular calcium caused a significant inhibition (80%) of the sustained increase of intracellular calcium caused by AA in MEM, suggesting that the bulk of the increase in intracellular calcium corresponds to influx of calcium from the extracellular space.
Table 3.
Effect of calcium manipulation on intracellular calcium, CYP2E1 activity in situ , lipid peroxidation, and 3H-AA release. E47 cells were preincubated for 1h in MEM, or SMEM, or SMEM containing 5 μ M thapsigargin + 100 nM ionomycin (Ca2+-depleted). The cells were washed with PBS, and culture medium was added back (MEM if the cells were preincubated with MEM, SMEM if the cells were preincubated with SMEM), containing 0 or 20 μ M AA. After a 6h incubation period, intracellular calcium (fluo3 fluorescence), lipid peroxidation (TBARS content), CYP2E1 activity in situ (7-MFC oxidation), and PLA2 activation (3HAA-release) were assessed. The parentheses show the net increase in 3HAA release produced by AA (% release +AA minus % release –AA).
| Condition | Fluo3-Ca2+ (AU) | TBARS (nmol/mg prot) | CYP2E1 (AU/h) | 3HAA-release (%) |
|---|---|---|---|---|
| MEM, -AA | 1.0 ± 0.1 | 0.3 ± 0.1 | 34 ± 5 | 10.6 ± 0.2 |
| SMEM, -AA | 1.0 ± 0.1 | 0.3 ± 0.1 | 38 ± 4 | 9.1 ± 0.4 |
| Ca2+ depleted, -AA | n.d. | 0.3 ± 0.1 | 50 ± 2* | 8.9 ± 0.3 |
| MEM, +AA | 2.1 ± 0.1* | 0.7 ± 0.1* | n.d. | 16.2 ± 0.3* (5.6) |
| SMEM, +AA | 1.2 ± 0.1 | 0.7 ± 0.1* | n.d. | 14.2 ± 0.5* (5.1) |
| Ca2+ depleted, +AA | n.d. | 0.5 ± 0.1* | n.d. | 10.5 ± 0.3* (1.6) |
n.d. not determined
significantly different (p<0.05) with respect to E47 cells incubated without AA in MEM
Since AA induces toxicity in medium lacking extracellular calcium (SMEM), this toxicity was briefly characterized and compared to the toxicity which occurs in medium containing extracellular calcium (MEM). α -Tocopherol, aristolochic acid and PACOCF3 inhibited AA toxicity in E47 cells incubated in SMEM: 60% viability without inhibitors, 97%, 81% and 85% viability in the presence of α -tocopherol, PACOCF3 or aristolochic acid, respectively (data not shown), results analogous to effects in MEM. PACOCF3 also inhibited AA toxicity in SMEM in primary rat hepatocytes similar to its protection against AA toxicity in MEM (data not shown). Thus, lipid peroxidation and PLA2 play important roles in the AA-induced toxicity found in MEM and SMEM.
Role of mitochondria in AA toxicity in CYP2E1-expressing liver cells
To evaluate whether damage to the mitochondria play a role in the AA toxicity, and whether PLA2 contributes to any mitochondrial impairment, mitochondrial membrane potential (MMP) was assayed. Addition of AA caused a decline in MMP as reflected by an increase in the number of cells with low rhodamine 123 staining (cells in the M1 population, Fig. 7). This decrease in mitochondrial membrane potential caused by AA in MEM was partially prevented by pre-incubation with PTP inhibitors (fructose/trifluoperazine or cyclosporine A) suggesting that the decline in MMP was mediated by an AA-induced mitochondrial permeability transition. The decline in MMP was also partially prevented by PLA2 inhibitors (aristolochic acid, PACOCF3) (Fig. 7).
Fig. 7.
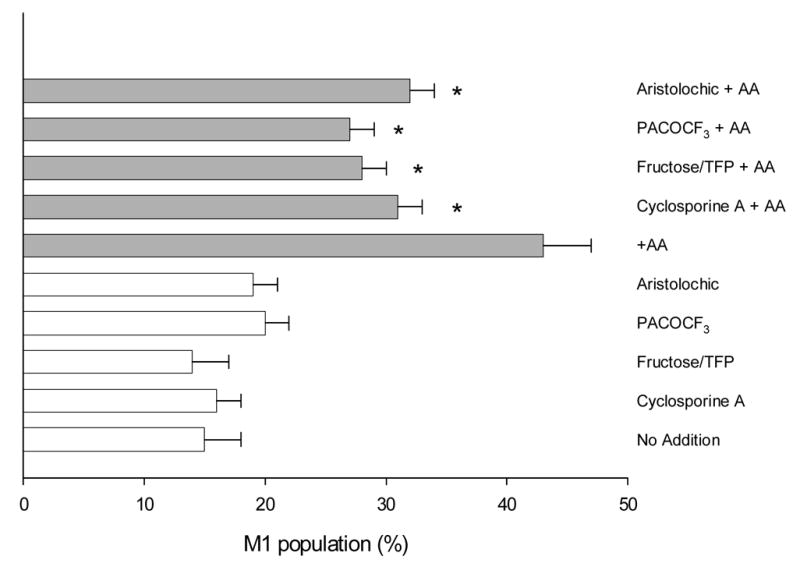
Mitochondrial membrane potential. E47 cells were preincubated with PTP inhibitors (fructose 10 mM/trifluoperazine 5 μ M or cyclosporine A 1 μ g/mL) or PLA2 inhibitors (100 μ M aristolochic acid or 10 μ M PACOCF3), and then exposed to AA (0 or 20 μ M) for 9h. Mitochondrial membrane potential was assessed by flow cytometry using rhodamine 123, and cells with low MMP are expressed as percentage of cells in the M1 fraction (low rhodamine 123 fluorescence). *Significantly different (p<0.05) with respect to cells incubated in the same conditions, in the absence of inhibitors.
Discussion
The results presented in this work suggest that AA-induced cell death in liver cells overexpressing CYP2E1 is mediated by release of calcium from intracellular stores and subsequent activation of PLA2: i) a partial depletion of ionomycin-sensitive calcium stores together with increased cytosolic calcium was detected prior to toxicity; ii) AA-mediated toxicity was prevented after depletion of intracellular calcium, but not after removal of extracellular calcium alone; iii) activation of PLA2 paralleled toxicity, both events were inhibited by PLA2 inhibitors and by depletion of intracellular calcium, but not after removal of extracellular calcium alone. Oxidative stress and lipid peroxidation in CYP2E1-expressing HepG2 cells is suggested to be the initiator of AA-induced intracellular calcium release, as α -tocopherol restored the amount of calcium in the ER, inhibited lipid peroxidation, PLA2 activation and cytotoxicity without altering CYP2E1 levels. CYP2E1 expression was critical for AA toxicity, as AA-treated C34 cells, which do not express CYP2E1, did not show increased lipid peroxidation, activation of PLA2 or cytotoxicity. These events are summarized in Fig 8 and further discussed below.
Fig. 8.
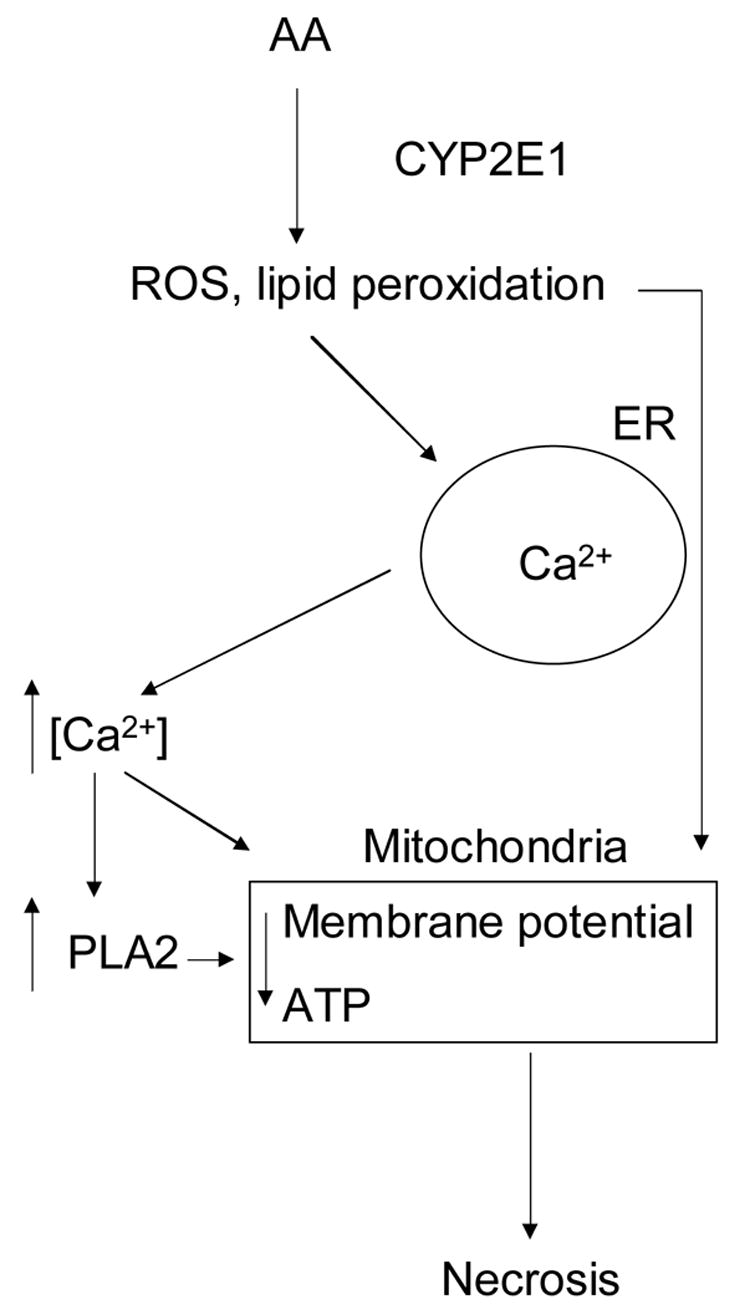
Role of calcium in AA-dependent toxicity in CYP2E1-expressing liver cells. See Discussion for details.
We propose that increased calcium derived from intracellular stores activates PLA2, which in turn increases membrane damage through phospholipid hydrolysis: PLA2 inhibitors which decrease 3H-AA-phospholipid hydrolysis prevent the AA toxicity, without affecting CYP2E1 activity or lipid peroxidation. Thus, the increase in PLA2 activity is downstream of CYP2E1, and the CYP2E1 plus AA-induced lipid peroxidation. It is important to note that although the sustained increase in intracellular Ca2+ produced by AA was blunted in SMEM compared to MEM, AA toxicity and activation of PLA2 was similar in MEM and SMEM. Hence, the extracellular Ca2+, in contrast to stored Ca2+, does not play a significant role in the AA toxicity or activation of PLA2 activity.
We hypothesize that AA+CYP2E1-induced lipid peroxidation, increased intracellular calcium and PLA2 activation are events that converge on mitochondria, inducing mitochondrial damage (decreased mitochondrial membrane potential which is blocked by PTP and PLA2 inhibitors) and ultimately, cell necrosis. Each of these, the elevated calcium, the enhanced lipid peroxidation, and the increased PLA2 activity which is likely to promote mitochondrial membrane damage, likely contribute to the mitochondrial dysfunction. The fact that toxicity is not blocked in SMEM, but almost completely blocked in calcium-depleted cells suggests that intracellular calcium stores are critical in AA+CYP2E1-dependent toxicity. Since AA toxicity in SMEM is still blocked by α -tocopherol and PLA2 inhibitors, release of stored calcium through lipid peroxidation and activation of PLA2 is still operative in SMEM similar to results in MEM. This is supported by the lack of inhibition of 3HAA-phospholipid hydrolysis in SMEM, and the practically complete inhibition of 3HAA release in calcium-depleted cells. These results were mainly obtained with HepG2 cells overexpressing CYP2E1 (E47 cells), but the basic aspects of this mechanism were replicated using primary rat hepatocytes overexpressing CYP2E1.
Thapsigargin and calcium ionophores are classical inducers of the ER stress response through ER calcium depletion [46]. Conditioning with thapsigargin or calcium ionophores prevented oxidative stress-dependent cell death in renal epithelial cells, through induction of ER stress proteins [47]. There are few studies on the ability of ER stress protein induction to provide cytoprotection in the liver [46]. After induction of ER stress, no protection against agents associated with oxidative stress (menadione, tert-butyl hydroperoxide) was observed in hepatoma cells (HepG2 and H4IIE), suggesting that protection afforded by the ER stress response may be cell type-specific [48]. Induction of ER stress does not seem to play a role in cytoprotection by pretreatment with thapsigargin and ionomycin in our model, as two common markers of ER stress (calreticulin and GRP94) were not induced after complete calcium depletion in E47 HepG2 cells. We conclude that inhibition of PLA2 activation is the key factor to consider in the cytoprotection by ER calcium depletion in our model.
Research into the mechanism of oxidative cell injury is shifting away from the central association of cytosolic calcium with lethal injury to focus on adverse effects of oxidants on mitochondria [49]. Our results suggest that in AA plus CYP2E1-dependent oxidative injury, influx of extracellular calcium does not play a central role in toxicity, but that activation of phospholipase A2, promotion of the mitochondrial permeability transition and loss of mitochondrial function is a general pathway for toxicity.
Nanji et al. [50,51] reported CYP2E1 induction, increased lipid peroxidation and elevated phospholipase A2 activity in rats treated with corn oil (unsaturated fat) plus ethanol for 1 month (intragastric infusion model), with respect to controls fed glucose instead of ethanol. Alcoholic liver injury developed only in the corn oil–ethanol-fed groups [50,51]. Increased oxidative stress and lipid peroxidation are critical pathogenic events for alcoholic liver disease [23]. In addition, ethanol administration in vivo increased the calcium content in the liver of rats and mice [52,53]. Our results suggest a possible connection between these reported events in alcoholic liver disease, which might lead to liver injury: alcohol+ unsaturated fat; increased CYP2E1; lipid peroxidation; increased intracellular calcium; phospholipase A2 activation; liver injury.
In summary, we suggest that AA-induced toxicity to CYPE1-expressing cells: (i) is associated with release of Ca2+ from intracellular stores that depends mainly on oxidative membrane damage; (ii) is associated with activation of PLA2 that depends on intracellular calcium and lipid peroxidation; iii) does not depend on the increased influx of extracellular calcium, and iv) depends on the effect of converging events (lipid peroxidation, intracellular calcium, activation of PLA2) on mitochondria to induce bioenergetic failure and necrosis. The basic signaling pathway proposed is described in Figure 8: AA and CYP2E1 activity leads to increased oxidative stess and lipid peroxidation, which induces calcium release from intracellular stores and activation of phospholipase A2, leading to cell necrosis through mitochondrial impairment.
Acknowledgments
This work was supported by United States Public Health Service Grant AA06610 from the National Institute on Alcohol Abuse and Alcoholism.
Abbreviations
- AA
arachidonic acid
- SOC
store-operated channel
- E47
HepG2 cell line derived after transfection with pCI-neo vector containing the human CYP2E1 cDNA
- C34
HepG2 cell line derived after transfection with pCI-neo vector
- MEMexps
MEM medium supplemented with 5% fetal bovine serum and 100 units/mL of penicillin and 100 μ g/mL of streptomycin
- SMEM
MEM medium lacking CaCl2
- PLA2
phospholipase A2
- MMP
mitochondrial membrane potential
- PACOCF3
palmityl trifluomethyl ketone
- ER
endoplasmic reticulum
- 7-MFC
7-methoxy-4-trifluoromethylcoumarin
- MTT
3 [4,5-dimethylthiazol-2-yl] 2,5-diphenyltetrazolium bromide
- TBARS
thiobarbituric acid reactive substances
- CYP2E1
cytochrome P450 2E1
- PBS
phosphate buffered saline
- FBS
fetal bovine serum
Footnotes
Publisher's Disclaimer: This is a PDF file of an unedited manuscript that has been accepted for publication. As a service to our customers we are providing this early version of the manuscript. The manuscript will undergo copyediting, typesetting, and review of the resulting proof before it is published in its final citable form. Please note that during the production process errors may be discovered which could affect the content, and all legal disclaimers that apply to the journal pertain.
References
- 1.Shuttleworth TJ. J Biol Chem. 1996;271:21720–21725. doi: 10.1074/jbc.271.36.21720. [DOI] [PubMed] [Google Scholar]
- 2.Watson EL, Jacobson KL, Singh JC, DiJulio DH. Cell Signal. 2004;16:157–165. doi: 10.1016/s0898-6568(03)00102-5. [DOI] [PubMed] [Google Scholar]
- 3.Mignen O, Shuttleworth TJ. J Biol Chem. 2000;275:9114–9119. doi: 10.1074/jbc.275.13.9114. [DOI] [PubMed] [Google Scholar]
- 4.Fiorio Pla A, Munaron L. Cell Calcium. 2001;30:235–244. doi: 10.1054/ceca.2001.0234. [DOI] [PubMed] [Google Scholar]
- 5.Packham DE, Jiang L, Conigrave AD. Cell Calcium. 1995;17:399–408. doi: 10.1016/0143-4160(95)90086-1. [DOI] [PubMed] [Google Scholar]
- 6.Sergeeva M, Strokin M, Wang H, Ubl JJ, Reiser G. Cell Calcium. 2003;33:283–292. doi: 10.1016/s0143-4160(03)00011-3. [DOI] [PubMed] [Google Scholar]
- 7.Rychkov GY, Litjens T, Roberts ML, Barritt GJ. Biochem J. 2005;385:551–556. doi: 10.1042/BJ20041604. [DOI] [PMC free article] [PubMed] [Google Scholar]
- 8.Kwon KJ, Jung YS, Lee SH, Moon C, Baik EJ. J Neurosci Res. 2005;81:73–84. doi: 10.1002/jnr.20520. [DOI] [PubMed] [Google Scholar]
- 9.Cao Y, Pearman AT, Zimmerman GA, McIntyre TM, Prescott SM. Proc Natl Acad Sci USA. 2000;97:11280–11285. doi: 10.1073/pnas.200367597. [DOI] [PMC free article] [PubMed] [Google Scholar]
- 10.Chen JK, Capdevila J, Harris RC. Mol Cell Biol. 2001;21:6322–6331. doi: 10.1128/MCB.21.18.6322-6331.2001. [DOI] [PMC free article] [PubMed] [Google Scholar]
- 11.Surette ME, Fonteh AN, Bernatchez C, Chilton FH. Carcinogenesis. 1999;20:757–763. doi: 10.1093/carcin/20.5.757. [DOI] [PubMed] [Google Scholar]
- 12.O'Neil BJ, McKeown TR, DeGracia DJ, Alousi SS, Rafols JA, White BC. Resuscitation. 1999;41:71–83. doi: 10.1016/s0300-9572(99)00028-3. [DOI] [PubMed] [Google Scholar]
- 13.Scorrano L, Penzo D, Petronilli V, Pagano F, Bernardi P. J Biol Chem. 2001;276:12035–12040. doi: 10.1074/jbc.M010603200. [DOI] [PubMed] [Google Scholar]
- 14.Chen Q, Galleano M, Cederbaum AI. J Biol Chem. 1997;272:14532–14541. doi: 10.1074/jbc.272.23.14532. [DOI] [PubMed] [Google Scholar]
- 15.Wu D, Cederbaum AI. J Biol Chem. 2003;278:1115–1124. doi: 10.1074/jbc.M207856200. [DOI] [PubMed] [Google Scholar]
- 16.Doroshenko N, Doroshenko P. Biochem Pharmacol. 2004;67:903–909. doi: 10.1016/j.bcp.2003.10.005. [DOI] [PubMed] [Google Scholar]
- 17.Penzo D, Petronilli V, Angelin A, Cusan C, Colonna R, Scorrano L, Pagano F, Prato M, Di Lisa F, Bernardi P. J Biol Chem. 2004;279:25219–25225. doi: 10.1074/jbc.M310381200. [DOI] [PubMed] [Google Scholar]
- 18.Susin SA, Zamzami N, Kroemer G. Biochim Biophys Acta. 1998;1366:151–165. doi: 10.1016/s0005-2728(98)00110-8. [DOI] [PubMed] [Google Scholar]
- 19.Crompton M. Biochem J. 1999;341:233–249. [PMC free article] [PubMed] [Google Scholar]
- 20.Kass GEN, Orrenius S. Environ Health Perspect. 1999;107:25–35. doi: 10.1289/ehp.99107s125. [DOI] [PMC free article] [PubMed] [Google Scholar]
- 21.Nanji AA, Zhao S, Sadrzadeh SM, Dannenberg AJ, Tahan SR, Waxman DJ. Alcohol Clin Exp Res. 1994;18:1280–1285. doi: 10.1111/j.1530-0277.1994.tb00119.x. [DOI] [PubMed] [Google Scholar]
- 22.Nanji AA, Jokelainen K, Tipoe GL, Rahemtulla A, Dannenberg AJ. J Pharmacol ExpTher. 2001;299:638–644. [PubMed] [Google Scholar]
- 23.Tsukamoto H, Lu SC. FASEB J. 2001;15:1335–1349. doi: 10.1096/fj.00-0650rev. [DOI] [PubMed] [Google Scholar]
- 24.Nordmann R, Ribiere C, Rouach H. Free Radic Biol Med. 1992;12:219–240. doi: 10.1016/0891-5849(92)90030-k. [DOI] [PubMed] [Google Scholar]
- 25.French SW, Wong K, Jui L, Albano E, Hagbjork AL, Ingelman-Sundberg M. Exp Mol Pathol. 1993;56:61–75. doi: 10.1006/exmp.1993.1006. [DOI] [PubMed] [Google Scholar]
- 26.Gorsky LD, Koop DR, Coon MJ. J Biol Chem. 1984;259:6812–6817. [PubMed] [Google Scholar]
- 27.Ekstrom G, Ingelman-Sunberg M. Biochem Pharmacol. 1989;38:1313–1319. doi: 10.1016/0006-2952(89)90338-9. [DOI] [PubMed] [Google Scholar]
- 28.Bondy SC. Toxicol Lett. 1992;63:231–241. doi: 10.1016/0378-4274(92)90086-y. [DOI] [PubMed] [Google Scholar]
- 29.Cederbaum AI. Free Radic Biol Med. 2001;31:1524–1526. doi: 10.1016/s0891-5849(01)00741-9. [DOI] [PubMed] [Google Scholar]
- 30.Caro AA, Cederbaum AI. Annu Rev Pharmacol Toxicol. 2004;44:27–42. doi: 10.1146/annurev.pharmtox.44.101802.121704. [DOI] [PubMed] [Google Scholar]
- 31.Gonzalez FJ. MutatRes. 2005;569:101–110. [Google Scholar]
- 32.Chen Q, Cederbaum AI. Mol Pharmacol. 1998;53:638–648. doi: 10.1124/mol.53.4.638. [DOI] [PubMed] [Google Scholar]
- 33.Hunton DL, Zou LY, Pang Y, Marchase RB. Am J Physiol Heart Circ Physiol. 2004;286:H1124–H1132. doi: 10.1152/ajpheart.00162.2003. [DOI] [PubMed] [Google Scholar]
- 34.Wu D, Clejan LA, Potter B, Cederbaum AI. Hepatology. 1990;12:1379–1389. doi: 10.1002/hep.1840120620. [DOI] [PubMed] [Google Scholar]
- 35.Ghosal A, Hapangama N, Yuan Y, Lu X, Horne D, Patrick JE, Zbaida S. Biopharm Drug Dispos. 2003;24:375–384. doi: 10.1002/bdd.374. [DOI] [PubMed] [Google Scholar]
- 36.Sergeeva M, Strokin M, Wang H, Ubl JJ, Reiser G. J Neurochem. 2002;82:1252–1261. doi: 10.1046/j.1471-4159.2002.01052.x. [DOI] [PubMed] [Google Scholar]
- 37.Denizot F, Lang R. J Immunol Methods. 1986;89:271–277. doi: 10.1016/0022-1759(86)90368-6. [DOI] [PubMed] [Google Scholar]
- 38.Caro AA, Cederbaum AI. J Biol Chem. 2002;277:104–113. doi: 10.1074/jbc.M107864200. [DOI] [PubMed] [Google Scholar]
- 39.Rameh LE, Rhee SG, Spokes K, Kazlauskas A, Cantley LC, Cantley LG. J Biol Chem. 1998;273:23750–23757. doi: 10.1074/jbc.273.37.23750. [DOI] [PubMed] [Google Scholar]
- 40.Grynkiewicz G, Poenie M, Tsien RY. J Biol Chem. 1985;260:3440–3450. [PubMed] [Google Scholar]
- 41.Caro AA, Cederbaum AI. J Biol Chem. 2003;278:33866–33877. doi: 10.1074/jbc.M300408200. [DOI] [PubMed] [Google Scholar]
- 42.Esterbauer H, Cheeseman KH. Methods Enzymol. 1990;186:407–431. doi: 10.1016/0076-6879(90)86134-h. [DOI] [PubMed] [Google Scholar]
- 43.Albert PR, Tashjian AH. J Am J Physiol. 1986;251:C887–C891. doi: 10.1152/ajpcell.1986.251.6.C887. [DOI] [PubMed] [Google Scholar]
- 44.Fedirko NV, Kruglikov IA, Kopach OV, Vats JA, Kostyuk PG, Voitenko NV. Biochim Biophys Acta. 2006;1762:294–303. doi: 10.1016/j.bbadis.2005.12.002. [DOI] [PubMed] [Google Scholar]
- 45.Risse D, Elfringhoff AS, Lehr M. J Chromatogr B Analyt Technol Biomed Life Sci. 2002;769:185–190. doi: 10.1016/s1570-0232(02)00013-2. [DOI] [PubMed] [Google Scholar]
- 46.Cribb AE, Peyrou M, Muruganandan S. Drug Metab Rev. 2005;37:405–442. doi: 10.1080/03602530500205135. [DOI] [PubMed] [Google Scholar]
- 47.Liu H, Miller E, van de Water B, Stevens JL. J Biol Chem. 1998;273:12858–12862. doi: 10.1074/jbc.273.21.12858. [DOI] [PubMed] [Google Scholar]
- 48.Bedard K, MacDonald N, Collins J, Cribb A. Basic Clin Pharmacol Toxicol. 2004;94:124–131. doi: 10.1111/j.1742-7843.2004.pto940305.x. [DOI] [PubMed] [Google Scholar]
- 49.Harman AH, Maxwell MJ. Annu Rev Pharmacol Toxicol. 1995;35:129–144. doi: 10.1146/annurev.pa.35.040195.001021. [DOI] [PubMed] [Google Scholar]
- 50.Nanji AA, Zhao S, Lamb RG, Sadrzadeh SMH, Dannenberg AJ, Waxman DJ. Alcohol Clin Exp Res. 1993;17:598–603. doi: 10.1111/j.1530-0277.1993.tb00806.x. [DOI] [PubMed] [Google Scholar]
- 51.Nanji AA, Zhao S, Lamb RG, Dannenberg AJ, Sadrzadeh SMH, Waxman DJ. Alcohol Clin Exp Res. 1994;18:902– 908. doi: 10.1111/j.1530-0277.1994.tb00058.x. [DOI] [PubMed] [Google Scholar]
- 52.Strubelt O, Younes M, Pentz R. Toxicology. 1987;45:213–223. doi: 10.1016/0300-483x(87)90107-7. [DOI] [PubMed] [Google Scholar]
- 53.Anghileri LJ, Esposito M, Fulcheri E, Zicca A, Cadoni A, Thouvenot P. In Vivo. 1999;13:13–20. [PubMed] [Google Scholar]