Abstract
A method for measuring DNA synthesis and, thus, cell proliferation, in vivo is presented. The technique consists of administering [6,6-2H2]Glc or [U-13C]Glc, isolating genomic DNA, hydrolyzing enzymatically to free deoxyribonucleosides, and derivatizing for GC-MS analysis of dA or dG isotopic enrichments, or both. Comparison of dA or dG to extracellular Glc enrichment (with a correction for intracellular dilution) reveals the fraction of newly synthesized DNA, by application of the precursor-product relationship. Thus, the technique differs from the widely used [3H]thymidine or BrdUrd techniques in that the de novo nucleotide synthesis pathway, rather than the nucleoside salvage pathway, is used to label DNA; the deoxyribose rather than the base moiety is labeled; purine rather than pyrimidine deoxyribonucleosides are analyzed; and stable isotopes rather than radioisotopes are used. The method is applied here in vitro to the growth of HepG2 and H9 cells in culture; in animals to proliferation of intestinal epithelium, thymus, and liver; and in humans to granulocyte turnover in blood. In all instances, measured cell proliferation kinetics were consistent with expected or independently measured kinetics. The method has several advantages over previously available techniques for measuring cell turnover, involves no radioactivity or potentially toxic metabolites, and is suitable for use in humans. The availability of a reliable and safe method for measuring cell proliferation in humans opens up a number of fundamental questions to direct experimental testing, including basic problems related to cancer, AIDS, and other pathologic states.
Keywords: Cell turnover, MS, DNA replication, AIDS, biosynthesis
Control of cell proliferation is important in all multicellular organisms. A number of pathologic processes, including cancer and AIDS (1–3), are characterized by failure of the normal regulation of cell turnover. Measurement of the in vivo turnover of cells would therefore have wide application, if a method were available. Presently, direct and indirect techniques for measuring cell proliferation or destruction exist, but both types are flawed.
Direct measurement generally involves the incorporation of a labeled nucleoside into genomic DNA. Examples include the tritiated thymidine ([3H]dT) and BrdUrd methods (4, 5). These techniques are of limited applicability in humans, however, because of radiation-induced DNA damage with the former (6) and toxicities of nucleoside analogues (7) with the latter.
Indirect methods also have been used in specific cases. Recent interest in CD4+ T lymphocyte turnover in AIDS, for example, has been stimulated by using indirect estimates of T cell proliferation based on the rate of accumulation in the circulation after initiation of effective antiretroviral therapy (1, 2). Unfortunately, such indirect techniques, which rely on changes in pool size, are not definitive. The increase in the blood-T cell pool size may reflect redistribution from other pools to blood rather than true proliferation (8, 9). In the absence of direct measurements of cell proliferation, it is not possible to distinguish between these and other (10) alternatives.
Accordingly, there is a need for a generally applicable method for measuring cell proliferation that is without hazard and can be applied in human subjects. The biochemical correlate of new cell production is DNA synthesis. DNA synthesis also is relatively specific for cell division because “unscheduled” DNA synthesis is quantitatively minor (11). Measurement of new DNA synthesis is therefore essentially synonymous with measurement of cell proliferation.
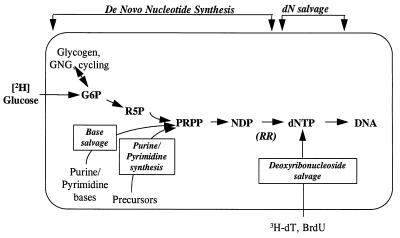
We describe here a method for measuring DNA replication and, hence, cell proliferation, that is applicable in humans. The method differs from current labeling techniques in three major respects. First, previous isotopic methods have labeled DNA through the nucleoside salvage pathway (Fig. 1). The method we present instead labels deoxyribonucleotides in DNA through the de novo nucleotide synthesis pathway (Fig. 1). Labeling via this pathway is advantageous because in most cells that enter the S phase of the cell cycle, the key enzymes controlling de novo synthesis of dNTPs, in particular ribonucleotide reductase (RR), are up-regulated, whereas the enzymes of the nucleoside salvage pathway are suppressed (12–14). Second, we measure labeling in purine deoxyribonucleosides instead of pyrimidines (e.g., from [3H]dT or BrdUrd). This is advantageous because the de novo synthesis pathway tends to be more active for purine than for pyrimidine dNTPs (12–14). In fact, regulatory deoxyribonucleotides have been shown in lymphocytes (12, 13) to exert negative feedback on RR for pyrimidine dNTP synthesis but positive feedback for purine dNTP synthesis, ensuring that the de novo synthesis pathway is always active for the purines. Finally, this method uses stable isotopes instead of radioisotopes and thus is safe for human use. Our objective here was to assess the feasibility of this method for measuring cell proliferation rates in vitro and in vivo.
Figure 1.
Biochemistry of DNA synthesis and routes of label entry. Not all intermediates are shown. G6P, Glc 6-phosphate; R5P, ribose 5-phosphate; PRPP, phosphoribosepyrophosphate; and [3H]dT, tritiated thymidine.
METHODS
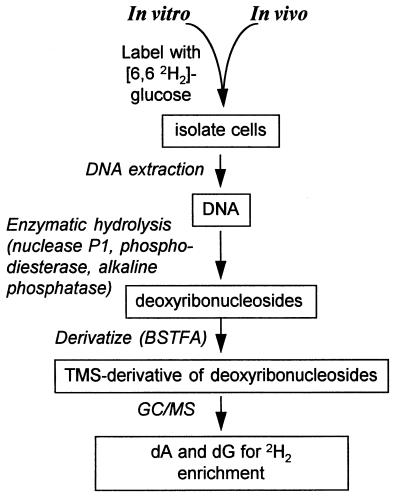
An outline of the technique is shown (Fig. 2).
Figure 2.
Overview of method for measurement of DNA synthesis by incorporation of [6,6-2H2]Glc.
Isolation of Deoxyribonucleosides from DNA.
DNA was prepared from cells or tissues by phenol–chloroform–isoamyl alcohol extraction of cell suspensions or tissue homogenates. Yield and purity were confirmed by OD. After heat denaturation, DNA was hydrolyzed enzymatically to deoxyribonucleosides by sequential digestion with nuclease P1, phosphodiesterase, and alkaline phosphatase, as described by Crain (15). Nucleoside yield and purity were confirmed by HPLC (16).
Derivatization of Deoxyribonucleosides and Analysis by GC-MS.
Trimethylsilyl (TMS) derivatives of nucleosides were synthesized by incubation of lyophilized hydrolysates with bis(trimethylsilyl)trifluoroacetamide:pyridine (4:1) at 100°C for 1 hr. Samples were analyzed by GC-MS (DB-17 HT column, J & W Scientific, Folsom, CA; HP 5890 GC and 5971 MS, Hewlett–Packard). Abundances of ions at m/z 467 and 469 were quantified under selected ion recording mode for dA, and m/z 555 and 557 were monitored for dG. Under the derivatization and GC-MS conditions used, the purines (dA and dG) showed larger peaks (Fig. 3) than the pyrimidines. To measure the enrichment of Glc, plasma or culture media were deproteinized and passed through ion exchange columns (17). The Glc-penta acetate derivative was formed by incubation with acetic anhydride in pyridine. GC-MS analysis was as described previously (17), monitoring m/z 331 and 333.
Figure 3.
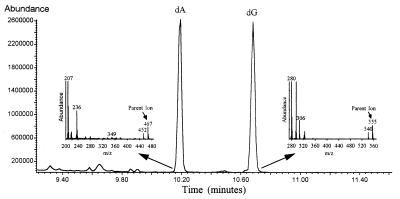
GC-MS of DNA digest (total ion current). Mass spectra of dA and dG peaks are shown as insets.
In Vitro Studies.
Initial studies of label incorporation from [6,6-2H2]Glc into cellular DNA were performed in tissue culture. Two cell lines were used: a hepatocyte cell line, HepG2, and a lymphocytic cell line, H9, which is a CD4+ T cell line. HepG2 cells were grown in 10-ml dishes with α-modified DMEM. H9 cells were grown in suspension in RPMI medium 1640. Both were grown in the presence of 10% dialyzed fetal calf serum and antibiotics (all reagents were from GIBCO/BRL, except where stated otherwise). In both cases, the number of cells present was measured by counting an aliquot on a ZM0901 Coulter counter. For HepG2 cells, plating efficiency was corrected for by counting an identical plate at the beginning of each labeling phase. Cells were labeled by the addition of [6,6-2H2]Glc (Cambridge Isotope Laboratories, Cambridge, MA) so that the labeled Glc constituted 10–20% by weight of total Glc present (100 mg/liter for DMEM and 200 mg/liter for RPMI medium 1640). In some experiments, Glc-free medium was used, and only 100% labeled Glc was present in the medium. Additional experiments were carried out in the presence of [U-13C6]Glc and [2-13C1]glycerol (Cambridge Isotope Laboratories, Cambridge, MA).
Animal Studies.
Four rats (≈250 g) were infused with labeled Glc. Cannulae were placed intravenously in the rats under anesthesia (18). After a 24- to 48-hr recovery period, [6,6-2H2]Glc was infused as a sterile 46 mg/ml solution at 0.5 ml/hr for ≈24 hr. Food was withdrawn at the beginning of the isotope infusion. This dose was expected to achieve average plasma Glc enrichments of ≈10%, based on previous studies in fasting rats (17). At the end of the infusion period, animals were killed. Blood for plasma Glc enrichment and tissues for DNA extraction were collected and frozen. A section of the intestine ≈30-cm long was excised from just below the duodenum in each rat. The intestinal segments were everted and washed. Epithelial cells were released from the submucosa by incubation with shaking in buffer that contained 5 mM EDTA at 37°C for 10 min, as described by Traber and coworkers (19). DNA was extracted from cell preparations and then hydrolyzed to nucleosides and analyzed by GC-MS (Fig. 2).
Studies of Granulocyte Kinetics in Human Subjects.
To investigate the application of this technique in human subjects, four volunteers received intravenous infusions of [6,6-2H2]Glc (60 g for 48 h) in the General Clinical Research Center at San Francisco General Hospital. One subject was a healthy, normal volunteer, and the other three subjects were HIV-seropositive men with blood-CD4 cell counts in the range of 215–377/mm3, who were participating in lymphocyte kinetic studies (in preparation). None had a clinically apparent infection at the time of the infusion. To maintain constant plasma Glc enrichments and maximize the labeling of cellular DNA, dietary carbohydrates were restricted (mean intake 46 g/day) during the 2-day infusion. Blood was drawn every 12 hr during the infusion, for Glc enrichment. After the 48-hr infusion, blood was collected daily for 10 days, and granulocytes and mononuclear cells were separated by gradient centrifugation by using a Vacutainer CPT (Becton Dickinson). Granulocyte DNA was extracted, hydrolyzed to nucleosides, and analyzed by GC-MS (Fig. 2). All procedures received prior approval by the University of California at San Francisco Committee on Human Research and the University of California at Berkeley Committee for the Protection of Human Subjects.
Calculations.
Different cell systems require different kinetic models and experimental approaches. Some cells live for a relatively fixed period of time and then are replaced (life-span kinetics). Red blood cells and intestinal epithelial cells are examples (20). The proper equations here are based on a linear replacement model during constant administration of labeled precursor: f = SB/SA, where f is the fraction of new cells, SB is enrichment of end-product (dA in DNA), and SA is enrichment of precursor (plasma Glc × correction factor for intracellular dilution). Absolute replacement rate is [(f/t) × pool size], where t = time of label administration (21). For cells that are replaced randomly in vivo (e.g., thymocytes, ref. 22) or that are in log-phase growth in vitro, exponential kinetics apply (21): f = SB/SA = 1 − e−kt, where k is the rate constant (t−1) for fractional replacement or growth. Absolute replacement rate is (k × pool size). Finally, certain cells exhibit a lag period before appearing after DNA is synthesized during which time a developmental sequence occurs in a nonaccessible body compartment. Maturation of granulocytes in bone marrow is an example (23). Here, isotope incorporation (either linear or exponential) is observed after a time lag, f represents new cells made during the period of isotope administration, and the constant infusion of labeled precursor need not continue through the period of tissue collection.
RESULTS
Development of Analytic Method.
Derivatization was required to volatilize deoxyribonucleosides for GC-MS analysis (24). We observed the highest abundances with TMS derivatization, compared with methylation or acetylation. The GC-MS scans of a typical TMS-derivitized sample, analyzed under electron impact ionization, are shown (Fig. 3). dA and dG eluted from the GC column as well defined peaks. The dominant ions in the spectra are fragments from the base moiety (25) and, thus, were uninformative regarding [2H]Glc incorporation. The parent ions for dA-TMS3 and dG-TMS4 are m/z 467 and 557, respectively (Fig. 3). They were well represented and were present in a region of the mass spectrum with little background. Labeled samples contained an excess of the M+2 ions 469 and 557; the ratios of 469:467 and 557:559 were used for quantification of isotope enrichments.
Injection volumes were adjusted to keep samples and standards at similar M0 abundances and to avoid concentration effects on isotope ratios (17, 26). The standard deviation for M+2 fractional abundance in dA is <0.0005 for unenriched samples and <0.0004 for enriched samples. The enrichments of dA were not significantly different from dG, as expected. Only data from dA are shown here.
In Vitro Cell Proliferation Studies.
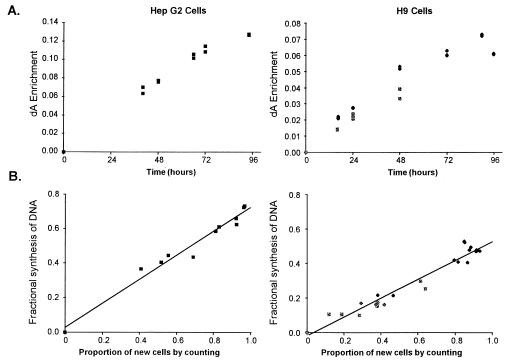
Measurement of cell proliferation. The enrichment of dA from cells grown in media containing 10–15% [6,6-2H2]Glc increased progressively over time (Fig. 4A). This increase was demonstrated for both a hepatocyte cell line (HepG2), grown as monolayers on plates, and for a T-lymphocytic cell line (H9), grown in suspension. When compared with the increase in cells by direct counting, dA enrichment correlated closely (Fig. 4B). The correlation coefficient between the fraction of new DNA (calculated from the ratio of M2 enrichments in dA to medium Glc) and the percentage of new cells by direct counting was 0.984 for HepG2 cells and 0.972 for H9 cells.
Figure 4.
Labeling of tissue culture cells during log-phase growth in vitro. (A) Enrichment of dA from cellular DNA in hepatocyte (HepG2) and lymphocyte (H9) cell lines grown in media enriched with [6,6-2H2]Glc. Lymphocyte data includes results from experiments at two different Glc enrichments. (B) Comparison of factional synthesis of DNA, calculated from M2 enrichments of dA/medium Glc, with increase in cell numbers by counting.
Estimation of intracellular dATP precursor pool enrichment for DNA synthesis.
The enrichment of the true intracellular-dATP precursor pool for DNA synthesis in growing cells is equal to the dA enrichment in DNA at 100% new cells (i.e., when only labeled DNA is present). Extrapolation of our labeling time course experiments (Fig. 4) to 100% new cells gave estimated plateau dA enrichments of 0.725 of the medium Glc enrichment for HepG2 cells and 0.525 for H9 cells.
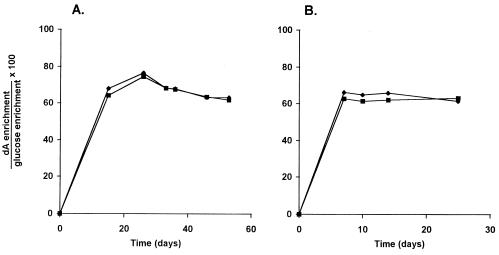
To test more directly the relationship between enrichments of extracellular Glc and intracellular DNA precursors, cells were grown for prolonged periods in medium containing 100% [6,6-2H2]Glc with repeated plating of cells (53 days for HepG2 cells and 25 days for H9 cells). At the end of the experiment, <0.1% of the DNA present could be derived from initial unlabeled cells. Maximum enrichment of dA was ≈65% for both HepG2 and H9 cells (Fig. 5). One possible explanation for this dilution of extracellular-labeled Glc could be the synthesis of Glc within the cell, e.g., from gluconeogenesis (GNG), because unlabeled amino acid precursors for GNG are present in the culture medium. Alternatively, some exchange of the label could have occurred during intracellular metabolism of Glc, either during glycolysis and passage through the tricarboxylic acid cycle or during the nonoxidative portion of the pentose-phosphate pathway (27).
Figure 5.
Enrichment of dA from DNA of (A) hepatocyte (HepG2) and (B) lymphocyte (H9) cell lines grown in media containing 100% [6,6-2H2]Glc for prolonged periods with repeated subcultures.
If intracellular unlabeled Glc from GNG were the dominant origin of dilution, dA from H9 cells might have approached closer than the HepG2 cells to 100% of medium Glc enrichment. This prediction was not found to be the case (Figs. 4 and 5). A more direct test is the incorporation of GNG precursors into DNA by HepG2 cells. To test this hypothesis, both HepG2 and H9 were cultured in the presence of [2-13C1]glycerol. By applying the theory of combinatorial probabilities or the mass isotopomer distribution analysis technique (17, 21), the fraction of deoxyribose in dA that came from GNG could then be calculated. When HepG2 cells were grown in media to which [2-13C1]glycerol had been added at concentration of 20 μg/ml, no measurable incorporation of 13C into dA was found. In the presence of 100 μg/ml [2-13C1]glycerol (≈2–3 × plasma glycerol concentrations), enrichment of both M+1 and M+2 ions was observed in dA. Applying mass isotopomer distribution analysis (17, 21) revealed that 17.8% of dA pentose ring synthesis arose from GNG. H9 cells grown in the presence of 100 μg/ml [2-13C1]glycerol revealed no measurable GNG, as expected.
Duplicate pairs of cell cultures also were grown in the presence of 10% [6,6-2H2]Glc with and without the addition of unlabeled glycerol (100 μg/ml). Such unlabeled glycerol did not affect labeling in H9 cells; in HepG2 cells, incorporation into dA was reduced by 7%. Thus, it appears that the availability of GNG precursors has only a small effect on the labeling of DNA in cells capable of GNG. GNG does not fully explain the intracellular dilution of dA.
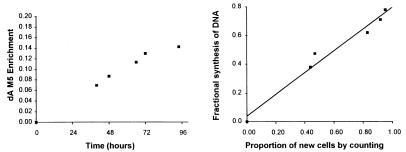
If the ≈35% dilution between extracellular Glc and dA in DNA is due to the exchange of 2H for 1H in intracellular Glc cycles, carbon label in [U-13C6]Glc should undergo rearrangement. Accordingly, HepG2 and H9 cells were grown in the presence of 10% [U-13C6]Glc. If there is no metabolism through pathways such as the nonoxidative portion of the pentose-phosphate pathway, the dNTPs from this precursor should retain all five labeled carbons and have a mass of M5. The M5 enrichment did increase in a fashion (Fig. 6) similar to that observed with the M2 ion from [6,6-2H2]Glc (Fig. 6). An asymptote of ≈80% of the extracellular enrichment was reached in HepG2 cells whereas in H9 cells the asymptote was ≈60% of extracellular Glc enrichment. When the M0 to M5 spectrum was analyzed, enrichments of M2, M3, and M4 ions were seen in addition to the expected enrichment of M5 (not shown). This phenomenon was observed in both H9 and HepG2 cells, although the relative abundance of these ions was greater from H9 cells.
Figure 6.
Enrichment of M5 ion of dA from DNA of hepatocyte cell line (HepG2) cells grown in ≈20% [U-13C6]Glc. Right panel: Comparison of fractional synthesis of DNA from M5 labeling to proportion of new cells by direct counting.
Effect of extracellular deoxyribonucleosides on incorporation of labeled Glc.
The above cell culture experiments were performed in the absence of deoxyribonucleosides in the medium. Previous studies with lymphocyte cell lines (12, 13) have suggested that increasing the availability of extracellular deoxyribonucleosides does not reduce, and may even increase, activity of RR and the endogenous synthesis pathway for purine dNTPs (Fig. 1). To test directly the effects of increased availability of extracellular deoxyribonucleosides, HepG2 and H9 cells were grown in the presence of an equimolar mixture of the four deoxyribonucleosides. Two concentrations, 20 μM and 100 μM, were chosen to reproduce or exceed those prevailing in tissues; plasma concentrations are normally of the order of 1 μM, and tissue concentrations may range between 1 and 100 μM (14). Six flasks of H9 cells were grown in parallel in media labeled with ≈10% [6,6-2H2]Glc (Table 1). Two flasks were grown without added deoxyribonucleosides, two were grown at the lower, and two at the higher deoxyribonucleoside concentrations. After 90 hr, 85% of cells were new as determined by counting them. The experiment also was performed with HepG2 cells, yielding an average increase in cell number representing ≈58% new cells. In H9 cells the presence of extracellular deoxyribonucleosides at either 20 μM or 100 μM did not reduce the incorporation of label from Glc into dA and thus did not appear to suppress the activity of the de novo nucleotide synthesis pathway. In HepG2 cells there was no appreciable reduction in incorporation at 20 μM, although there was a small (≈12%) reduction at 100 μM. In H9 cells, the extrapolated ratio of dA/Glc at 100% new cells (based on cell counting) was reproducibly between 62 and 64%. For HepG2 cells, the ratio ranged between 54 and 71%.
Table 1.
Effect of extracellular deoxyribonucleosides on incorporation of [6,6-2H2]Glc into dA in DNA in cultured cells
| Extracellular deoxyribonucleoside concentration, μM
|
||||||
|---|---|---|---|---|---|---|
| 0 | 0 | 20 | 20 | 100 | 100 | |
| Lymphocytes (H9) | ||||||
| dA/Glc ratio | 0.527 | 0.522 | 0.535 | 0.528 | 0.534 | 0.514 |
| Fraction new cells (by counting) | 0.849 | 0.851 | 0.867 | 0.856 | 0.839 | 0.822 |
| Extrapolated dA/Glc (100% new cells) | 0.620 | 0.613 | 0.617 | 0.617 | 0.637 | 0.626 |
| Hepatocytes (HepG2) | ||||||
| dA/Glc ratio | 0.386 | 0.385 | 0.381 | 0.370 | 0.339 | 0.344 |
| Fraction new cells (by counting) | 0.568 | 0.589 | 0.536 | 0.565 | 0.626 | 0.570 |
| Extrapolated dA/Glc (100% new cells) | 0.680 | 0.653 | 0.711 | 0.655 | 0.541 | 0.603 |
In vivo labeling of DNA in animal studies.
In rats (n = 4) receiving intravenous infusion of [6,6-2H2]Glc, plasma Glc enrichment at death was 13.2 ± 0.9%. The mean plasma Glc enrichment for the whole 24-hr infusion period is less than this value because plasma Glc enrichment progressively increases during fasting, as the Glc appearance rate progressively falls (7). The mean plasma Glc enrichment was estimated from two rats that received labeled Glc infusion, in which repeated blood samples were taken via an arterial blood-drawing line. The mean enrichment for the 24-hr fasting period was 0.70 of the final enrichment; accordingly, this value was used for calculating the mean Glc enrichments for the four experimental rats (9.2 ± 0.6%).
Different enrichments were found in dA from the three tissues studied (Table 2). For intestinal epithelial cells a lifespan (linear) kinetic model was used (see above), based on the model that new cells divide, live for a fixed period of time, and then die in the order in which they were formed, during the progression from crypt to villus tip (20). A turnover time of 2.8 ± 0.4 days was calculated (uncorrected, by using plasma Glc enrichments to represent intracellular dATP) or 1.8 ± 0.2 d (corrected, by using plasma Glc with a 35% intracellular dilution factor). For thymus and liver a random replacement (exponential) model was applied (ref. 22; also, see above). Thymus had a 10 times more rapid turnover than liver (Table 2).
Table 2.
In vivo incorporation of [6,6-2H2]Glc into dA in DNA in various rat tissues
| Tissue | dA enrichment, % | New cells, %
|
Turnover time, d
|
Rate constant, k (d−1)
|
t½, d
|
||||
|---|---|---|---|---|---|---|---|---|---|
| Uncorrected | Corrected | Uncorrected | Corrected | Uncorrected | Corrected | Uncorrected | Corrected | ||
| Intestinal epithelium | 3.18 ± 0.24 | 34.6 ± 4.2 | 53.2 ± 6.5 | 2.83 ± 0.37 | 1.84 ± 0.24 | — | — | — | — |
| Thymus | 2.33 ± 0.08 | 25.3 ± 2.2 | 38.9 ± 3.1 | — | — | 0.302 ± 0.030 | 0.51 ± 0.058 | 2.31 ± 0.23 | 1.36 ± 0.15 |
| Liver | 0.25 ± 0.06 | 2.7 ± 0.5 | 4.2 ± 0.9 | — | — | 0.028 ± 0.005 | 0.044 ± 0.008 | 25.4 ± 4.9 | 16.2 ± 3.1 |
Mean plasma Glc enrichment was 9.2 ± 0.6%, and mean duration of infusion was 23.2 ± 0.1 hr. Uncorrected calculations use plasma Glc enrichments as the precursor for DNA synthesis; corrected calculations use a correction factor of 0.65 × plasma Glc enrichment to account for dilution in the intracellular precursor pool (see text). A linear kinetic model was used for intestinal epithelium (20); an exponential model was used for thymus and liver (22). d, day.
Studies of granulocyte kinetics in human subjects.
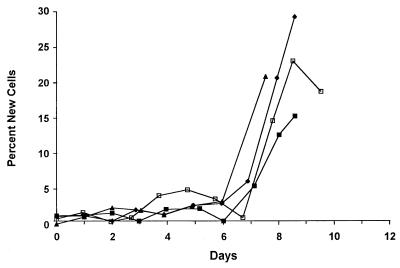
As part of a study of T lymphocyte kinetics in AIDS, three HIV-seropositive men and one HIV-seronegative man received an infusion of [6,6-2H2]Glc (1.25 g/hr for 48 hr). All were clinically stable at the time of investigation. Absolute granulocyte counts were 1.5, 0.9, and 2.4 × 10⁹/liter, respectively, in the HIV-positive subjects and 2.4 × 10⁹/liter in the control subject. The infusions were well tolerated. Mean plasma Glc enrichments of 15.3 ± 2.4 molar percent excess were achieved (rate of appearance of Glc ≈2 mg/kg/min). Granulocytes were isolated, and dA enrichment was measured from DNA. For the first 6 days after the infusion, very low proportions of labeled cells were seen in the circulation (Fig. 7), consistent with the ≈7-day maturation sequence required for development of granulocytes in the bone marrow (23), followed by the appearance of labeled cells starting on days 6–8. Enrichments at day 8 indicated ≈25% new cells present (corrected values). Blood sampling was not continued beyond day 8; therefore, it was not possible to evaluate the kinetics of decline in cell labeling.
Figure 7.
Fractional synthesis of granulocytes in peripheral blood from four subjects after 2-day infusion of [6,6-2H2]Glc, commencing at time zero. Open symbols, control subject; closed symbols, HIV infected subjects. Fraction of new cells was calculated by comparison of dA enrichment to average plasma Glc enrichment, after correcting for estimated 35% intracellular dilution.
DISCUSSION
Stable isotope-mass spectrometric techniques have been widely used for studying intermediary metabolic processes but have not generally been applied to questions in cellular or molecular biology. Investigation of the control of cell proliferation represents an area of fundamental importance that is amenable to such techniques. Control of cell proliferation can be framed as a metabolic question: what is the rate of DNA synthesis in a population of cells?
We describe here the development and application of a new stable isotope-mass spectrometric technique for the measurement of DNA synthesis and thus cell proliferation. Others have used nonradioactive tracers for labeling nucleic acids. Twenty years ago, Heck et al. (28) measured incorporation of stable isotope-labeled thymidine into DNA as a semiquantitative index of DNA synthesis, and many investigators (e.g., 29) have used NMR analyses of nucleic acids after incorporation of 13C- or 15N-labeled precursors, to obtain structural information.
We have tested the method in several ways. When compared with the least ambiguous measure of cell proliferation (cell counting) in an in vitro system in log phase growth, the proportional increase in new cells by the stable isotope method showed excellent quantitative agreement (Figs. 4 and 6; Table 1) with the increased number of cells counted. Correlation coefficients >0.95 were observed for both cell types studied. If the plateau ratio of dA enrichment to extracellular Glc enrichment (≈65%) is used to reflect the dilution of label between Glc and the dR in the dATP precursor pool for DNA synthesis (Fig. 1), the absolute cell proliferation rate calculated by the isotope method is almost identical to the number of new cells counted.
In addition, we have validated this technique in vivo by comparing measured cell proliferation rates to values estimated by independent techniques. In rats, thymus and intestinal epithelium were rapid turnover tissues, as expected, whereas turnover of liver cells was much slower. For intestinal cells a turnover time of 1.8 days was measured (Table 2), assuming an intracellular dilution of 0.65. This time is consistent with previous studies using tritiated thymidine and mitotic counting that have found values of between 1.6 (30) and 2.0 days (31) in small intestine of rat. Thymocyte turnover rates were also within the expected range.
In humans we have applied this technique to granulocyte kinetics. The observed pattern of a lag phase followed by rapid appearance of a cohort of labeled cells (Fig. 7) is consistent with previous observations using tritiated thymidine (23). Because samples were not taken beyond day 10, it was not possible to comment on the disappearance rate of labeled granulocytes from the blood or to fully model the kinetics of the granulocyte pool. However, such modeling should be possible by combining isotope infusions with studies of granulocyte survival in the peripheral blood.
The approach described here for measuring cell proliferation has several advantages over previously available methods. [3H]dT is a potent antimetabolite that has been used to kill dividing cells (6); the toxicity of introducing radioisotopes into DNA is avoided here by using stable isotopes. The toxicities of nucleoside analogues per se (e.g., BrdUrd) are avoided by labeling with a physiologic substrate. Isotopic contamination by non-S phase DNA synthesis also is minimized by labeling through the ribonucleotide reduction pathway (12–14). The variability of labeled pyrimidine nucleoside salvage uptake is resolved by labeling purine dNTPs via the de novo nucleotide synthesis pathway; this approach thereby turns what was previously a disadvantage (low purine dNTP labeling from the nucleoside salvage pathway) into an advantage (high and constant labeling from the de novo pathway). This conclusion is demonstrated by the constancy of [6,6-2H2]Glc incorporation into DNA even in the presence of supraphysiologic extracellular concentrations of deoxyribonucleosides (Table 1). Possible input from free purine or pyrimidine base salvage does not dilute the ribose moiety of NTPs, because the salvage pathway for free bases, like de novo synthesis of bases, involves combination with phosphoribose pyrophosphate, which is synthesized from Glc (Fig. 1). Finally, re-utilization of label from catabolized DNA is avoided by analyzing purines, because the deoxyribonucleoside salvage pathway is low. Therefore, die-away curves of labeled dA or dG in DNA will be relatively uncontaminated by isotope reutilization, and cell turnover should be measurable from decay curves (21).
The method might be further advanced by analytic modifications. Use of derivatives or instruments that improve sensitivity and precision for measurement of isotope enrichments as well as derivatives or instruments that reduce chemical yields required for detection (32), would reduce isotope costs and tissue requirements, respectively, when compared with GC-MS of TMS derivatives. These are especially important considerations for human studies.
An important technical question is the optimal value to use for the intracellular precursor pool (dATP) enrichment. The maximum dA enrichment in cells grown for long periods in labeled Glc was less than the enrichment of medium Glc; final dA enrichments reached 60–70% of the extracellular Glc value in both HepG2 and H9 cells. Our in vitro experiments suggest that this dilution is largely due to glycolytic and/or nonoxidative pentose-phosphate pathway metabolism of labeled Glc, although GNG also may reduce the precursor enrichment in hepatocytes.
Thus, for calculations of cell turnover, if the enrichment of the dNTP pool is taken to be equal to that of extracellular Glc, a minimum value for cell turnover rate is obtained (shown as uncorrected data in Table 2). If, however, it is assumed that the dilution between extracellular Glc and dNTPs is similar in vivo to that observed in cells studied in vitro, a correction can be applied. The value of such a correction factor is likely to depend both on the tissue type and the physiological state. Despite this, our results with labeling of cells in culture and in rats suggest that a correction factor for intracellular dilution of 0.65 Glc can be applied with some confidence (Fig. 5; Table 1), particularly for lymphocytes.
Presently, there is no definitive method to measure intracellular dilution of dATP relative to extracellular Glc, in vivo. Ultimately, the best way to establish the true intranuclear dNTP precursor pool enrichment may be by a technique such as mass isotopomer distribution analysis (21). Analysis of combinatorial probabilities in oligonucleotides (containing two or more dA or dG subunits) would require different methods and mass spectrometric instrumentation. We have measured enrichments in oligopeptides, to measure protein synthesis by mass isotopomer distribution analysis, by use of electrospray ionization-MS (33). Until the combinatorial approach is developed, the use of measured extracellular Glc enrichments, optimally with a correction factor (e.g., 0.60 to 0.70) for intracellular dilution, should be adequate for reproducible and accurate estimates of cell proliferation rates.
In summary, we describe a method for measuring proliferation and turnover rates of cells in vivo. The technique involves no radioactivity or potentially toxic metabolites and is suitable for use in humans as well as model systems. A number of biological and clinical questions of fundamental interest may prove amenable to study by use of this technique.
Acknowledgments
We acknowledge the support of grants from the National Institutes of Health (DK-40995 and AI-41401), the AIDS Clinical Research Center (University of California San Francisco), and SpectruMedix (to M.K.H.). National Institutes of Health Grant RR-00083 from the Division of Research Resources supported the General Clinical Research Center. Dr. Macallan received funds from a Medical Research Council (UK) Travelling Fellowship.
ABBREVIATIONS
- RR
ribonucleoside reductase
- TMS
trimethylsilyl
- GNG
gluconeogenesis
References
- 1.Ho D D, Neumann A U, Perelson A S, Chen W, Leonard J M, Markowitz M. Nature (London) 1995;373:123–126. doi: 10.1038/373123a0. [DOI] [PubMed] [Google Scholar]
- 2.Wei X, Ghosh S K, Taylor M E, Johnson V A, Emin E T, et al. Nature (London) 1995;373:117–120. doi: 10.1038/373117a0. [DOI] [PubMed] [Google Scholar]
- 3.Adami H O, Persson I, Ekbom A, Wolf A, Ponten J, Trichapolous D. Mutat Res. 1995;333:29–35. doi: 10.1016/0027-5107(95)00128-x. [DOI] [PubMed] [Google Scholar]
- 4.Waldman F M, Chew K, Ljung B M, Goodson W, Hom J, Duarte L A, Smith H S, Mayall B. Mod Pathol. 1991;4:718–722. [PubMed] [Google Scholar]
- 5.Gratzner H G. Science. 1982;218:474–475. doi: 10.1126/science.7123245. [DOI] [PubMed] [Google Scholar]
- 6.Asher E, Payne C M, Bernstein C. Leuk Lymphoma Res. 1995;19:107–119. doi: 10.3109/10428199509059664. [DOI] [PubMed] [Google Scholar]
- 7.Rocha B, Penit G, Baron C, Vasseur F, Dautigney N, Freitas A A. Eur J Immunol. 1990;20:1697–1708. doi: 10.1002/eji.1830200812. [DOI] [PubMed] [Google Scholar]
- 8.Sprent J, Tough D. Nature (London) 1995;375:194. doi: 10.1038/375194a0. (lett.). [DOI] [PubMed] [Google Scholar]
- 9.Mosier D E. Nature (London) 1995;375:193–194. doi: 10.1038/375193b0. (lett.). [DOI] [PubMed] [Google Scholar]
- 10.Wolters K C, Bea G, Wisman A, Otto S A, de Roda Husman A M, Schaft N, de Wolf F, Goudsmit J, Coutinho R A, van der Zee A G, Meyaard L, Miedema F. Science. 1996;274:1543–1547. doi: 10.1126/science.274.5292.1543. [DOI] [PubMed] [Google Scholar]
- 11.Sawada S, Asakura S, Daimon H, Furihata C. Mutat Res. 1995;344:109–116. doi: 10.1016/0165-1218(95)00039-9. [DOI] [PubMed] [Google Scholar]
- 12.Reichard P. Fed Proc. 1978;37:9–14. [PubMed] [Google Scholar]
- 13.Reichard P. Annu Rev Biochem. 1988;57:349–374. doi: 10.1146/annurev.bi.57.070188.002025. [DOI] [PubMed] [Google Scholar]
- 14.Cohen A, Barankiewicz J, Lederman H M, Gelfand E W. J Biol Chem. 1983;258:12334–12340. [PubMed] [Google Scholar]
- 15.Crain P F. Methods Enzymol. 1990;193:782–790. doi: 10.1016/0076-6879(90)93450-y. [DOI] [PubMed] [Google Scholar]
- 16.Shigenaga M K, Aboujaude E N, Chen Q, Ames B N. Methods Enzym. 1994;234:16–33. doi: 10.1016/0076-6879(94)34073-0. [DOI] [PubMed] [Google Scholar]
- 17.Neese R A, Schwarz J-M, Faix D, Turner S, Letscher A, Vu D, Hellerstein M K. J Biol Chem. 1995;270(24):14452–14463. doi: 10.1074/jbc.270.24.14452. [DOI] [PubMed] [Google Scholar]
- 18.Hellerstein M K, Greenblatt D J, Munro H N. Proc Natl Acad Sci USA. 1986;83:7044–7048. doi: 10.1073/pnas.83.18.7044. [DOI] [PMC free article] [PubMed] [Google Scholar]
- 19.Traber P G, Gumucio D L, Wang W. Am J Physiol. 1991;260:G895–G903. doi: 10.1152/ajpgi.1991.260.6.G895. [DOI] [PubMed] [Google Scholar]
- 20.Lipkin M. In: Physiology of the Gastrointestinal Tract. Johnson L R, editor. New York: Raven; 1987. pp. 255–284. [Google Scholar]
- 21.Hellerstein M K, Neese R. Am J Physiol. 1992;263:E988–E1001. doi: 10.1152/ajpendo.1992.263.5.E988. [DOI] [PubMed] [Google Scholar]
- 22.Sprent J. Curr Opin Immunol. 1993;5:433–438. doi: 10.1016/0952-7915(93)90065-z. [DOI] [PubMed] [Google Scholar]
- 23.Dancey J T, Deubelbeiss K A, Harker L A, Finch C A. J Clin Invest. 1976;58:705–715. doi: 10.1172/JCI108517. [DOI] [PMC free article] [PubMed] [Google Scholar]
- 24.Blau K, Halket J, editors. Handbook of Derivatives for Chromotography. 2nd Ed. New York: Wiley; 1993. [Google Scholar]
- 25.McCloskey J A. Methods Enzymol. 1990;193:825–841. doi: 10.1016/0076-6879(90)93453-r. [DOI] [PubMed] [Google Scholar]
- 26.Patterson B W, Wolfe R R. Biol Mass Spectrom. 1993;22:481–486. doi: 10.1002/bms.1200220810. [DOI] [PubMed] [Google Scholar]
- 27.Wood H G, Katz J, Landau B R. Biochem Z. 1963;338:809–847. [PubMed] [Google Scholar]
- 28.Heck H D, McReynolds J H, Anbar M. Cell Tissue Kinet. 1977;10:111–119. doi: 10.1111/j.1365-2184.1977.tb00136.x. [DOI] [PubMed] [Google Scholar]
- 29.Hall K B. Methods Enzymol. 1995;261:542–559. doi: 10.1016/s0076-6879(95)61024-3. [DOI] [PubMed] [Google Scholar]
- 30.Creamer B. Br Med Bull. 1967;23:226–230. doi: 10.1093/oxfordjournals.bmb.a070561. [DOI] [PubMed] [Google Scholar]
- 31.Holle G F. Gastroenterology. 1991;101:1264–1273. doi: 10.1016/0016-5085(91)90076-w. [DOI] [PubMed] [Google Scholar]
- 32.Tiexeira J A, Gommers-Ampt J H, Van de Werken G, Westra J G, Stavenuiter J F, de Jong A P. Anal Biochem. 1993;214:474–483. doi: 10.1006/abio.1993.1525. [DOI] [PubMed] [Google Scholar]
- 33.Caldwell K A, Papageorgopoulos C, Siler S Q, Shackleton C H L, Hellerstein M K. FASEB J. 1994;8(5):A461. [Google Scholar]


