Abstract
Temperature detection using microwave radiometry has proven value for noninvasively measuring the absolute temperature of tissues inside the body. However, current clinical radiometers operate in the gigahertz range, which limits their depth of penetration. We have designed and built a noninvasive radiometer which operates at radio frequencies (64 MHz) with ∼100-kHz bandwidth, using an external RF loop coil as a thermal detector. The core of the radiometer is an accurate impedance measurement and automatic matching circuit of 0.05 Ω accuracy to compensate for any load variations. The radiometer permits temperature measurements with accuracy of ±0.1°K, over a tested physiological range of 28° C–40° C in saline phantoms whose electric properties match those of tissue. Because 1.5 T magnetic resonance imaging (MRI) scanners also operate at 64 MHz, we demonstrate the feasibility of integrating our radiometer with an MRI scanner to monitor RF power deposition and temperature dosimetry, obtaining coarse, spatially resolved, absolute thermal maps in the physiological range. We conclude that RF radiometry offers promise as a direct, noninvasive method of monitoring tissue heating during MRI studies and thereby providing an independent means of verifying patient-safe operation. Other potential applications include titration of hyper- and hypo-therapies.
Keywords: Automatic matching and tuning, magnetic resonance imaging (MRI), microwave radiometry, temperature measurement, thermography
I. Introduction
MICROWAVE radiometry is the science of measurement of natural electromagnetic (EM) radiation emitted from lossy materials at microwave frequencies and the relationship between such emissions and the absolute temperature of the material as first noted by Nyquist and Johnson in 1928 [1], [2]. Their discovery led to the routine use of radiometry for environmental and astronomical applications including the measurement of ocean and planet surface temperatures [3]. Such systems measure the noise power detected by far-field antennae operating in the gigahertz range, with the sensitivity benefits of high bandwidths.
Over the past 30 years, radiometry has been applied to measure the temperature of biological tissues in human and animal models. Being a passive detection modality that does not require applied radiation, it is both safe and entirely nonhazardous. Because fast-growing tumors can exhibit local temperature elevations over surrounding normal tissues, microwave radiometry shows promise as a possible diagnostic tool for early breast cancer detection [4-[6]. The diagnostic value of such applications could benefit from integration into high-resolution high-contrast imaging modalities such as magnetic resonance imaging (MRI).
Of importance to the diagnostic utility of radiometry is the depth of tissue whose temperature measurements are being sought. The depth of penetration of electromagnetic (EM) radiation in water, the main constituent of tissue, increases as frequency is reduced [5], [7], [8]. Thus, radio frequencies (RF) below 200 MHz are best suited for radiometry of tissues lying 1–20-cm deep in the body. However, nearly all current clinical setups operate in the gigahertz range [7]-[9]. Their hardware is typically based on Dicke's 1946 radiometer [10]. Radiometers are commonly constructed with a receiving antenna connected to a circulator and/or an isolator to reduce load variations as shown in Fig. 1. Several temperature references are used to calibrate the radiometer during measurements to accommodate gain fluctuations and/or mismatches [11].
Fig. 1.
Typical radiometer, where the signal is received by the antenna then passes through the circulator and the isolator to compensate for any load mismatches. The high-frequency signal is then amplified by an LNA, before being mixed and filtered for further amplification for detection and measurement.
Measuring noise power at lower RF frequencies and small bandwidths to provide greater penetration sensitivity is challenging in that signals must be amplified to adequate detection levels without altering their spectral properties or adding significant noise, and that the use of isolators becomes impractical due to their physically extreme sizes at such frequencies. In 2002, the National Institute of Standards (NIST) demonstrated a first RF radiometer for high-temperature measurements (∼1000 K and above). This system operated at 30 and 60 MHz, with a receiver bandwidth of 0.77 MHz [12]. The work underscored the necessity of precisely matching the load impedance of the object being tested, to achieve accurate measurements at these frequencies. The problem of mismatching sample loads was avoided by using temperature references with the same loading properties as that of the tested objects, so that any mismatch affected the calibration and sample similarly.
Here, we report on the design, construction, and testing of a novel 64-MHz radiometer. A major innovation in our system is that no circulators/isolators are used. Instead, the antenna deployed for receiving noise radiation is a MRI coil precisely matched with an accuracy of 0.05Ω to 50 Ω to compensate for load variations, using automatic vector impedance sensing. After matching, the coil is switched to an amplifier where noise is measured and the temperature of a body lying in its region of sensitivity is estimated. As in standard microwave radiometers, our system requires calibration against known temperature loads. We demonstrate the measurement of absolute temperatures on a phantom of comparable EM properties to biological tissue over a physiological temperature range. 1.5 Tesla (T) Magnetic Resonance Imaging (MRI) scanners also operate at 64 MHz and are therefore already equipped with detection coils and low-noise RF amplification suitable for RF radiometry. Because the monitoring of either heating in the body or the RF specific absorption rate from RF power deposition during MRI studies is mandated by regulatory health-care agencies [13], we further investigate the feasibility of integrating our new radiometer into a 1.5T MRI scanner. We developed an experimental setup to calibrate the receiver of a 1.5 Tesla MRI system. We utilize the scanner's own RF receiver chain and detector coil as a radiometric antenna, and we demonstrate after calibration, the ability to measure absolute temperatures and generate coarse thermal maps.
II. Theory
A lossy body at a homogenous temperature T (in Kelvin), radiates energy according to Planck's radiation law. The equation governing this phenomenon in the microwave domain is [1]
| (1) |
where Pn is the available noise power; is the variance of the thermal noise open circuit voltage; R is the equivalent real resistance of the body; kis Boltzman's constant; and B is the bandwidth of the receiving system. Although generally applied to gigahertz radiometry this linear relation between noise power and temperature remains valid at lower frequencies. Typically, a radiometer consists of a receiving antenna, a high-gain amplifier, load variation compensation and a power measuring device (Fig. 1). The noise power level received within a 100-kHz bandwidth is on the order of 10−14 Watts. To detect such small signals, low-noise, high-gain, carefully designed amplifiers and low-noise hardware are essential, along with proper shielding to eliminate interference from other environmental noise sources. The measured power, Pm, from an amplified receiver signal after impedance matching for such a setup can be expressed as
| (2) |
where Γ is the reflection coefficient at the antenna-amplifier interface; G is the available gain; and N is the noise power added by the system. Note that G and N are dependent on Γ ; that Γ varies when the coil-body coupling changes, for example, due to motion; and that the reflection coefficient is a function of the impedance, Za, of the unmatched antenna,
| (3) |
where Z0 is the 50-Ω standard. Za is temperature dependent since the body's conductivity is both spatial and temperature dependent.
In a lumped system with a constant system noise temperature, introduced by the radiometer's electronics, (2) can be written in the form
| (4) |
where α and β are the system-dependent parameters that are determined by calibration prior to temperature measurements, using two or more temperature references. In order to eliminate the dependency of Za on temperature and coupling variations, the antenna is matched to Z0 thus fixing and minimizing Γ.
In our design, the antenna impedance is continuously sensed and matched to compensate for loading variations, as described below. A measurement of then yields T via (1).
What does RF Radiometry measure?
The temperature measured by an RF radiometer [14], [15] is
| (5) |
where T (x, y, z) is the temperature at a specific spatial location (x, y, z) and
| (6) |
is the antenna receiving (power) pattern. The body's conductivity, σ, is both spatial and temperature dependent. E is the electric field distribution for the antenna for unit current excitation. Thus, the RF radiometer detects the average temperature weighted by the antenna field distribution. By the principle of reciprocity, the antenna receiving pattern in the body is identical to the distribution of the power absorbed, the specific absorption rate (SAR), that results from using the radiometer antenna as a transmitter. In the absence of any applied current, (6) is effectively the resistance R of the antenna loaded with a sample that produces noise power, per (1), [16]. The SAR of common loop detector coil geometries (receiver antennae) used in MRI, such as flat circular and “figure 8” coils placed against the body at 64 MHz, have already been calculated for homogenous samples [17]. The salient observation is that radiometric temperature measurements obtained with flat loop coils are most sensitive to tissue/material lying near the coil, and less sensitive as distance from the coil increases. The depth of penetration is approximately half of the coil's longest dimension. For validation studies, we report experiments on homogeneous objects with homogenous steady-state temperature distributions.
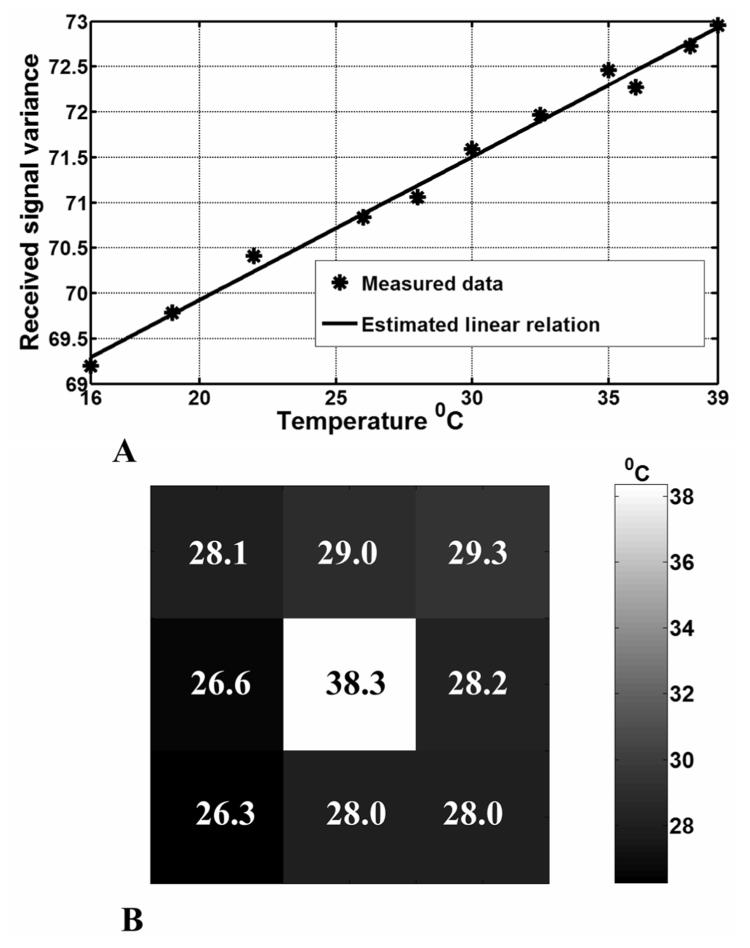
Fig. 8.
A. The calibration result obtained by calculating the received signal variance at different temperatures of the phantom. B. The resultant radiometric thermal map generated by scanning the phantom with a surface coil. The measured independent absolute temperature of the middle chamber was 38 °C. The surrounding compartment was at 28 °C.
III. Methods
A. Impedance Matching
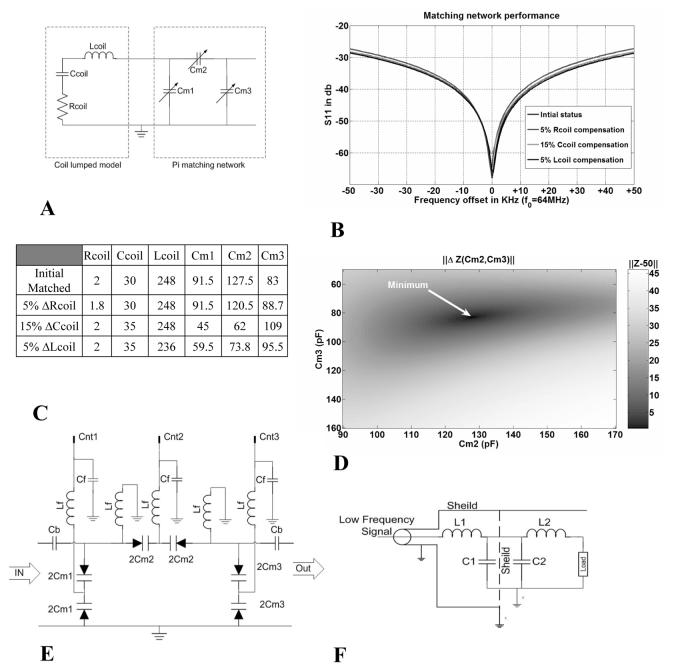
Precise measurement of the sample's loading of the coil impedance is central to the radiometer's operation. The coil is modeled under the expected loading conditions with a lumped equivalent circuit whose parameters are determined by connecting the coil to a vector network analyzer. A pi-network was used to match the coil to 50 Ω as illustrated in Fig. 2: the exact model parameters are tabulated therein. The simulated performance of the matching network under various loading conditions over the 100-kHz bandwidth is shown in Fig. 2(b). Fig. 2(e) illustrates the low pass filter applied to the matching-circuit varactor control lines entering the shielded box. Additional filtering is done on the control lines that enter the matching box [Fig. 2(f)].
Fig. 2.
(a) Electric model for coil and impedance matching. (b) Curves showing matching performance over 100-kHz band. (c) Table showing the circuit parameters for curves shown in (b), where resistance is in ohms, capacitance in picofarads, and inductance in microhenry. (d) Impedance difference map as a function of Cm2 and Cm3 for coil loading conditions in the first row of the table in (c). The function has one minimum point within the operating range. (e) Circuit diagram for the matching network. High-precision varactors are used for matching and their capacitance values are controlled via voltage lines Cnt1, 2, and 3. The voltages controlling the varactors are fed through a low pass filter with 1-pF capacitors, Cb, to block interference. (f) Circuit diagram for an electric line going through the filter box. Inductances of 10μH are used to choke RF interference.
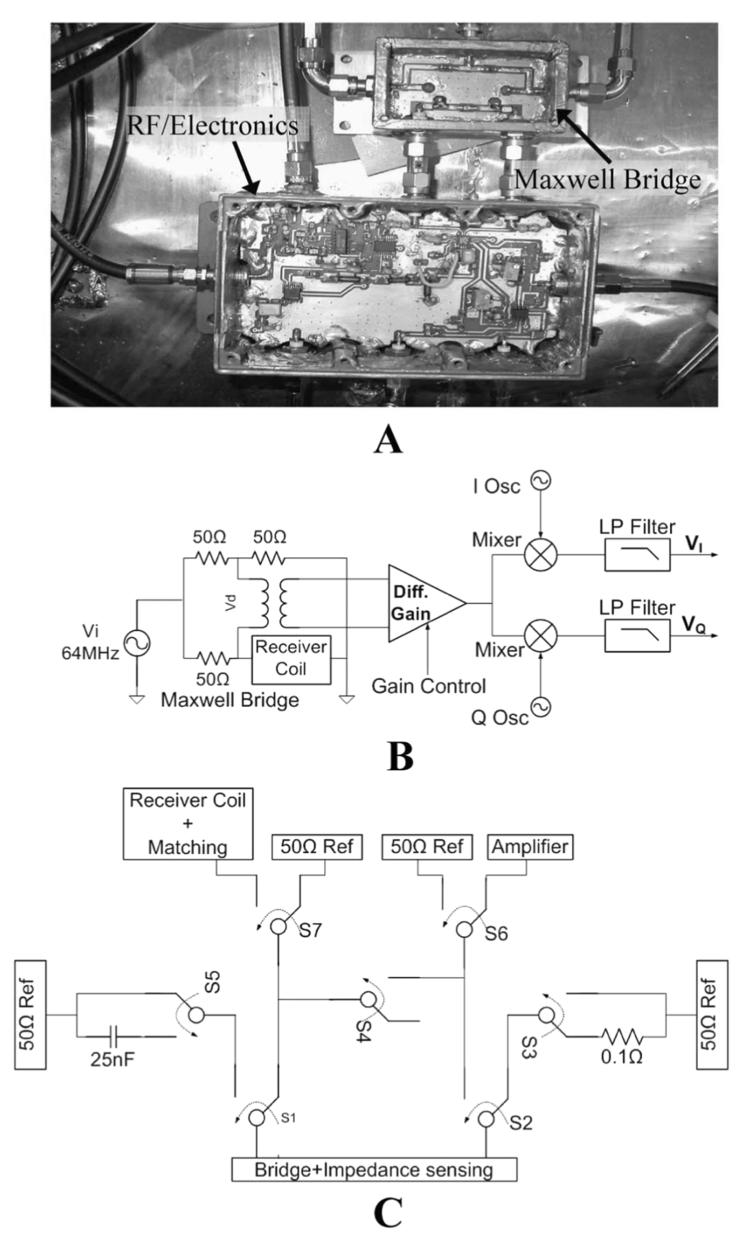
Fig. 3 shows a circuit block diagram of the vector impedance measuring circuit. Basically, the coil is first connected to a Maxwell bridge. The local oscillator signal is
| (7) |
where ω0 is the operational frequency and ϕis the phase of the signal. We assume that the unmatched coil has an impedance Z = 50 + ΔR + j ΔX where; (|ΔR|/50), (|ΔX|/50) < < 1.
Fig. 3.
(a) Picture of the impedance sensing circuit implementation. (b) Block diagram of vector impedance senor. (c) Block diagram of the switch box connected via two coaxial cables to the Maxwell bridge.
Using a Taylor series expansion for the output voltage of the bridge, and since our differential amplifier has very high input impedance, the output of the bridge is
| (8) |
where ϕ = tan −1 (δX / ΔR). The bridge output is then connected to a quadrature modulator. After amplification and quadrature down-conversion, the in-phase (subscript I) and quadrature (subscript Q) voltage outputs are
| (9) |
where ζ is the gain of the amplification stage. This can be expressed in matrix form as
| (10) |
Assuming there are voltage offsets on each of the quadrature paths (I and Q), this implies;
| (11) |
where , C is the rotation matrix shown in (10) and D is the offset voltage vector for the lines. Thus, the output voltage vector is an affine function of the difference between the impedance of the coil and 50Ω.
We adopt a calibration procedure to calculate C and D, neglecting the fact that C is a rotation matrix in case there are other phase variations (for example, arising from changes in the electric line length) that would result in C having an elliptic form. During calibration, the switch box illustrated in Fig. 3(c), utilizes high-precision RF relay switches to connect 50-Ω reference loads to the circuit, with switching contact resistance of magnitude less than 0.03 Ω. All of the circuits are RF shielded and the switch bias control lines for the switches have low-pass filters [Fig. 2(F)] to minimize external interference. For calibration, reference loads of ZL = 50.0 Ω, ZL = 50.1 Ω, and ZL = 500 − j0.1 Ω are connected to the bridge, and the corresponding output vector voltages and are measured. The circuit parameters are calculated from a set of linear equations
| (12) |
For verification a load of ZL = 50.1 − j0.1 Ω is connected and the vector voltage is used to estimate this load via
| (13) |
Tests demonstrate that an accuracy of 0.05 Ω in impedance sensing is routinely achieved. With accurate measurements of coil impedance, the voltages on the matching circuit var-actors are changed based on a heuristic modified gradient decent numerical algorithm with an adaptive step, to match the coil. The algorithm stops when the impedance difference , as measured by the vector impedance sensor. During all experiments convergence of the algorithm was monitored to ensure that the desired accuracy is achieved. It is worth noting that a super-linear convergence of the algorithm was observed. The matching algorithm works as follows.
Initialize and ΔRset = 5 Ω and ΔX;set = 5 Ω;
Initialize index k = 0; set ΔC;1
Cm2 is set to maximum; Cm3 is set to minimum;
Cm1 is sequentially adjusted so that ΔR > ΔRset and ΔX > ΔXset;2
A course step size is first chosen (ΔC1, ΔC2) to determine the direction that makes where ΔC1 ≠ ΔC2 in general; increment k;
- is calculated and used to update the new Capacitor values where
and controls the step size; k = k + 1; If and repeat Step 6, otherwise continue;
If then terminate, otherwise Initialize ΔRset = ΔRset + 1 Ω, ΔXset = ΔXset + 1 Ω and go to Step2.
B. RF Radiometry
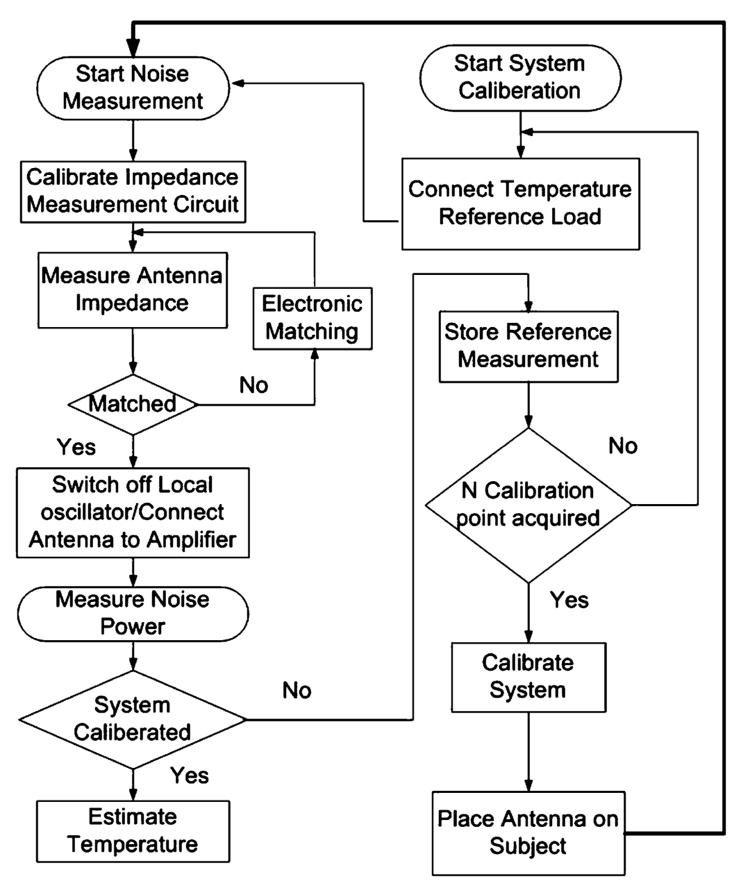
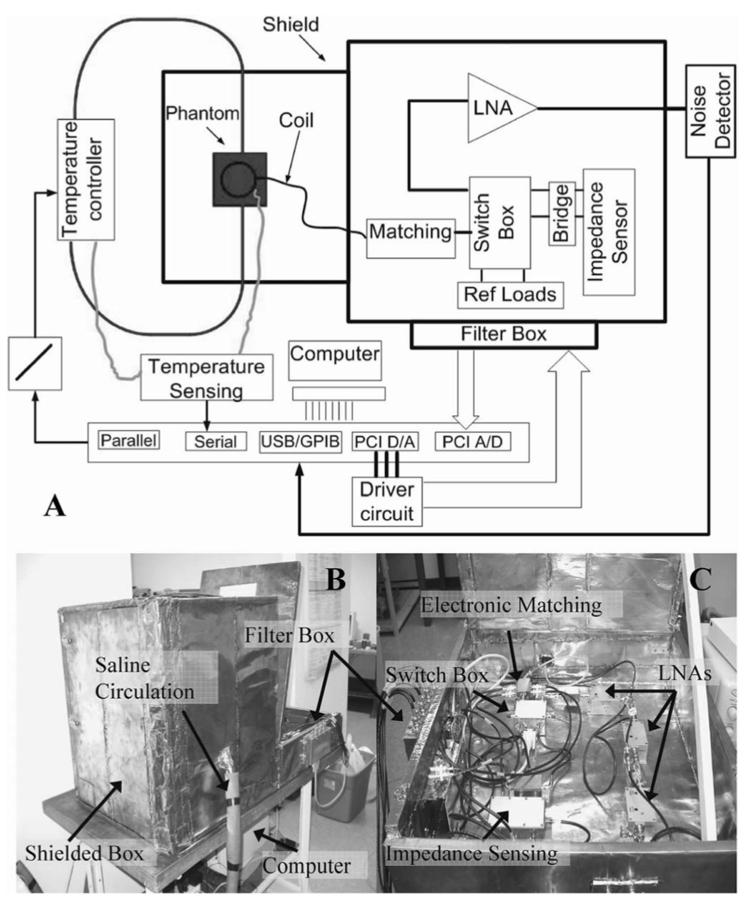
Block diagrams of the RF radiometer and its operational flowchart are shown in Figs. 4 and 5. The system has a 6-cm square receiver coil that is tuned to 64 MHz and connected to a switching box via a matching network. The switching box has two main functions. First, it connects different reference impedance loads to the impedance sensing circuit for calibration. Second, it connects the coil either to the impedance sensing circuit during the matching procedure, or to the amplification stage to permit noise measurements. To operate, a calibration is first performed to derive the system parameters, α and β in (4). The radiometer's detection coil is placed at defined locations on at least two homogeneous objects of known uniform temperature distribution, which serve as temperature references. Additional temperature references (> 2) permit use of linear regression techniques for parameter estimation. The oscillator in the impedance sensing circuit is turned on, and the circuit cycles through a calibration procedure that ensures a measurement accuracy of 0.05 Ω. The coil is then connected to the circuit and is electronically matched to 50 Ω. The oscillator is then switched off to avoid interference with noise measurements. The coil is next connected to a low-noise 100-dB amplifier maintained at stable thermal conditions, which in turn feeds a spectrum analyzer that adds an additional 100 dB of amplification for noise power measurement over a 100-kHz bandwidth.
Fig. 4.
Flowchart of the procedure for RF radiometric measurements.
Fig. 5.
(a) Block diagram of the system used for impedance sensing, matching, calibration and noise measurement. The experimental setup for phantom testing and temperature monitoring is depicted top left. (b) Photograph showing the system composed of a 60-cm3 shielded box that contains the phantom and coil. Saline is circulated to the box through thermally insulated, RF shielded hoses. Attached is another shielded box containing the electronic circuits where control signals are fed through a low pass filter box. (c) The various electronic components are shown: Impedance sensing, switch box, electronic matching, and amplification.
Fig. 5 shows a block diagram of an experimental bench-top radiometer. The system is controlled by a personal computer (P3/450 MHz), and consists of a 60-cm copper cubic shielded box wherein samples are measured. Tests were done on heated saline pumped from a 25-l reservoir at a rate of 350 l/min through thermally insulated, RF-shielded hoses into a 2-l insulated cubic phantom resting on the coil. Saline temperature is continuously monitored and controlled with a home-built MRI-compatible temperature controller at 4 different locations (the reservoir, the hose, the phantom, and on top of the coil) by fiber optic temperature measurement probes (FISO Technologies Inc, Model UMI-8) interfaced to the computer's serial port.
Two PCI cards are used for signal acquisition and control, while an ADC card, with a 200-kHz sampling rate, is used to sample the output of the impedance sensing circuit. A DAC card is interfaced via a buffer to control the relays in the switching box and voltages applied to varactors in the matching circuit. All low-frequency control, dc and acquisition signals pass through a filter box to eliminate RF leakage from sources external to the shielded box.
Fig. 5(b) shows a photograph of the experimental setup. The impedance-sensing box in Fig. 5(c) is connected to a bridge which is attached to the switch box. The coil is also connected to the switch box via the electronic matching box. Three 33-dB gain, 0.35-dB noise figure, tuned 64 MHz low noise MRI preamplifiers low-noise amplifier (LNA) :GE medical systems) are cascaded to provide the 100-dB gain. They are connected between the switch box and an Advantest R3261A spectrum analyzer for performing noise measurements. The measurements are transferred to the computer via a GPIB interface where they are collected and processed.
C. MRI Radiometry
Combining thermal monitoring methods with MRI has become increasingly important as RF power deposition levels have grown with the development of sub-second imaging sequences, and higher magnetic field strengths, as well as emerging applications that utilize MRI to monitor delivery of hyper- and hypo-thermia therapies. Present methods for sensing temperature changes within the MRI environment are limited to MRI-based relative thermal mapping, or to invasive absolute contact measurements at discrete points in the body using conventional sensors such as thermo-couples or fiber-optic probes. Relative thermal mapping based on MRI-signal phase differences are useful for guiding thermal interventions, but are very sensitive to motion [18], [19]. Integrating motion-insensitive absolute thermal mapping methods such as radiometry with high-resolution MRI or even MRI-based relative thermometry, offers a potentially important solution to the problem of absolute temperature monitoring during MRI.
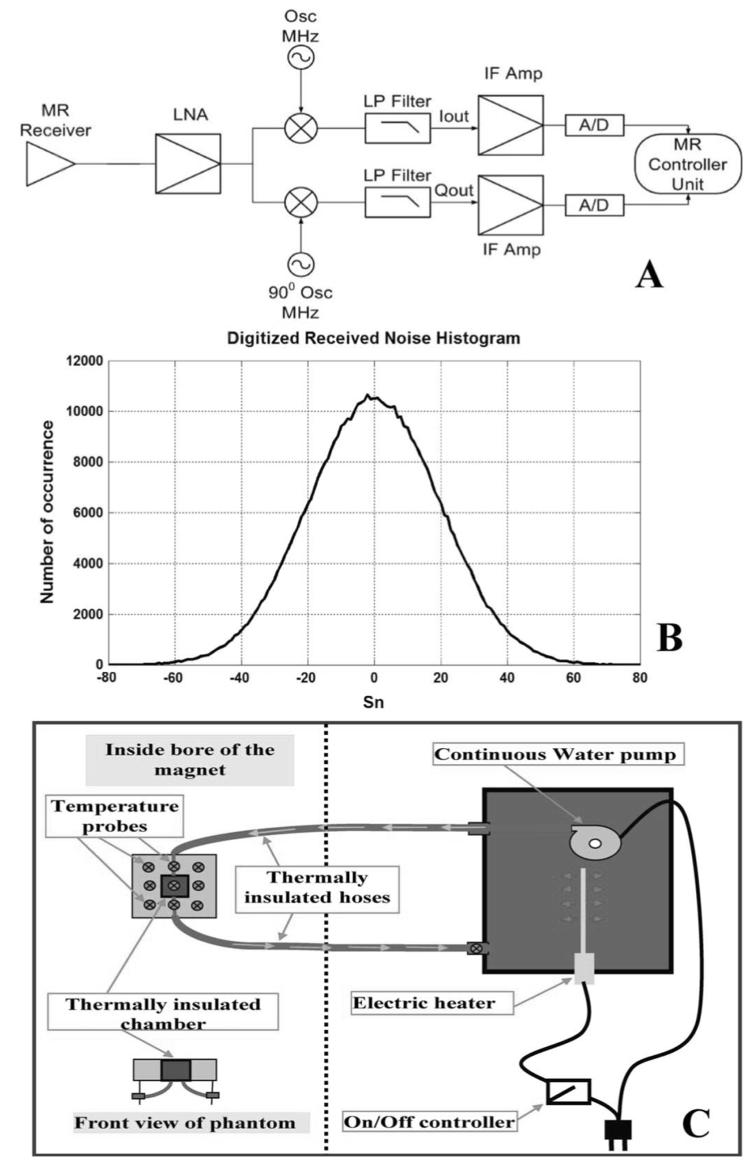
The MRI scanner has detectors that operate in a RF-screened room, as well as low-noise amplification, quadrature phase-sensitive detection and digital conversion circuitry in its receiver chain, that parallel the functionality of our radiometer Fig. 6(a). The noise signal received by the MRI scanner between scans can thus be used as an RF radiometer to passively measure noise power emitted by bodies in the field of view detected by the MRI receiver coils. The MRI demodulation process sets the center frequency for reception and does not alter the received noise characteristics. The receiver bandwidth is controlled by the low pass (LP) filtering stage.
Fig. 6.
(a) Block diagram for MR receiver chain. (b) Histogram of the digitized received signal from the MR receiver showing clear Gaussian distribution characteristics. (c) Schematic showing the experimental setup used during experiments conducted in the MRI scanner. Water's temperature is controlled in a thermally insulated box, placed by the side of the scanner's table, and pumped to circulate through the plastic phantom placed inside the bore of the magnet.
IV. Results
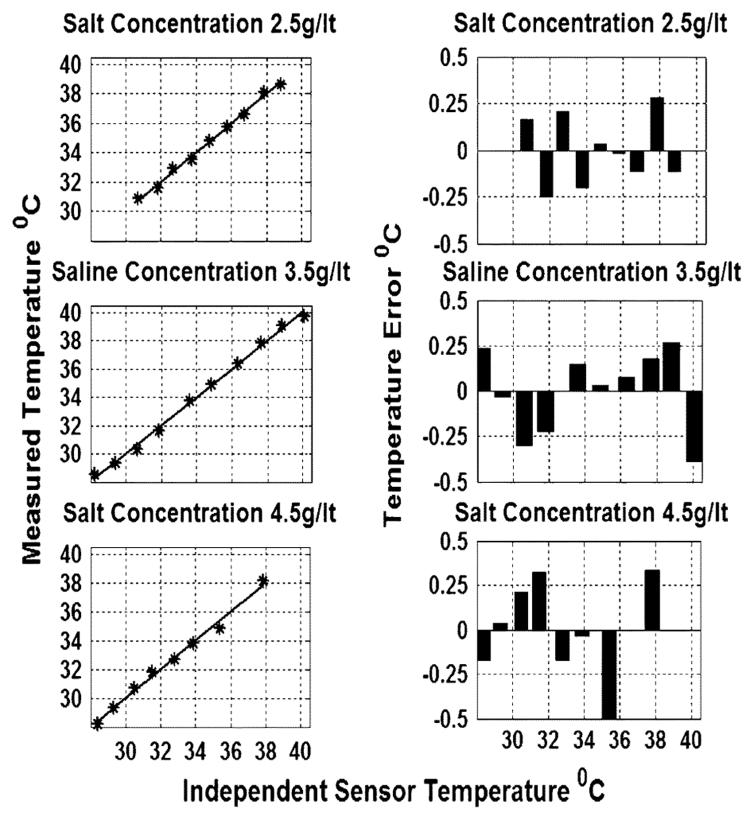
The bench-top radiometer was tested with heated saline phantoms containing salt concentrations of 2.5, 3.5, and 4.5 g/l to mimic the electrical properties of biological tissue at 64 MHz. Phantom temperature is accurately controlled and monitored via the fiber-optic temperature sensors, and radiometric measurements performed only after all four sensors read the same temperature. The radiometer is calibrated at five known phantom reference temperatures. After temperature calibration, radiometric temperature measurements are performed and compared with the independent sensor measurements. Fig. 7 shows the experimental results. The maximum deviation of radiometric temperature measurements from fiber-optic probe measurements is ∼0.5° C, and the calculated standard deviation (SD) of the error is less than 0.1° C for the three phantoms over the physiologic range 28–40 °C. The matching algorithm converged to within 0.01 Ω during all of the experiments conducted. We conclude that the accuracy of temperature estimates is ±0.1° C.
Fig. 7.
Left-side figures: temperature measured from noise power versus temperatures measured with fiber optic probes for three different saline concentrations. Right-side figures: the corresponding error estimates associated with each experiment.
MRI Experiment
Radiometric measurements were performed using a GE Medical Systems' Signa 1.5T scanner with a total system gain of 14 dB, and 1.0-dB noise figure. A histogram of the received noise voltage was recorded from a 50-Ω reference load at constant temperature. Jarque-Bera goodness-of-fit testing revealed that the noise was Gaussian [Fig. 6(b)] and followed a normal distribution at a 95% confidence level [20], confirming theoretical assumptions. A 6-cm cubic plastic phantom was placed in the MRI system on a rectangular loop surface coil and a 3.5 g/l saline solution whose temperature was monitored and controlled by the MRI-compatible controller, was pumped through it [Fig. 6(c)]. The coil's matching and tuning is adjusted before each measurement to exactly 50 Ω using a Hewlett-Packard vector network analyzer.
The relationship between the received signal noise variance and the absolute temperature of the phantom (T) was first determined with the scanner's RF transmission and gradients turned-off and the receiver bandwidth set to 125 kHz. Fifty million samples were acquired over 4 min for each variance measurement to ensure that the statistical error in the temperature was ≪01.°C. Again, the system was calibrated by measuring the receiver noise variance at 11 different temperatures, and the data fitted by the method of least squares to the equivalent of (4)
| (14) |
where α is the lumped system gain, and β the noise added by the system. This yielded ((α, β) = (0.158,23.63) with 99%, confidence, as shown in Fig. 8(a), [20]. The figure shows that the MRI radiometer can measure temperatures in the range 16–39 °C with ±1°C accuracy.
Low spatial resolution radiometric thermal imaging was then attempted on a two-chamber 18 × 18-cm rectangular phantom. A 6 × 6-cm middle chamber was connected to the temperature controller, thermally insulated and maintained at 38 °C. The second, outer compartment, contained saline maintained at room temperature (28 °C), and surrounded the middle chamber at a depth of 6 cm on all sides. A coarse thermal image of the phantom was obtained by manually scanning [21] the radiometer's surface coil over 3 × 3 nonoverlapping voxels [22], [23]. The temperature of each voxel was continuously monitored with fiber-optic sensors. The noise variance of each voxel was measured and converted to its corresponding temperature value using the calibration curve. The reconstructed thermal map is shown in Fig. 8(b). Note that some outer voxels deviate from the true temperature by ∼2°C, although the SD of the measurements was 1.0 °C. This is greater than the statistical error of 0.1 °C for 50-M samples. The error is dominated by inaccuracies in tuning and matching, also reflected in the 0.9 °C SD in Fig. 8(a), which is consistent with Fig. 8(b). Contamination from both of the thermal chambers of the phantom due to the spatial sensitivity of the receiver coil is also a factor limiting spatial resolution and accuracy (a “partial volume” effect).
V. Discussion and Conclusion
We have built a bench-top RF radiometer and developed a method for measuring absolute radiometric temperatures over sample distributions that are weighted by the power-sensitivity profile of the detector. We have demonstrated with phantom studies, that RF radiometry performed with careful matching and calibration, can be used to detect absolute temperature with an accuracy of ±0.1° C over a physiological range. The RF radiometer can be used for monitoring the average absolute temperature of tissues lying much deeper in the body than can be detected with microwave radiometers.
We have successfully demonstrated the feasibility of utilizing the standard electronic systems of a clinical MRI scanner for use as an RF radiometer, permitting measurements with an accuracy of about ±1 °C in a homogeneous sample [Fig. 8(a)], and maximum error of about 2 °C in a thermally heterogeneous phantom. If sensitivity to smaller temperature variations is sought, then one should consider, instead, integrating the described bench-top radiometer into the MRI scanner. The maximum noise figure of ∼1 dB for the MRI study, corresponds to a maximum system noise power contribution of 13%. This does not change with sample temperature and is eliminated by calibration [via (4)]. Adequate shielding is critical: removing shielding from the bench radiometer results in overwhelming external interference that renders thermometry impractical. Small increases in system noise figures can be compensated to some degree by increasing the number of noise samples.
Spatial resolution is low, being limited by the local sensitivity of the surface MRI antenna coils deployed. Smaller detectors provide finer resolution but reduce depth sensitivity, and larger or whole-body MRI coils provide body average temperature measurements. The potential for higher spatial resolution radiometric thermal imaging is enhanced by the current trend in MRI technology for deploying very large numbers of coil elements in MRI “phased-array” detectors.
The speed of the current radiometer is fundamentally limited by the sample rate required for a given temperature accuracy. For example, 50-M samples were required to achieve an accuracy of 0.1 °C, which required 4 min, as determined by the bandwidth and loaded quality factor (Q) of the coil. The sample rate may be increased proportionate with reductions in Q. In an alternative approach voltage controlled oscillators can be used to measure the detector's impedance over the operational bandwidth to compensate for changes over its frequency characteristic response and thereby further improve accuracy.
Integration of RF radiometry with MRI scanners would provide a useful independent monitor of temperature and tissue heating during MRI scans wherein heating from RF power deposition by the MRI sequences must be kept below regulatory guidelines [13]. This is increasingly important as the speed of MRI sequences increases, resulting in higher duty cycles for power deposition, and as field strengths increase from 1.5 to 3 T which quadruples power deposition [17]. In addition, there is growing interest in applying MRI to guide therapeutic intervention. Inasmuch as hyper- and hypo-thermia therapies have clinical value, RF radiometry offers a potential method of titrating therapy, with or without MRI guidance. In this application, by combining the absolute temperature measurements in an uninvolved region of the subject, with the high spatial resolution thermometric techniques afforded by MRI [20], [24], [25] both overcomes the relative nature of the MRI measurements and the poor spatial resolution of RF radiometry. RF Radiometry is insensitive to motion provided that it does not affect loading.
Acknowledgment
The authors would like to thank Dr. B. Qui, The Johns Hopkins University (JHU), Baltimore, MD, for his help during experiments conducted on the MR scanner and Dr. M. L. Edwards, JHU Advanced Physics Laboratories (APL), for insightful technical discussions.
Biographies
AbdEl-Monem M. El-Sharkawy (M'96) received the B.S. and M.S. degrees in systems and biomedical engineering, Cairo University, Cairo, Egypt, in 1998 and 2001, respectively, and the M.S. degree in electrical and computer engineering, from The Johns Hopkins University, Baltimore, MD, in 2004. He is currently working towards the Ph.D. degree in the Electrical and Computer Engineering Department at the same university.
His research interests include RF and microwave circuits design, electromagnetic numerical simulations, hardware and software design of magnetic resonance imaging (MRI) scanners and ultrasound medical imaging modalities, thermo-therapy and functional temperature mapping, medical imaging processing, and random signal analysis.

Paul P. Sotiriadis (M'02) received the diploma in electrical engineering and computer science from the National Technical University of Athens (NTUA), Athens, Greece, in 1994, the M.S. degree in electrical engineering from Stanford University, Stanford, CA, in 1996, and the Ph.D. degree in electrical engineering and computer science from the Massachusetts Institute of Technology, Cambridge, in May 2002.
Since June 2002, he has been an Assistant Professor in the Department of Electrical and Computer Engineering, The Johns Hopkins University, Baltimore, MD. His research interests include design, optimization, and mathematical modeling of analog and mixed-signal circuits, RF and microwave circuits, fine frequency synthesis, and interconnect networks in deep-submicron technologies.
Dr. Sotiriadis is an Associate Editor of the IEEE Transactions on Circuits and Systems—II: Express Briefs.
Paul A. Bottomley received the B.Sc. Hon. degree (first class), in physics from Monash University, Melbourne, Australia, in 1974, and the Ph.D. degree in physics from the University of Nottingham, Nottingham, U.K., in 1978.
His thesis project involved building one of the first magnetic resonance imaging (MRI) scanners. He spent two years as a Research Associate in the Department of Physiological Chemistry, The Johns Hopkins University, Baltimore, MD, adapting MRI for localized magnetic resonance spectroscopy (MRS). He then joined the GE Research & Development Center, Schenectady, NY, in 1980, to develop MRI and MRS for human applications. This resulted in GE's first and highly successful 1.5 -T product, of which many thousands have been sold. He moved back to The Johns Hopkins University, joining the Department of Radiology therein, in 1994, where he is currently the Russell H. Morgan Professor and Director of the Division of MR Research. At The Johns Hopkins University, he holds joint appointments as Professor in the Departments of Medicine, Biomedical Engineering, and Electrical and Computer Engineering. His research interests cover a broad range of MRI and MRS devices, techniques and applications, especially internal MRI antennae, and cardiac MRI. He has co-authored over 140 peer-reviewed journal papers, and over 30 patents many of which are in commercial use.
Prof. Bottomley is a Fellow of the International Society for Magnetic Resonance in Medicine and a recipient of its gold medal for pioneering contributions to the field. He received GE's Coolidge Fellowship and medal, and GE's gold patent medallion.

Ergin Atalar received the B.S. degree from Bogazici University, Istanbul, Turkey, the M.S. degree from Middle East Technical University, Ankara, Turkey, and the Ph.D. degree from Bilkent University, Ankara, Turkey, in 1985, 1987, and 1991, respectively, all in electrical engineering.
In 1991, he joined The Johns Hopkins University, Baltimore, MD, where he became a Professor of Radiology, Biomedical, Electrical and Computer Engineering. He is currently Vice Chair and Professor of the Electrical Engineering Department, Bilkent University, with a part-time appointment at The Johns Hopkins University. He is also a founder of Surgi-Vision, Inc., Columbia, MD. His main research interest is magnetic resonance imaging (MRI), particularly development of methods and devices for MRI guided interventions. He has published over 70 journal papers, 190 conference papers, and 15 U.S. patents.

Footnotes
This work was supported by the National Institute of Health (NIH) under Grant R01HL57483 and Grant R01RR15396. This paper was recommended by Guest Editor A. G. Andreou.
ΔC was empirically determined.
This condition ensures that the L2 norm ||ΔZ(Cm2, Cm3)|| has a unique minimum within the area of interest and guarantees convergence [Fig. 2(d)].
References
- 1.Nyquist H. Thermal agitation of electric charge in conductors. Phys Rev. 1928;32:110–112. [Google Scholar]
- 2.Johnson J. Thermal agitation of electricity in conductors. Phys Rev. 1928;32:97–109. [Google Scholar]
- 3.Pozar DM. Microwave Engineering. Wiley; New York: 1998. [Google Scholar]
- 4.Carr K. Microwave radiometry: Its importance to the detection of cancer. IEEE Trans Microw Theory Tech. 1989 Dec.37(12):1862–1869. [Google Scholar]
- 5.Carr K. Radiometric sensing: Detecting cancer and keeping tabs on blood warming using microwaves. IEEE Potentials. 1997;16:21–25. [Google Scholar]
- 6.Williams KL, Williams FJ, Handley RS. Infra-red thermometry in the diagnosis of breast disease. Lancet. 1961;2:1378–81. doi: 10.1016/s0140-6736(61)91198-9. [DOI] [PubMed] [Google Scholar]
- 7.Leroy Y, Bocquet B, Mamuni A. Non-invasive microwave radiometry thermometry. Physiol Meas. 1998;19:127–148. doi: 10.1088/0967-3334/19/2/001. [DOI] [PubMed] [Google Scholar]
- 8.Land D. Medical microwave radiometry and its clinical applications. Proc IEE Colloq, Appl Microw Medicine. 1995:2/1–2/5. [Google Scholar]
- 9.Karanasiou IS, Uzunoglu NK, Papageorgiou CC. Towards functional noninvasive imaging of excitable tissues inside the human body using focused microwave radiometry. IEEE Trans Microw Theory Tech. 2004 Aug.52(8):1898–1908. [Google Scholar]
- 10.Dicke R. The measurement of thermal radiation at microwave frequencies. Rev Sci Instr. 1946;17:268–275. doi: 10.1063/1.1770483. [DOI] [PubMed] [Google Scholar]
- 11.Dubois L, Sozanski J, Tessier V, Camart J, Fabre J, Pribetich J, Chive M. Temperature control and thermal dosimetry by microwave radiometry in hyperthermia. IEEE Trans Microw Theory Tech. 1996 Oct.44(10):1755–1761. [Google Scholar]
- 12.Grosvenor C, Billinger R. The NIST 30/60 MHZ Tuned Radiometer for Noise Temperature Measurements National Instituite of Standards and Technology. Boulder, CO: May, 2002. Tech. Note 1525. [Google Scholar]
- 13.Amendment 1—Medical electrical equipment—Part 2-33: Particular Requirements for the Safety of Magnetic Resonance Equipment for Medical Diagnosis. Document # IEC 60601-2-33, I. E. C. (IEC) [On-line]. Available: www.iec.ch.
- 14.Cheever E, Foster K. Microwave radiometry in living tissue: What does it measure? IEEE Trans Biomed Eng. 1992 Jun.39(6):563–568. doi: 10.1109/10.141194. [DOI] [PubMed] [Google Scholar]
- 15.Ridaoui K, Mamouni A, Ait Abdelmalek R, Bocquet B, Leroy Y. Near field weighting functions for microwave radiometric signals. IEEE Trans Magn. 1995 May;31(5):2166–2169. [Google Scholar]
- 16.Wang J, Reykowski A, Dickas J. Calculation of the signal-to-noise ratio for simple surface coils and arrays of coils. IEEE Trans Biomed Eng. 1995 Sep.42(9):908–917. doi: 10.1109/10.412657. [DOI] [PubMed] [Google Scholar]
- 17.Bottomley P, Roemer P. Homogenous tissue model estimates of RF power deposition in human NMR studies. Ann New York Acad Sci. 1992;649:144–159. doi: 10.1111/j.1749-6632.1992.tb49604.x. [DOI] [PubMed] [Google Scholar]
- 18.Ishihara Y, Calderon A, Watanabe H, Okamoto K, Suzuki Y, Kuroda K, Suzuki Y. A precise and fast temperature mapping using water proton chemical shift. Magn Reson Med. 1995;34:814–23. doi: 10.1002/mrm.1910340606. [DOI] [PubMed] [Google Scholar]
- 19.Paliwal V, El-Sharkawy AM, Du X, Yang X, Atalar E. SSFP-based MR thermometry. Magn Reson Med. 2004;52:704–8. doi: 10.1002/mrm.20231. [DOI] [PubMed] [Google Scholar]
- 20.Judge GG, Hill RC, Griffiths WE, Lütkepohl H, Lee T-C. Introduction to the Theory and Practice of Econometrics. Wiley; New York: 1988. [Google Scholar]
- 21.Bocquet B, Velde J, Mamouni A, Leroy Y, Giaux G, Delannoy J, Delalvalee D. Microwave radiometric imaging at 3 GHz for exploration of breast tumors. IEEE Trans Microw Theory Tech. 1990 Jun.38(6):791–793. [Google Scholar]
- 22.El-Sharkawy AM, Sotiriadis P, Qiu B, Atalar E. Absolute thermal mapping using the MR scanner; Proc 13th ISMRM Conf; Miami, FL. Jun. 2005. [Google Scholar]
- 23.El-Sharkawy AM, Atalar E. U.S. Patent Application No. US2004021642. A radiometric approach to temperature monitoring using a magnetic resonance scanner. submitted for publication.
- 24.Weidensteiner C, Kerioui N, Quesson B, de Senneville BD, Trillaud H, Moonen CT. Stability of real-time MR temperature mapping in healthy and diseased human liver. J Magn Reson Imag. 2004;19:438–46. doi: 10.1002/jmri.20019. [DOI] [PubMed] [Google Scholar]
- 25.Gellermann J, Wlodarczyk W, Hildebrandt B, Ganter H, Nicolau A, Rau B, Tilly W, Fahling H, Nadobny J, Felix R, Wust P. Noninvasive magnetic resonance thermography of recurrent rectal carcinoma in a 1.5 Tesla hybrid system. Cancer Res. 2005;65:5872–80. doi: 10.1158/0008-5472.CAN-04-3952. [DOI] [PubMed] [Google Scholar]


