

Abstract
Chemoreceptors of the bacterium Escherichia coli are thought to form trimers of homodimers that undergo conformational changes upon ligand binding and thereby signal a cytoplasmic kinase. We monitored the physical responses of trimers in living cells lacking other chemotaxis proteins by fluorescently tagging receptors and measuring changes in fluorescence anisotropy. These changes were traced to changes in energy transfer between fluorophores on different dimers of a trimer: attractants move these fluorophores farther apart, and repellents move them closer together. These measurements allowed us to define the responses of bare receptor oligomers to ligand binding and compare them to the corresponding response in kinase activity. Receptor responses could be fit by a simple ‘two-state’ model in which receptor dimers are in either active or inactive conformations, from which energy bias and dissociation constants could be estimated. Comparison with responses in kinase-activity indicated that higher-order interactions are dominant in receptor clusters.
Keywords: chemotaxis, receptors, membrane proteins, fluorescence polarization, fluorescence resonance energy transfer
Introduction
Interaction between transmembrane receptors is recognized as important for function in different sensory systems, including those that involve T-cell receptors, G protein-coupled receptors, and bacterial chemoreceptors1–3. In the E. coli chemotaxis pathway, receptor complexes are associated with a dedicated histidine kinase, CheA, that initiates intracellular responses via phospho-transfer to a signaling protein, CheY, that when phosphorylated binds to the base of the flagellar motors and modulates the swimming behavior of the bacterium. The activity of the kinase is coupled to the conformational state of the receptors, which is controlled by binding of ligand at their periplasmic ends and by methylation or demethylation of sites in their cytoplasmic domains. Receptor modifications, catalyzed by CheR and CheB, mediate adaptation of the kinase activity to persistent stimuli. Bacterial chemoreceptors, e.g., the receptor for aspartate, Tar, or the receptor for serine, Tsr, form stable homodimers4. Several lines of evidence5–9 suggest that dimers interact at their cytoplasmic ends to form trimers of dimers (Fig. 1a) that, in association with CheA and a coupling factor, CheW, cluster to form larger receptor arrays10,11. Association between receptors in arrays is thought to promote allosteric interactions that result in signal amplification, extended dynamic range, and integration between inputs of different kinds8,12,13. Measurements of the output kinase activity as a function of ligand concentration, both in vitro14,15 and in vivo16,17, exhibit a wide dynamic range, spanned by receptors in different modification states, and/or high cooperativity. Various models18–27, based on different types of coupling between receptors, can account for this behavior. However, the physical interactions responsible for such collaborative responses are not yet clear. The trimer-of-dimers structure, which forms even in the absence of other chemotaxis proteins, provides the first stage where physical association between neighboring dimers, at the trimer contact region, can lead to coupling in their response.
Figure 1.

Anisotropy responses to ligand binding. (a) Cartoon of trimer structure, drawn to scale, showing the labelling position. (b) Fluorescence anisotropy traces measured with a population of flhD cells expressing Tar-YFP (green symbols), Tsr-YFP (red symbols), or TsrI377P-YFP (blue symbols). Cells attached to a cover slip were exposed to flowing buffer to which serine (1 mM), aspartate (1 mM), or sucrose (100 mM) were added for the periods indicated by the black bars. The delay between the addition and removal of the chemical and the onset or termination of the response is mostly due to the time required for the reagents to reach or be washed away from the cells. (c) The raw fluorescence intensity (in photon counts, integrated over 3 s) in the parallel (open symbols) and perpendicular (closed symbols) channels recorded during the experiment with Tsr-YFP.
Here, we sought to monitor changes in the conformation of dimers generated by ligand binding in the absence of the kinase or other downstream elements, i.e., to define the conformational response of bare receptor oligomers, presumably trimers of dimers. We expressed chemoreceptors fused to yellow fluorescent protein (YFP) at their C-termini (Fig. 1a) in cells lacking other chemotaxis proteins, excited the fluorophore with polarized light, and measured changes in the polarization of the emitted light (changes in anisotropy; see Materials and Methods). We found that binding of attractant molecules to the periplasmic domain of receptor dimers (e.g., aspartate to Tar or serine to Tsr) increased the anisotropy, while binding of repellent molecules (e.g. nickel to Tar) decreased it. The anisotropy also was affected by receptor modification, increasing with changes that, in wild-type cells, inhibit kinase activity, and decreasing with changes that enhance kinase activity. However, stimulus-dependent changes in anisotropy were not observed with mutants unable to form trimers or when labeled receptors, expressed at a fixed level, were diluted out by co-expression of unlabeled receptors. In addition, partial bleaching of the fluorophores increased the level of anisotropy and reduced the response to ligand binding. Thus, changes in anisotropy upon chemotactic stimulation are due to changes in the level of energy transfer between YFPs on different homodimers (via homo-FRET): YFPs move farther apart with stimuli that, in wild-type cells, decrease the kinase activity, or closer together with stimuli that increase the kinase activity. Dose-response curves based upon these physical responses exhibited a smaller dynamic range and were more linear than those based upon kinase activity.
Results
The physical response of the receptors to ligand binding
Fig. 1b shows anisotropy traces measured from Tar-YFP (green symbols), Tsr-YFP (red symbols) or TsrI377P-YFP (blue symbols) expressed in flhD cells that otherwise fail to express any chemotaxis genes. Fig. 1c shows the raw intensity recorded in the two polarization directions during the experiment with Tsr-YFP. The anisotropy of the fluorescence from Tar-YFP increased when aspartate was added but not when serine was added. Conversely, the anisotropy of the fluorescence from Tsr-YFP increased when serine was added but not when aspartate was added. In both cases, the anisotropy decreased upon addition of sucrose, as noted before28. Thus, like osmotic up-shift but with opposite sign, binding of ligand to the dimer periplasmic domain produces a change in the spacing of YFP molecules at the C-terminal ends of the receptors, within the cytoplasm. The baseline anisotropy of the fluorescence from TsrI377P-YFP, a variant known to be defective in trimer formation6, was consistently larger than that from Tar-YFP or Tsr-YFP, and this variant failed to respond to either serine or sucrose, as expected if depolarization is due to homo-FRET between YFP fluorophores on different homodimers within trimers of dimers. To further verify the role of FRET in the observed polarization response, we performed in-vivo dilution experiments, similar to those reported earlier28, in which Tar-YFP (or Tsr-YFP) was expressed at a fixed level together with increasing levels of non-labelled Tsr (or Tar). Since Tar and Tsr can form mixed trimers, expression of non-labelled receptors should decrease the number of YFP molecules within each trimer, leading to a reduced FRET interaction, and thus to increased baseline anisotropy and smaller responses to the addition of ligand (Fig. 2a). Bleaching of the YFP fluorophores would be expected to produce similar effects, as shown in Fig. 2b. In this experiment, the response to addition of aspartate (black bars) was measured from cells expressing Tar-YFP before (left) and after bleaching (middle), together with a control for cells in the same preparation not previously exposed to light (right). As expected, irreversible bleaching that reduced the YFP fluorescence by about 50% increased the baseline anisotropy and reduced the response to ligand. It also is clear that changes in FRET that occur upon ligand binding are not due to internal modulations between fluorophores on the same homodimer: both the mutant TsrI377P-YFP receptor (Fig. 1) and the diluted Tar-YFP or Tsr-YFP receptors (Fig. 2a) failed to respond. Nor do changes in FRET that occur upon ligand binding require displacements of the flexible regions at the C-terminal ends of the receptors: similar results were obtained when YFP was fused to a shortened version of Tar, Tar1–527, missing 27 C-terminal residues (data not shown).
Figure 2.

The effect of diluting the YFP label. (a) Mixing of different receptor types. Normalized response amplitude, Δr/r0, obtained from flhD cells co-expressing Tsr-YFP (to serine; blue symbols) or Tar-YFP (to aspartate; red symbols) together with Tar or Tsr, respectively. Tsr-YFP or Tar-YFP were expressed at fixed level, while Tar or Tsr were expressed at different levels by varying the concentration of sodium salicylate, as indicated in the abscissa, corresponding to a fraction of labelled receptors ranging roughly from 0.7 to 0.0528. Data were normalized by the response at 0 μM sodium salicylate. The dashed line is a guide to the eye. (b) Bleaching. Anisotropy level measured from flhD cells expressing Tar-YFP. Aspartate (300 μM) was added to the buffer during the intervals indicated by the black bars. Between the first and second trials (left arrow) the intensity of the excitation light was transiently increased by a factor of 16, bleaching some of the fluorophore. Between the second and third trials (right arrow) a new field-of-view was chosen containing cells not previously exposed to the excitation light.
To study the effect of adaptation on the physical state of dimers we constructed YFP fusions with receptors containing different E to Q replacements at the methylation sites. In wild-type cells, these sites are expressed initially as QEQE, with Q glutamine and E glutamate. Glutamine is known to mimic the effect of methylated glutamate; a receptor variant constructed as Tar(EEEE) has an extremely low kinase activity, while a variant constructed as Tar(QQQQ) has an extremely high kinase activity29. Fig. 3a shows anisotropy responses obtained with Tar(EEEE)-YFP (green symbols) or Tar(QQQQ)-YFP (red symbols) in experiments where aspartate or nickel were consecutively added and removed. While aspartate inhibits the kinase activity, and thus acts as an attractant, nickel increases the kinase activity, and thus acts as a repellent. Accordingly, as shown in Fig. 3a, nickel triggers an anisotropy response opposite to that triggered by aspartate. While the response to aspartate of EEEE receptors is smaller than that measured with QQQQ receptors, their response to nickel is larger than that measured with QQQQ receptors. In addition, EEEE receptors exhibit a consistently higher baseline anisotropy level than that exhibited by QQQQ receptors. These observations indicate that QQQQ receptors are already stabilized in a conformation that is close to that generated by binding of nickel (defined as the ‘on’ state), and EEEE receptors are stabilized in a conformation that is close to that generated by binding of aspartate (defined as the ‘off’ state). The anisotropy of the fluorescence from various Tar-YFP variants with different numbers of E to Q replacements at varying aspartate or nickel concentration is shown in Fig. 3b. Increasing the Q content of the receptors progressively increased the response amplitude to aspartate and decreased the response amplitude to nickel. In addition, receptor modification shifted the sensitivity of the receptors, as indicated by the concentration of aspartate that lead to a half maximal response, K1/2. Similar K1/2 values were obtained for EEEE and QQQQ receptors in experiments performed with strain UU1581 (deleted for all the che genes; data not shown).
Figure 3.
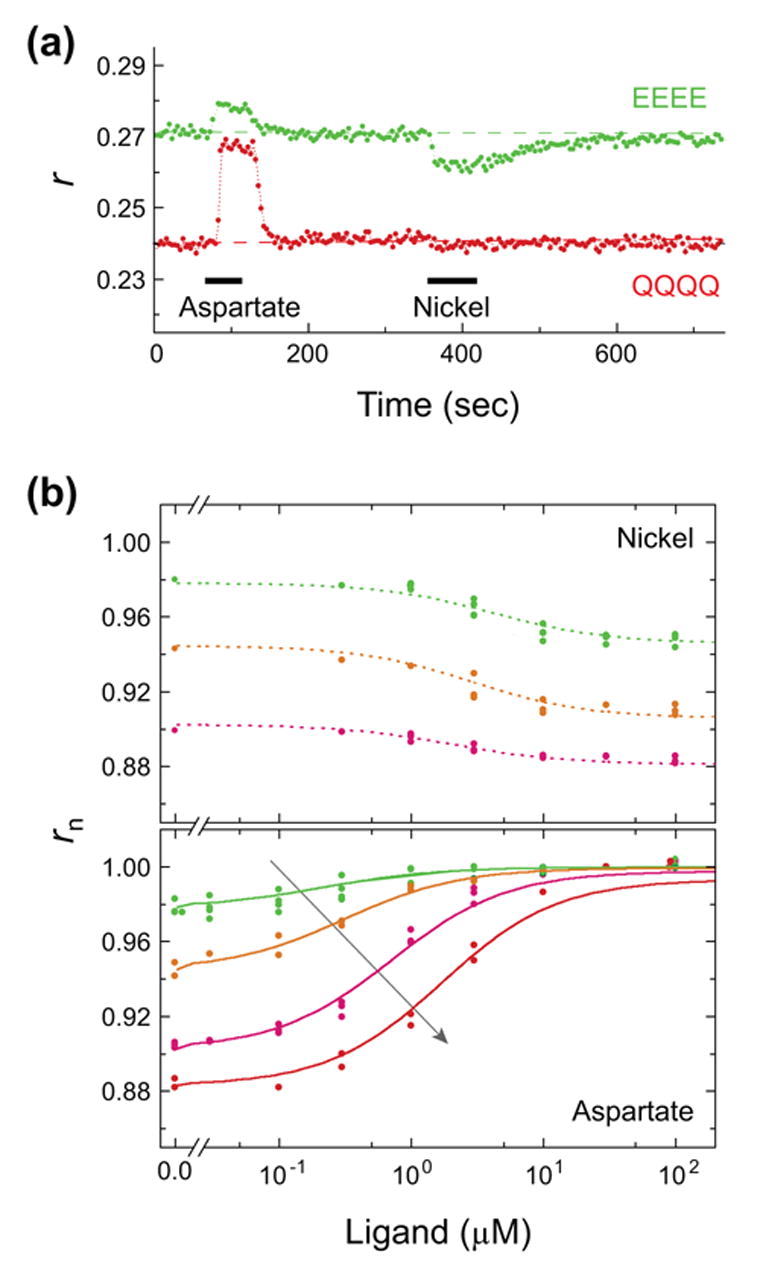
Attractant and repellent responses of receptors in different modification states. (a) Anisotropy responses to addition and removal of aspartate (500 μM) or nickel (100 μM) measured with flhD cells expressing Tar(EEEE)-YFP (green symbols) or Tar(QQQQ)-YFP (red symbols). (b) The anisotropy level measured with various Tar mutants: reading along the arrow, EEEE (green), QEEE (orange), QEQQ (magenta), and QQQQ (red), in experiments in which increasing amounts of nickel (upper plot) or aspartate (lower plot) were added and removed. Data from a few repetitions of each experiment are shown. Anisotropy levels were normalized as follows: lower plot, data were normalized to the value in the presence of 30 μM aspartate; upper plot, data were multiplied by α/r0, with r0 the anisotropy value at 0 ligand and α the value read from the corresponding plot in the lower panel at 0 ligand. Lines are fits to the data using Eq. 1, with and for aspartate set to 0.2 and 30 μM and for nickel set to 5.5 and 1.4 μM, respectively, and with ΔEEEEE=1.6 kT, ΔEQEEE=0.3 kT, ΔEQEQQ=−1.1 kT, and ΔEQQQQ=−2.2 kT.
Fit of receptor responses to a two-state model
Receptor dimers are thought to switch rapidly between on and off states, which activate or inactivate the CheA kinase, respectively29–31. Binding of repellent favors the on state and binding of attractant favors the off state, with dissociation constants and , respectively. The difference in energy between these states in the absence of binding, ΔE=Eon–Eoff, depends upon the level of receptor modification, with methylation (or amidation) favoring the on state and demethylation (or deamidation) favoring the off state. Within this framework23,26, the probability that a dimer is in the on state is given by:
| (1) |
with [l] the concentration of ligand. Under the assumption that changes in anisotropy are proportional to changes in Pon, the data presented in Fig. 3 fit Eq. 1 (solid lines), yielding approximate values for the dissociation constant ~ 0.2 μM (aspartate), and for ΔE ~ −2.2 to +1.6 kT, depending on the receptor modification state. Small deviations from the fitted lines are noticeable at high aspartate concentrations, mainly with the QQQQ receptors. These deviations might reflect nonlinearities between the measured anisotropy and Pon or nonlinear coupling between dimers. Since nickel is thought to be sensed through the action of a periplasmic binding protein32, direct interpretation of the fit to the nickel data is problematic.
Comparison of receptor and kinase responses
In Fig. 4 we compare changes in anisotropy measured with Tar-YFP in different adaptation states with the corresponding changes in kinase activity (measured in cells in which both CheA and CheW were expressed). The latter measurements were made with cheR cheB cells (strain VH1) expressing Tar receptors with various E to Q replacements (color coded as in Fig. 3b) or with cheR+cheB+ cells (strain VS181) expressing only Tar receptors (blue symbols), by the FRET technique described previously16; see Materials and Methods. For clarity, the dose-responses determined from changes in anisotropy are represented by the fits to the data shown in Fig. 3b (solid lines). Responses of kinase activity to addition of nickel were limited to nickel concentrations below 30 μM, above which a decrease in kinase activity was observed, presumably due to a toxic effect; such an effect was not observed in the anisotropy measurements. As noted previously14–16,29, changes in the adaptation state of the receptors shift their sensitivity to attractants; this is indicated by the concentration of ligand producing a half-maximal response. Note that in wild-type cells, where CheR and CheB are present, receptors tend to be in low modification states33 and exhibit the most sensitive response16. Fig. 4 further demonstrates that upon receptor modification, the sensitivity to nickel (a repellent) also shifts, but, in the opposite direction than the corresponding shift of the sensitivity to aspartate. Such opposite shifts in the sensitivity to attractants and repellents are consistent with a basic symmetry of the two-state model under simultaneous replacement :
Figure 4.

Comparison of receptor and kinase responses. Solid lines: anisotropy responses to varying concentrations of nickel (upper panel) and aspartate (lower panel) normalized to the saturated response, Δrsat, and color coded as in Fig. 3b: EEEE receptors green, QEEE receptors orange, QQQQ receptors red. These lines are fits to Eq. 1. Dotted lines with open symbols: kinase activities (dose-response plots) for measurements made with cheR+cheB+ cells expressing only Tar receptors (blue symbols) or cheR cheB cells expressing only modified Tar receptors (using the color code of Fig. 3b).
| (2) |
The dynamic range spanned by responses of receptors at different modification states, indicated by the shift in the K1/2, is compared in Fig. 4 with the corresponding responses of kinase activity. Since the response of kinase activity to addition of attractant is not measurable with cells expressing only EEEE receptors, we present in Fig. 4 the dose-response obtained with CheR+ CheB+ cells expressing only Tar receptors, which represent the most sensitive Tar configuration measured thus far16. Clearly, the dynamic range of responses in kinase activity is larger than that for changes in receptor conformation, both for repellent and attractant stimuli, and the kinase responses are more cooperative.
Discussion
From fluorescence anisotropy measurements of YFP fused to the chemoreceptor C-termini we have defined the physical responses of these receptors to ligand binding in the absence of the kinase or other chemotaxis proteins. All of our data are consistent with the proposition that bacterial chemoreceptors are homodimers that form higher-order oligomers that can contain homodimers of different types. For simplicity, hereafter we assume that these oligomers are trimers of dimers. Binding of attractants increased the fluorescence anisotropy (Figs. 1b, 3a), while binding of repellents or addition of osmotic agents decreased it (Figs 1b, 3a). Various lines of evidence showed that these changes were due to changes in the level of homo-FRET between YFPs on different trimer arms. Although energy transfer between adjacent YFPs on the same homodimer must occur – the anisotropy observed with labeled homodimers is appreciably smaller than that observed with free YFP28 – these interactions did not change upon addition of attractants or repellents: no responses were seen with a trimer-deficient mutant (Fig. 1b) or when labelled receptors were diluted out by addition of unlabeled ones (Figs. 2a). Since the YFPs are tethered to the receptors via a chain of several amino acids, they should be able to reorient on a nanosecond time scale. Evidently, when CheR (or CheB), which is larger then YFP, binds to a receptor at the same position, it is free to move and act on the adaptation sites of neighbouring dimers34,35. If the rotational diffusion of YFP were restricted, the anisotropy level in the absence of homo-FRET would be expected to exceed that of free YFP28. However, we did not observe an anisotropy level larger than that of free YFP, even in experiments in which Tsr-YFP was diluted with Tsr or Tar-YFP was diluted with Tar, in which case the receptor monomers also should be diluted, resulting in minimal homo-FRET (data not shown). Therefore, it is the average distance between fluorophores that is expected to dominate the time-averaged level of energy transfer and thus the observed anisotropy. We conclude that addition of attractants increases the spacing between YFPs on different homodimers, while addition of repellents decreases it.
Changes in the spacing between YFPs on different homodimers are likely due to conformational changes within homodimers that lead to changes in their relative orientation within a trimer. Ligand binding is thought to cause one transmembrane domain of a dimer to slide in a piston-like movement about 2 Å relative to the other three36 and thereby trigger a change in the conformation of an adjacent cytoplasmic HAMP domain37. Re-orientation of dimers presumably results from such transformations. Given that the homo-FRET Förster radius of YFP is about 5.9 nm and the spacing between dimers at their heads is about 10 nm38, re-orientation of dimers is certain to affect the efficiency of homo-FRET between the fluorophores linked to their C-termini (Fig. 1a). A rough estimate of the movements required to explain the observed changes in efficiency yields a 10% change in the distance between YFPs28. The simplest re-orientation that would modulate the spacing between YFPs on adjacent homodimers is tilting or bending of the homodimers, which would change the angle between adjacent homodimers. Such changes might result from re-positioning of the dimer transmembrane domains within the membrane bilayer due to hydrophobic interactions39. The effect of osmolarity can be understood in a similar way, since higher osmolarity causes cells to shrink, increasing the thickness of the membrane, and thus affecting the positioning within the membrane of transmembrane receptor domains28. It has been proposed that upon ligand binding homodimers rotate about their long axis40. However, if rotation of the dimers were to dominate the observed response, the naive expectation would be that the length and flexibility of the linker at the receptor C-terminus would affect the magnitude of the response; however, removal of this peptide had no effect. In any event, changes in the orientation of homodimers within the trimer might be required for signal propagation to the kinase. Interestingly, in recent work with receptors embedded in membrane nanodiscs it was found that isolated homodimers did not activate the kinase; at least three homodimers per disc were required to activate the kinase41.
Changes in spacing between YFPs generated by ligand binding could, in principle, reflect trimer dissociation. Given that responses were as fast as ~ 3 sec (limited only by the mixing time in our flow chamber; data not shown), repeatable and reproducible, such a mechanism would require that receptor oligomers be fully dynamic, equilibrate on a time scale significantly shorter then 3 sec, and with equilibrium constants that depend upon receptor activity. While subunit exchange between trimers on long time scales (several minutes) has been reported7, an effect of ligand binding on trimer stability has not. On the contrary, in-vitro studies with Tar/Tsr mixed-receptor populations have shown that binding of serine to Tsr does not affect the methylation rate of Tar by CheR bound to Tsr, indicating that serine binding does not change the association of Tar with Tsr35. Similar conclusions about the stability of receptor trimers exposed to changes in ligand binding, even over long periods of time (several hours), were reached in cross-linking experiments carried out in vivo in the presence of CheA and CheW7.
While the idea that receptor clustering can promote collaborative responses is widely accepted, the interactions that mediate such responses are not known. We found that dose-response curves based upon physical responses of homodimers within trimers exhibited a significantly smaller dynamic range than those based upon changes in kinase activity in clusters (Fig. 4); the former were more linear and could be fit by a simple model in which receptors are viewed as independent two-state elements (Eq. 1, Fig. 3). Additional evidence that responses of adjacent dimers are independent is provided by in vitro experiments in which CheR was activated by the receptor to be methylated, but not by its neighbours35. Two distinct mechanisms can account for the non-linear relationship between the physical responses of bare trimers and changes in kinase activity in clusters (Fig. 5): (i) Direct physical interactions between trimers might be responsible for this non-linear relationship. These interactions would be promoted by CheA and CheW, which assemble the trimers in tight clusters. Interactions between dimers from neighbouring trimers might dominate, e.g., through direct contact between periplasmic dimer domains42. Given the motion of dimers detected in the present work, propagation of signals between trimers will be inevitable if such contact is established. (ii) The coupling of the dimers to the kinase might itself be non-linear. Since three dimers of a trimer are coupled jointly to a number of CheA dimers (three, in the model presented in ref. 38), the relation between the physical response of individual dimers and the corresponding change in kinase activity could be nonlinear, i.e., Pon(kinase) might be a non-linear function of Pon(dimer). In addition, there might be feedback in which the conformational state of the kinase affects that of the dimers. In this case, interactions between receptors could be mediated by the kinase itself.
Figure 5.

A cartoon suggesting ways to bridge the gap between the behaviour of bare oligomers and oligomers coupled to the kinase. The kinase can promote direct physical coupling between trimers by supporting tight clustering (top), or promote indirect coupling by mediating conformational spread (bottom).
Materials and Methods
Bacterial strains
All strains were derivatives of E. coli K12 strain RP437. Strains VS117 (flhD), VH1 (cheZ cheY cheR cheB tsr tar tap trg aer), and VS181 (cheZ cheY tsr tar tap trg aer) were gifts of Victor Sourjik (University of Heidelberg, Heidelberg), and strain UU1581 (deleted for all che genes, tsr tar tap trg flhC and flhD) was a gift of Sandy Parkinson (University of Utah, Salt lake city). Cells were grown overnight in 5 ml Bacto-Tryptone (10 g/l), diluted 100-fold in 10 ml Bacto-Tryptone supplemented with the appropriate antibiotics and inducers, and allowed to grow to OD600 ~0.45. Fluorescent receptor fusions were induced with about 20 μM IPTG, which produced expression levels within the physiological range28. No extra salt (NaCl, 5 g/l) was added to the growth medium, in order to avoid adaptation to osmotic stress. Cells were washed and resuspended in motility medium (buffer): 10 mM potassium phosphate, 0.1 mM EDTA, 1 μM methionine and 10 mM lactic acid, pH 7. Responses to nickel were measured in a similar buffer containing only 50 nM EDTA or no EDTA. In the latter case, the buffer was treated with Chelex-100 (Sigma), which adsorbs heavy metal ions; no obvious difference was noted between the two cases.
Plasmids
An A206K mutation was introduced in eyfp (Clontech, Mountain View, CA) to eliminate the self association of its gene product43. This variant of YFP was used throughout, except in pVS88; see below. For simplicity, we refer to the gene as yfpA206K and its product as YFP. Vectors carrying tar (pLC113) and tsr (pPA114) under control of a sodium salicylate-inducible promoter were a gift of Sandy Parkinson6,7. Vectors carrying cheZ-cfp and cheY-yfp (pVS88), tarEEEE (pVS121), tarQEEE (pVS120), tarQEQQ (pVS122), where a gift of Victor Sourjik16,17. Vectors carrying tsr-yfpA206K (pAV29) or tar-yfpA206K (pAV32) where described previously28. Vectors carrying tarEEEE-yfpA206K (pAV39), tarQEEE-yfpA206K (pAV37), or tarQEQQ-yfpA206K (pAV38) where constructed from pAV32 by replacing tar with tar variants from pVS121, pVS120, and pVS122, respectively. Vector tarQQQQ-yfpA206K (pAV40) was constructed by site-directed mutagenesis from pAV38. Vectors carrying tarEEEE(1–527)-yfpA206K (pAV43) or tarQQQQ(1–527)-yfpA206K (pAV45) were constructed by PCR from pAV32 and cloned into expression vector pTrc99A.
Fluorescence polarization
The system for measuring fluorescence polarization was described earlier28. In brief, we used a Nikon Optiphot microscope equipped with two epi-fluorescence attachments, mounted in tandem. The excitation beam was polarized and passed through a YFP fluorescence cube (Chroma Technology, Brattleboro, VT) mounted in the first attachment. The emitted light was analyzed with a polarizing beamsplitter (extinction ratio > 500; New Focus, San Jose, CA) mounted in the second attachment. The two polarization channels were monitored with photon counters (H7421–40, Hamamatsu, Bridgewater, NJ). The steady-state polarization of the emitted fluorescence is represented here by the fluorescence anisotropy, r, defined as (Ipar − Iper)/(Ipar + 2Iper), where Iper was corrected for imperfections of the optical system. Experiments were done at room temperature (22°C).
Kinase activity
At steady state, the rate of phosphorylation of the signalling molecule, CheY, through the action of the kinase, CheA, is equal to its rate of dephosphorylation, through the action of the phosphatase, CheZ. The phosphatase activity, proportional to the concentration of the CheZ/CheY-P complex, can be measured by FRET between CheZ-CFP and CheY-YFP, as described earlier16. Cells expressing these proteins were excited at 440 nm, and the cyan (465–505nm) and yellow (520–550nm) emissions were monitored.
Acknowledgments
We thank V. Sourjik and J.S. Parkinson for strains and plasmids, T.S. Shimizu for helpful conversations, and J.S. Parkinson and J.J. Falke for their comments on the manuscript. This work was supported by National Institutes of Health Grant AI016478.
Footnotes
Publisher's Disclaimer: This is a PDF file of an unedited manuscript that has been accepted for publication. As a service to our customers we are providing this early version of the manuscript. The manuscript will undergo copyediting, typesetting, and review of the resulting proof before it is published in its final citable form. Please note that during the production process errors may be discovered which could affect the content, and all legal disclaimers that apply to the journal pertain.
References
- 1.Germain RN, Stefanova I. The dynamics of T cell receptor signaling: complex orchestration and the key roles of tempo and cooperation. Annu Rev Immunol. 1999;17:467–522. doi: 10.1146/annurev.immunol.17.1.467. [DOI] [PubMed] [Google Scholar]
- 2.Agnati LF, Ferre S, Lluis C, Franco R, Fuxe K. Molecular mechanisms and therapeutical implications of intramembrane receptor/receptor interactions among heptahelical receptors with examples from the striatopallidal GABA neurons. Pharmacol Rev. 2003;55:509–550. doi: 10.1124/pr.55.3.2. [DOI] [PubMed] [Google Scholar]
- 3.Bray D, Duke T. Conformational spread: the propagation of allosteric states in large multiprotein complexes. Annu Rev Biophys Biomol Structure. 2004;33:53–73. doi: 10.1146/annurev.biophys.33.110502.132703. [DOI] [PubMed] [Google Scholar]
- 4.Milligan DL, Koshland DE., Jr Establishing the dimeric structure of the aspartate receptor of bacterial chemotaxis. J Biol Chem. 1988;263:6268–6275. [PubMed] [Google Scholar]
- 5.Kim KK, Yokota H, Kim SH. Four-helical-bundle structure of the cytoplasmic domain of a serine chemotaxis receptor. Nature. 1999;400:787–792. doi: 10.1038/23512. [DOI] [PubMed] [Google Scholar]
- 6.Ames P, Studdert CA, Reiser RH, Parkinson JS. Collaborative signaling by mixed chemoreceptor teams in Escherichia coli. Proc Natl Acad Sci USA. 2002;99:7060–7065. doi: 10.1073/pnas.092071899. [DOI] [PMC free article] [PubMed] [Google Scholar]
- 7.Studdert CA, Parkinson JS. Crosslinking snapshots of bacterial chemoreceptor squads. Proc Natl Acad Sci USA. 2004;101:2117–2122. doi: 10.1073/pnas.0308622100. [DOI] [PMC free article] [PubMed] [Google Scholar]
- 8.Parkinson JS, Ames P, Studdert CA. Collaborative signaling by bacterial chemoreceptors. Curr Opin Microbiol. 2005;8:116–121. doi: 10.1016/j.mib.2005.02.008. [DOI] [PubMed] [Google Scholar]
- 9.Ames P, Parkinson JS. Conformational suppression of inter-receptor signaling defects. Proc Natl Acad Sci USA. 2006;103:9292–9297. doi: 10.1073/pnas.0602135103. [DOI] [PMC free article] [PubMed] [Google Scholar]
- 10.Sourjik V, Berg HC. Localization of components of the chemotaxis machinery of Escherichia coli using fluorescent protein fusions. Mol Microbiol. 2000;37:740–751. doi: 10.1046/j.1365-2958.2000.02044.x. [DOI] [PubMed] [Google Scholar]
- 11.Maddock JR, Shapiro L. Polar location of the chemoreceptor complex in the Escherichia coli cell. Science. 1993;259:1717–1723. doi: 10.1126/science.8456299. [DOI] [PubMed] [Google Scholar]
- 12.Bray D, Levin MD, Morton-Firth CJ. Receptor clustering as a cellular mechanism to control sensitivity. Nature. 1998;393:85–88. doi: 10.1038/30018. [DOI] [PubMed] [Google Scholar]
- 13.Sourjik V. Receptor clustering and signal processing in E. coli chemotaxis. Trends Microbiol. 2004;12:569–576. doi: 10.1016/j.tim.2004.10.003. [DOI] [PubMed] [Google Scholar]
- 14.Li G, Weis RM. Covalent modification regulates ligand binding to receptor complexes in the chemosensory system of Escherichia coli. Cell. 2000;100:357–365. doi: 10.1016/s0092-8674(00)80671-6. [DOI] [PubMed] [Google Scholar]
- 15.Levit MN, Stock JB. Receptor methylation controls the magnitude of stimulus-response coupling in bacterial chemotaxis. J Biol Chem. 2002;277:36760–36765. doi: 10.1074/jbc.M204325200. [DOI] [PubMed] [Google Scholar]
- 16.Sourjik V, Berg HC. Receptor sensitivity in bacterial chemotaxis. Proc Natl Acad Sci USA. 2002;99:123–127. doi: 10.1073/pnas.011589998. [DOI] [PMC free article] [PubMed] [Google Scholar]
- 17.Sourjik V, Berg HC. Functional interactions between receptors in bacterial chemotaxis. Nature. 2004;428:437–441. doi: 10.1038/nature02406. [DOI] [PubMed] [Google Scholar]
- 18.Shi Y, Duke T. Cooperative model of bacterial sensing. Phys Rev E. 1998;58:6399. [Google Scholar]
- 19.Duke TAJ, Bray D. Heightened sensitivity of a lattice of membrane receptors. Proc Natl Acad Sci USA. 1999;96:10104–10108. doi: 10.1073/pnas.96.18.10104. [DOI] [PMC free article] [PubMed] [Google Scholar]
- 20.Mello BA, Tu Y. Quantitative modeling of sensitivity in bacterial chemotaxis: the role of coupling among different chemoreceptor species. Proc Natl Acad Sci USA. 2003;100:8223–8228. doi: 10.1073/pnas.1330839100. [DOI] [PMC free article] [PubMed] [Google Scholar]
- 21.Shimizu TS, Aksenov SV, Bray D. A spatially extended stochastic model of the bacterial chemotaxis signalling pathway. J Mol Biol. 2003;329:291–309. doi: 10.1016/s0022-2836(03)00437-6. [DOI] [PubMed] [Google Scholar]
- 22.Albert R, Chiu Y-w, Othmer HG. Dynamic receptor team formation can explain the high signal transduction gain in Escherichia coli. Biophys J. 2004;86:2650–2659. doi: 10.1016/S0006-3495(04)74321-0. [DOI] [PMC free article] [PubMed] [Google Scholar]
- 23.Mello BA, Shaw L, Tu Y. Effects of receptor interaction in bacterial chemotaxis. Biophys J. 2004;87:1578–1595. doi: 10.1529/biophysj.104.042739. [DOI] [PMC free article] [PubMed] [Google Scholar]
- 24.Rao CV, Frenklach M, Arkin AP. An allosteric model for transmembrane signaling in bacterial chemotaxis. J Mol Biol. 2004;343:291–303. doi: 10.1016/j.jmb.2004.08.046. [DOI] [PubMed] [Google Scholar]
- 25.Mello BA, Tu Y. An allosteric model for heterogeneous receptor complexes: understanding bacterial chemotaxis responses to multiple stimuli. Proc Natl Acad Sci USA. 2005;102:17354–17359. doi: 10.1073/pnas.0506961102. [DOI] [PMC free article] [PubMed] [Google Scholar]
- 26.Keymer JE, Endres RG, Skoge M, Meir Y, Wingreen NS. Chemosensing in Escherichia coli: two regimes of two-state receptors. Proc Natl Acad Sci USA. 2006;103:1786–1791. doi: 10.1073/pnas.0507438103. [DOI] [PMC free article] [PubMed] [Google Scholar]
- 27.Skoge ML, Endres RG, Wingreen NS. Receptor-receptor coupling in bacterial chemotaxis: evidence for strongly coupled clusters. Biophys J. 2006;90:4317–4326. doi: 10.1529/biophysj.105.079905. [DOI] [PMC free article] [PubMed] [Google Scholar]
- 28.Vaknin A, Berg HC. Osmotic stress mechanically perturbs chemoreceptors in Escherichia coli. Proc Natl Acad Sci USA. 2006;103:592–596. doi: 10.1073/pnas.0510047103. [DOI] [PMC free article] [PubMed] [Google Scholar]
- 29.Bornhorst JA, Falke JJ. Evidence that both ligand binding and covalent adaptation drive a two-state equilibrium in the aspartate receptor signaling complex. J Gen Physiol. 2001;118:639–710. doi: 10.1085/jgp.118.6.693. [DOI] [PMC free article] [PubMed] [Google Scholar]
- 30.Asakura S, Honda H. Two-state model for bacterial chemoreceptor proteins : the role of multiple methylation. J Mol Biol. 1984;176:349–367. doi: 10.1016/0022-2836(84)90494-7. [DOI] [PubMed] [Google Scholar]
- 31.Barkai N, Leibler S. Robustness in simple biochemical networks. Nature. 1997;387:913–917. doi: 10.1038/43199. [DOI] [PubMed] [Google Scholar]
- 32.Pina K, Navarro C, McWalter L, Boxer DH, Price NC, Kelly SM, Mandrand-Berthelot MA, Wu LF. Purification and characterization of the periplasmic nickel-binding protein NikA of Escherichia coli K12. Europ J Biochem. 1995;227:857–865. doi: 10.1111/j.1432-1033.1995.tb20211.x. [DOI] [PubMed] [Google Scholar]
- 33.Draheim RR, Bormans AF, Lai RZ, Manson MD. Tryptophan residues flanking the second transmembrane helix (TM2) set the signaling state of the Tar chemoreceptor. Biochemistry. 2005;44:1268–1277. doi: 10.1021/bi048969d. [DOI] [PubMed] [Google Scholar]
- 34.Mingshan L, Hazelbauer GL. Adaptational assistance in clusters of bacterial chemoreceptors. Mol Microbiol. 2005;56:1617–1626. doi: 10.1111/j.1365-2958.2005.04641.x. [DOI] [PubMed] [Google Scholar]
- 35.Antommattei FM, Munzner JB, Weis RM. Ligand-specific activation of Escherichia coli chemoreceptor transmethylation. J Bacteriol. 2004;186:7556–7563. doi: 10.1128/JB.186.22.7556-7563.2004. [DOI] [PMC free article] [PubMed] [Google Scholar]
- 36.Falke JJ, Hazelbauer GL. Transmembrane signaling in bacterial chemoreceptors. Trends Biochem Sci. 2001;26:257–265. doi: 10.1016/s0968-0004(00)01770-9. [DOI] [PMC free article] [PubMed] [Google Scholar]
- 37.Hulko M, Berndt F, Gruber M, Linder JU, Truffault V, Schultz A, Martin J, Schultz JE, Lupas AN, Coles M. The HAMP domain structure implies helix rotation in transmembrane signaling. Cell. 2006;126:929–940. doi: 10.1016/j.cell.2006.06.058. [DOI] [PubMed] [Google Scholar]
- 38.Shimizu TS, Le Novere N, Levin MD, Beavil AJ, Sutton BJ, Bray D. Molecular model of a lattice of signalling proteins involved in bacterial chemotaxis. Nat Cell Biol. 2000;2:792–796. doi: 10.1038/35041030. [DOI] [PubMed] [Google Scholar]
- 39.Miller AS, Falke JJ. Side chains at the membrane-water interface modulate the signaling state of a transmembrane receptor. Biochemistry. 2004;43:1763–1770. doi: 10.1021/bi0360206. [DOI] [PMC free article] [PubMed] [Google Scholar]
- 40.Irieda H, Homma M, Homma M, Kawagishi I. Control of chemotactic signal gain via modulation of a pre-formed receptor array. J Biol Chem. 2006;281:23880–23886. doi: 10.1074/jbc.M600018200. [DOI] [PubMed] [Google Scholar]
- 41.Boldog T, Grimme S, Li M, Sligar SG, Hazelbauer GL. Nanodiscs separate chemoreceptor oligomeric states and reveal their signaling properties. Proc Natl Acad Sci USA. 2006;103:11509–11514. doi: 10.1073/pnas.0604988103. [DOI] [PMC free article] [PubMed] [Google Scholar]
- 42.Kim SH, Wang W, Kim KK. Dynamic and clustering model of bacterial chemotaxis receptors: structural basis for signaling and high sensitivity. Proc Natl Acad Sci USA. 2002;99:11611–11615. doi: 10.1073/pnas.132376499. [DOI] [PMC free article] [PubMed] [Google Scholar]
- 43.Zacharias DA, Violin JD, Newton AC, Tsien RY. Partitioning of lipid-modified monomeric GFPs into membrane microdomains of live cells. Science. 2002;296:913–916. doi: 10.1126/science.1068539. [DOI] [PubMed] [Google Scholar]