

Abstract
Coupling laser capture microdissection (LCM) with sensitive quantitative chemiluminescent immunoassays has broad applicability in the field of proteomics applied to normal, diseased, or genetically modified tissue. Quantitation of the number of prostate-specific antigen (PSA) molecules/cell was conducted on human prostate tissue cells procured by LCM from fixed and stained frozen sections. Under direct microscopic visualization, laser shots 30 μm in diameter captured specific cells from the heterogeneous tissue section onto a polymer transfer surface. The cellular macromolecules from the captured cells were solubilized in a microvolume of extraction buffer and directly assayed using an automated (1.5 hour) sandwich chemiluminescent immunoassay. Calibration of the chemiluminescent assay was conducted by developing a standard curve using known concentrations of PSA. After the sensitivity, precision, and linearity of the chemiluminescent assay was verified for known numbers of solubilized microdissected tissue cells, it was then possible to calculate the number of PSA molecules per microdissected tissue cell for case samples. In a study set of 20 cases, using 10 replicate samples of 100 laser shots per sample, the within-run (intraassay) SD was approximately 10% of the mean or less for all cases. In this series the number of PSA molecules per microdissected tissue cell ranged from 2 × 10⁴ to 6.3 × 10⁶ in normal epithelium, prostate intraepithelial neoplasia (PIN), and invasive carcinoma. Immunohistochemical staining of human prostate for PSA was compared with the results of the soluble immunoassay for the same prostate tissue section. Independent qualitative scoring of anti-PSA immunohistochemical staining intensity paralleled the LCM quantitative immunoassay for each tissue subpopulation and verified the heterogeneity of PSA content between tissue subpopulations in the same case. Extraction buffers were successfully adapted for both secreted and membrane-bound proteins. This technology has broad applicability for the quantitation of protein molecules in pure populations of tissue cells.
As the field of molecular biology moves beyond genomics to proteomics, 1 there is a growing need to monitor the levels of expressed proteins directly in developing, diseased, or genetically altered tissues. Tissues are complicated three-dimensional structures composed of multiple subpopulations of cells interacting with each other and with the extracellular matrix. The amount and type of proteins expressed by cells in their native tissue environment may be quite different from those of cultured or transplanted cells. Although immunohistochemistry provides valuable information concerning the localization of antigenic epitopes in histological sections of tissue, it does not readily permit quantitation of proteins in individual cell populations. 2 Moreover, it has not been possible to calibrate the intensity of immunohistochemical staining with the actual number of antigen molecules in the stained tissue cells. Consequently, there is a great need for technology that can directly measure the quantitative level of specific proteins in actual microscopic tissue cells. Quantitative immunoassays of molecular markers in specific subpopulations of tissue cells, as compared to current global subjective immunohistochemical assessment, can provide precise objective values that may potentially be useful in diagnostic or therapeutic decisions.
Laser capture microdissection (LCM) is a technology recently developed by our laboratory 3-5 and commercialized by Arcturus Engineering (www.arctur.com). LCM enables the user to procure pure cells from stained heterogeneous tissue under direct high-power microscopic visualization. The cells of interest are transferred to a polymer film that is activated by laser pulses. The exact morphology of the procured cells (with intact DNA, RNA, and proteins) is retained and held on the transfer film. Direct visualization of the captured cells, with their histology intact, ensures that the correct population of cells is obtained.
In the present report we examine the sensitivity and precision of a complete procedure for conducting quantitative prostate-specific antigen (PSA) immunoassay 6 of stained human prostate tissue cells selected and procured by LCM. PSA was chosen as the analyte prototype for technology development because of its importance as a prostate marker and the known cellular heterogeneity of expression of PSA by prostate immunohistochemistry. 2 Precision analysis was conducted for different numbers of laser shots. Comparisons of the number of PSA molecules per cell were made between different stages of prostate cancer progression in the same prostate and compared with PSA immunohistochemistry scoring.
Materials and Methods
Case Materials
Tissue was obtained following an Institutional Review Board-approved protocol from both the Urologic Oncology Branch of the National Cancer Institute (Bethesda, MD) and the Mayo Clinic (Rochester, MN). After surgery, the tissue samples were immediately flash frozen in liquid nitrogen. The tissue was then embedded in O.C.T. compound and stored at −80°C. Cases were selected based on the histology present in the tissue sections so that normal glands, prostate intraepithelial neoplasia (PIN), and adjacent carcinoma could be compared within the same patient. Prostate tissue cases were selected to include ample stroma to serve as a negative control. Lung tissue was used as a second negative control.
Sectioning and Staining
The O.C.T.-embedded tissue blocks were cut with a cryostat into 8-μm sections. After cutting, the sections were immediately placed on dry ice and stored at −80°C. Only one section was thawed and dissected at a time, to minimize degradation of proteins. Frozen sections on plain untreated glass slides were fixed with 70% ethanol for 10 seconds. After fixing, the slides were washed in deionized water; stained with Mayer’s hematoxylin for 30 seconds, followed by another water wash, bluing solution for 30 seconds, and a wash in 70% ethanol; and then stained with eosin for 90 seconds. The slide was then dehydrated with two 10-second washes in 95% ethanol and two 10-second washes with 100% ethanol. Finally, the slide was placed in xylene for 30 seconds.
Laser Capture Microdissection
The Arcturus PixCell II system incorporates an Olympus IX-50 microscope containing a microscope slide stage that is moved by a joystick. 4 The operator uses the joystick to position the tissue under a fixed laser beam that can be focused from a 7.5-μm to a 30-μm diameter. The LCM transfer film is fixed to the undersurface of a vial cap (CapSure TM TF-100 transfer film carrier, 5-mm-diameter optical-grade transparent plastic; the matching vial is Brinkmann no. 22 36 430-8). The LCM cell procurement time was always less than 15 minutes. A 5.0–10.0-μl droplet of the extraction buffer was applied to the surface of the film containing the selected cells for 1 minute. The cap with the droplet on its undersurface was then inserted in the mouth of the matching vial containing 45 μl of the immunoassay dilution buffer. The sealed vial sample receptacle was frozen at −20°C and stored for less than 48 hours before assay. The thawed sample was held at 4°C for no longer than 2.5 hours before introduction into the immunoassay module.
Extraction Buffer
Buffer A was 1/1000 dilution of the following stock: 50 mmol/L Tris-HCl, 1% NP-40, 0.1% Na deoxycholate,150 mmol/L NaCl, 4 mmol/L EDTA, aprotinin (10 mg/ml), leupeptin (10 mg/ml), 10 mmol/L Na pyrophosphate, 2 mmol/L Na orthovanate, and 100 mmol/L phenylmethylsulfonyl fluoride. Buffer B was “T-Per” tissue protein extraction liquid reagent (obtained from Pierce; catalog no. 78510). Buffer C was 10 mmol/L Tris-HCl (pH 7.4), 0.1% Triton X-100,1.5 mmol/L EDTA, 10% glycerol.
PSA Immunoassay: Microparticle Enzyme Immunoassay
PSA was measured by an automated two-site chemiluminescent assay, using the ultrasensitive PSA reagent kit on the Immulite immunoassay analyzer called the Immulite Third Generation PSA assay 6 (Diagnostic Products Corp., Los Angeles, CA). This assay is a solid-phase two-site sequential chemiluminescent immunometric assay. The solid phase, a polystyrene bead enclosed within a test vial, is coated with an antibody specific for PSA. The sample microdissected cell proteins solubilized in a buffer are introduced into the test unit and incubated for 30 minutes at 37°C. PSA in the sample binds to the surface of the bead. Unbound proteins are removed by washing. An alkaline phosphatase-labeled polyclonal goat anti-PSA antibody is introduced, and the test unit is incubated for another 30-minute cycle. After a further wash, the chemiluminescent substrate, a phosphate ester of adamantyl dioxetane, is introduced. The substrate undergoes hydrolysis, accompanied by the emission of light. The light is measured by a luminometer. Relative light units (RLUs) reflect the photons detected by the photomultiplier tube, which is proportional to the concentration of PSA in the sample.
Immunohistochemistry
Immunohistochemistry staining for PSA was conducted using an adaptation of the method as described by Fend et al. 7 The frozen sections were desiccated and then fixed in acetone. After washing with 3% goat serum, the primary antibody (Dako A562) was incubated for 1 hour at room temperature. Avidin/biotin was used to label the secondary antibody, and peroxidase/diaminobenzidine was used as the substrate.
Results
Tissue Cell Procurement
Figure 1 ▶ describes the steps of LCM cell procurement and protein solubilization. Figure 2 ▶ is an example of LCM cell procurement of prostate epithelial cells. The full staining characteristics of the procured cells are retained, allowing for the precise enumeration of the number of cells transferred to the polymer cap film. The yield of procured pure epithelial or carcinoma cells encompassed within a standard 30-μm shot and the precision of cellular procurement were tested by visually counting the number of cells removed from the tissue and transferred to the film.
Figure 1.

Extraction of proteins. Fixed, stained, microscopic tissue cells of interest are selected using LCM and transferred onto the area of the polymer surface activated by the laser beam. The captured cells are exposed to concentrated extraction buffer in a microvolume. The solubilized proteins are diluted in the immunoassay buffer and incubated with a solid-phase capture antibody specific for the analyte (Materials and Methods). Chemiluminescent detection is conducted with a labeled secondary antibody through a sandwich binding step.
Figure 2.

Visualization of LCM-procured cells. Laser capture microdissection (LCM) using the Arcturus Pixcell II was performed to selectively transfer only a portion of the epithelial lining of a prostate gland to the polymer film. H&E-stained prostate tissue: target region designated by arrow. A: Before LCM. B: Tissue after LCM; two shots. Note the vacancy left by the removal of selected cells. The bar represents 30 μm. C: Epithelial cells transferred to cap surface.
LCM Cell Yield Precision
Table 1 ▶ compares the number of laser shots with the average total number of microdissected cells for a series of example prostate cases. A standard laser spot diameter of 30 μm encompasses a mean number of five to seven cells. Individual tissue cells can vary in their packing density, their shape, and their volume. Consequently, the imprecision of the cell yield is greater with fewer laser shots. The SD for the number of cells procured by one shot was approximately 50% of the mean. In contrast, when 15, 25,or 100 shots were procured, the SD of cell yield was reduced progressively to less than 10% of the mean.
Table 1.
Laser Capture Microdissection Tissue Cell Procurement Recovery
| Prostate tissue cell type procured by LCM | No. of laser shots (30 μm diameter) procured per sample (n = no. of replicate samples per case) | Total cell no. procured per sample (mean ± SD) | Mean cell no. procured per laser shot |
|---|---|---|---|
| Case 121 | 1 shot | 6.78 ± 3.7 | 6.7 |
| carcinoma | (n = 10) | ||
| Case 121 | 15 shots | 102 ± 3.4 | 6.8 |
| carcinoma | (n = 10) | ||
| Case 130 | 100 shots | 506 ± 12 | 5.1 |
| epithelium | (n = 10) | ||
| Case 140 | 25 shots | 128.7 ± 12.8 | 5.1 |
| epithelium | (n = 10) | ||
| Case 140 | 50 shots | 284 ± 17.1 | 5.6 |
| epithelium | (n = 10) | ||
| Case 140 | 50 shots | 277 ± 17.9 | 5.5 |
| carcinoma | (n = 10) |
Prostate tissue was stained with H&E and dehydrated in xylene. The histological diagnosis of the pure cell population microdissected is shown in the first column. The number of laser shots comprising a sample and the number of replicate samples per case are listed in the second column. Cells captured on the transfer film were visually counted under ×200 magnification (third column). The mean cell number per shot is calculated by dividing the total number of cells procured in the sample by the number of shots comprising the sample.
Solubilization of Proteins from LCM-Procured Cells
After placement of a 5-μl microvolume of extraction buffer on the transfer surface containing the tissue cells, visual confirmation was obtained, establishing the complete solubilization of the stained cells. This took less than 1 minute. The transfer cap with the extracted cellular proteins was inserted into the mouth of a vial containing the immunoassay buffer. After analysis, the transfer caps were counterstained to ensure complete solubilization of the cells. The extraction buffer diluted in the assay buffer did not interfere with the immunoassay background level or linear calibration. Buffers A and B (described in Materials and Methods) were found to be highly suitable for solubilization and extraction of the PSA cytoplasmic protein from cells. Buffer C was determined to be suitable for membrane proteins. Her-2-Neu, a membrane-bound receptor, was solubilized in Buffer C from LCM-microdissected breast carcinoma cells and successfully measured using the Oncogene Science Diagnostics HER2/neu enzyme-linked immunosorbent assay (data not shown).
Calibration Curve
Negative tissues or zero controls produced a value of 80,000 to 140,000 RLUs, compared to PSA positive samples that ranged from 600,000 to 10,000,000 RLUs. The calibration curve used for measurement of PSA in serum according to the Immulite package insert was applied to the measurement of cellular tissue proteins procured by LCM. A specific calibration curve for LCM-procured samples was developed with the LCM-extracted cellular proteins in the buffer solution. As shown in Figure 3, A and B ▶ , the standard curve using spiked known concentrations of PSA showed a high degree of linearity (R2 = 0.98) over a wide dynamic range (0.002–10 ng/ml). A strong degree of linearity was also observed between the number of laser shots independently procured in a case sample and the number of PSA molecules assayed (Figure 3C ▶ and Table 2 ▶ ). A parallel study was conducted on nine microdissected case samples. A representative example series is shown in Table 3 ▶ . The assay was conducted in duplicate on both undiluted and diluted (10 serial) samples, and the observed and expected values were compared. For all nine case samples the linear correlation between the observed and the expected values was greater than R 2 = 0.95. Thus the LCM-Immulite PSA immunoassay maintains good linearity over the calibration range.
Figure 3.
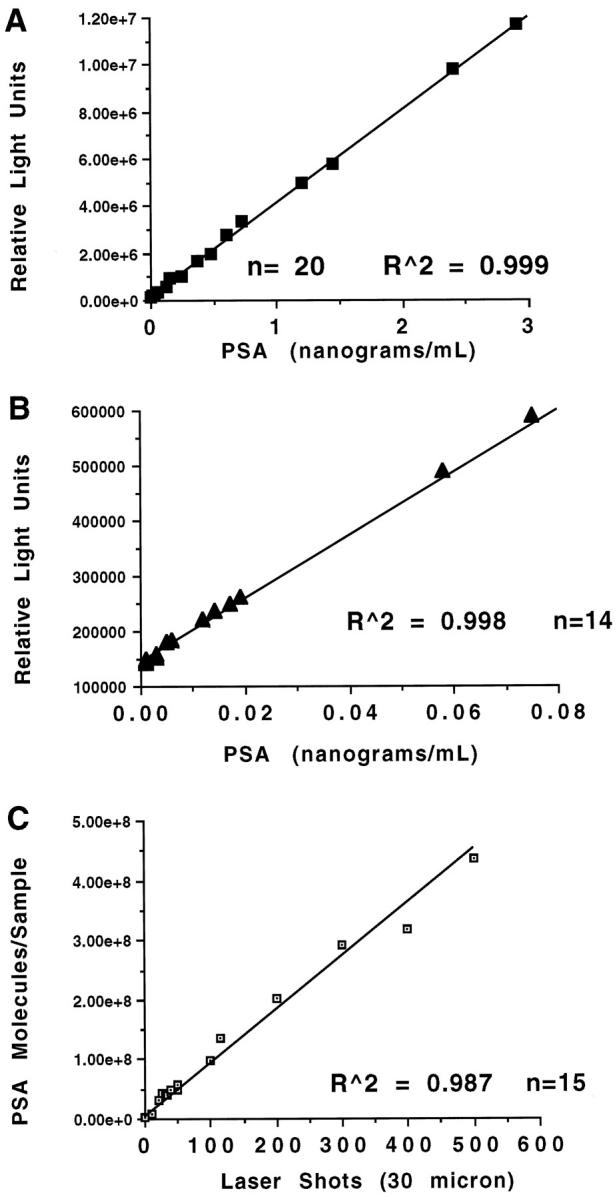
Standard curve and LCM shot linearity analysis. A: Standard curve using spiked known concentrations of PSA over the high concentration range. B: Standard curve using spiked known concentrations of PSA over the low concentration range. C: Case linearity. Individual samples of the designated number of LCM shots were independently procured from the same case. The concentration of PSA molecules assayed per sample was linearly correlated with the number of shots. n = number of individual assays.
Table 2.
Sensitivity and Within-Run Precision Study Set: Effect of Sample Size
| Sample description | No. sample replicates | Mean PSA molecules per sample | CV% | Mean no. cells procured per sample (calculated mean PSA molecules/cell) |
|---|---|---|---|---|
| Prostate tumor 100 | 10 | 1.2 × 10⁸ | 3.9% | 721 |
| shots case 318 | (7,199,673 ± 330,464) | (1.7× 10⁵) | ||
| Prostate tumor 15 shots | 10 | 1.9× 10⁷ | 15.8% | 78 |
| case 318 | (1,178,202 ± 168,807) | (2.4× 10⁵) | ||
| Prostate tumor single-shot | 10 | 1.2× 10⁷ | 60.2% | 5.2 |
| case 318 | (804,416 ± 489,353) | (2.3× 10⁵) | ||
| Prostate tumor single-shot | 9 | 7.2 ×10⁶ | 74.6% | 7.4 |
| case 269 | (602,412 ± 451,809) | (0.97× 10⁵) | ||
| Buffer control | 10 | Negative | 3.5% | NA |
| (88,788 ± 2962) | ||||
| Lung 100 shots | 10 | 2.1× 10⁵ | 6.5% | NA |
| (134,413 ± 7840) | ||||
| Prostate stroma 100 shots | 6 | 2.0× 10⁵ | 5.2% | NA |
| (132,759 ± 7352) |
The number of 30-μm laser shots comprising the sample and the histologic diagnosis are given in the first column. The number of sample replicates per case is given in the second column. The total sample of microdissected cells was dispersed in 5 μl of extraction buffer, which was then diluted in 45 μl of assay buffer. The number of molecules of PSA per sample (third column) reflects the number of PSA antigen molecules present in the original 5-μl volume. The immunoassay relative light unit (RLU) assay value, which is proportional to the concentration of PSA according to the standard curve of Figure 3 ▶ , is shown in parentheses. This concentration of PSA is then converted to the number of molecules in the original sample. The number of cells microdissected, comprising the sample, is calculated by multiplying the average number of cells procured per shot (Table 1) ▶ by the number of shots. The number of molecules per cell (fourth column) is calculated by dividing the total PSA molecules in the sample by the number of cells comprising the sample.
Table 3.
Example Parallelism Study
| Sample dilution 500 shots solubilized in 5 μl | Observed PSA (ng/ml) | Expected | Ratio: observed/expected |
|---|---|---|---|
| 1024 in 1024 case 611 | 1.71 | — | — |
| 512 in 1024 | 0.848 | 0.855 | 0.99 |
| 256 in 1024 | 0.429 | 0.427 | 1.004 |
| 128 in 1024 | 0.188 | 0.213 | 0.882 |
| 64 in 1024 | 0.099 | 0.10 | 0.96 |
| 32 in 1024 | 0.048 | 0.05 | 0.96 |
| 16 in 1024 | 0.023 | 0.025 | 0.92 |
| 8 in 1024 | 0.0096 | 0.012 | 0.80 |
| 4 in 1024 | 0.0056 | 0.006 | 0.93 |
| 2 in 1024 | 0.0023 | 0.003 | 0.76 |
| 1 in 1024 | <0.002 | 0.001 | — |
One of nine cases is shown to illustrate a dilution series. Five hundred shots of LCM prostate carcinoma were solubilized in 5 μl of extraction buffer. The total volume of extraction buffer was diluted in 45 μl of assay buffer. The concentration of PSA (ng/ml) (observed mean of duplicates) in the 50 μl of assay volume was then calculated using the standard curve shown in Figure 3, A and B ▶ .
Sensitivity
The detection limit of the assay, defined as the concentration two standard deviations above the signal response of a tissue extraction sample free of PSA (zero dose) (Table 2) ▶ , was found to be 0.002 ng/ml. The “functional sensitivity,” defined as the lowest concentration measured with an interassay CV of 20%, was 0.005 ng/ml of PSA, or approximately 4.5 × 10 6 molecules of PSA per assay, using an extraction buffer microvolume of 5 μl. Depending on the relative concentration of PSA expressed in the tissue cells microdissected, in some cases the number of PSA molecules encompassed in an individual shot (average of five to seven cells per shot) was above the detection limit threshold.
Within-Run Precision
The LCM-Immulite assay precision is shown in Table 1 ▶ and Figure 4 ▶ . In keeping with the assumed biological heterogeneity, one laser shot exhibits a PSA measurement CV of 60.2% (n = 10), even though the mean magnitude of the signal (804,416 RLUs) is substantially greater than the mean value for 100 combined shots of background tissue (132,759). Thus, capturing 15 (analytical sensitivity threshold) to 100 laser shots of a tissue sample (this takes less than 5 minutes) provides an acceptable level of precision for a routine assay. A time course study determined (in the absence of protease inhibitors) that tissue proteins retained immunoreactivity for a total microdissection time of at least 30 minutes (data not shown).
Figure 4.

Case study set. N = normal prostate epithelium, T = prostate carcinoma. Ten individual within-run replicate immunoassays were performed per case for 20 separate cases. Ten replicate samples of 50 shots were individually procured from each case. The microdissected cells were solubilized in 5 μm and then diluted up to 50 μm in assay buffer. The results are expressed in mean ± SD of the number of PSA molecules per LCM microdissected cell.
Reproducibility
Twenty cases were randomly chosen to include 10 normal and 10 tumor cases. Based on the results of the precision studies (Tables 1 and 2) ▶ ▶ , a sample of 50 shots or greater has acceptable precision but retains adequate cellular purity. Therefore, 10 replicates of 50 shots were completed for each case. The average number of PSA molecules per cell per sample and the SD of 10 within-run replicates are plotted in Figure 4 ▶ . All 10 normal (epithelium) cases exhibited a PSA concentration per cell of less than 2,500,000 molecules. The SD (10 replicates of 50 shots) of every case (for both normal and cancer cases) was approximately 10% of the mean or less. In contrast, the range of values for the cancer cases was up to sevenfold higher than the normal cases, whereas the average of all of the invasive carcinoma cases was 2,854,141 molecules. Nevertheless some tumor cases had values within or below the mean value for the normal cases. This finding validates at a molecular level, in tissue, the expected biological heterogeneity and the phenotypic instability of carcinoma cells compared to their normal counterparts.
Correlation with Tissue Immunohistochemistry
Analysis using LCM coupled with PSA immunoassays for PSA was conducted on prostate tissue sections that contained normal epithelium, carcinoma, and prostate intraepithelial neoplasia (PIN). Based on the precision analysis described above, the number of laser shots was 100. For each specimen studied, a dilution series such as that shown in Table 3 ▶ , corresponding to a series of different numbers of laser shots, was prepared. This verified that conclusions based on 100 shots remained in the linear portion of the curve (Figure 3) ▶ . Immunohistochemistry for PSA was conducted 6 on adjacent sections. The PSA immunoreactivity of cellular populations identical to those sampled by LCM on matched coded sections was scored independently and ranked on a scale of 0 to 3+ (Table 4) ▶ . The average number of PSA molecules measured per cell ranged from 10 4 to 106. The immunohistochemistry scoring values paralleled the quantitation and mirrored the heterogeneity in PSA production by normal and neoplastic cell populations. Case C is an example in which the normal epithelium contained an unusually high level of PSA molecules (6.3 × 10⁶) and was scored 3+ by immunohistochemistry. In contrast, the PIN cells contained 3.7 × 10 5 molecules and was scored 2+, and the tumor cells contained 1.99 × 10 4 and stained 1+, all in the same case (case C).
Table 4.
Immunohistochemistry Comparison
| Case designation: prostate histological diagnosis | Molecules of PSA/cell mean per 100 shots immunoassay results | PSA immunohistochemistry pathologist’s score |
|---|---|---|
| Case A: normal | 6.66 × 10⁴ | + |
| Case A: tumor Gleason 4a | 3.4 × 10⁶ | +++ |
| Case B: normal | 1.04 × 10⁵ | ++ |
| Case B: PIN | 4.25 × 10⁵ | ++ |
| Case B: tumor Gleason 3a | 9.52 × 10⁴ | + |
| Case C: normal | 6.3 × 10⁶ | +++ |
| Case C: PIN | 3.70 × 10⁵ | ++ |
| Case C: tumor Gleason 2 | 1.99 × 10⁴ | + |
Immunohistochemistry staining of human prostate tissue sections for PSA was compared with the results of the soluble immunoassay (Tables 1–3 ▶ ▶ ▶ and Figures 3 and 4 ▶ ▶ ) for the same prostate tissue section. Independent immunohistochemical scoring of coded specimens by the pathologist was graded as high (+++), medium (++), or low (+). PIN, Prostate intraepithelial neoplasia. Tumor, Carcinoma Gleason grade designated. Normal, Histologically normal epithelium from glands distant from the tumor in the same section. The relative concentration of measured PSA molecules per cell in a sample of 100 laser shots corresponds to the semiquantitative scoring.
Discussion
As the field of proteomics moves from cell lines to the analysis of specific cell populations in tissue, new technology will be required to sample and measure tissue macromolecules. Modern soluble immunoassay methods employing chemiluminescence or fluorescence can achieve a level of sensitivity in the attomolar range. 8 In principle, such sensitivity is sufficient for the measurement of moderate- or even low-abundance proteins extracted from tissue cells. Nevertheless, two problems have previously hindered the application of soluble immunoassays to tissue. 9 The first is tissue microscopic cellular heterogeneity, and the second is extraction and preservation of intact proteins from stained tissue subpopulations. Simply grinding up the tissue and extracting the proteins does not produce a representative sample because the cellular population of interest may constitute a small minority of the total cells in the tissue. The tissue cells of interest are often part of complicated morphological structures that can only be correctly identified under high-power magnification. Moreover, the cells targeted for analysis can be surrounded by contaminating cells and scattered in multiple locations within a minute microscopic tissue field. Sectioning, fixing, and staining the tissue may modify the function and antigenicity of macromolecules. Finally, methods for extracting the proteins from the tissue section should maximize the yield of proteins while having no effect on the immunochemistry analysis.
Previous methods for extracting and analyzing protein macromolecules from tissue subpopulations have included UV laser ablation of unwanted tissue regions 10 and oil well isolation of tissue cells. 8 These methods were complicated and labor intensive, did not use protein stabilizers, and did not employ soluble immunoassays. The advent of LCM now provides a means of positively selecting the desired tissue cells, even if they are scattered or in a spatially complicated distribution. Moreover, the protein macromolecules of LCM-procured cells appear to be intact and retain their functional activity. 3 An important principle of the current methodology is exposure of the microdissected cells captured on the transfer surface to a microvolume of extraction buffer. The extracted molecules are directly diluted in the immunoassay buffer. In this way the microdissected cells are exposed to adequate local concentrations of detergents and other extraction chemistries that may interfere with antibody binding reactions. After dilution in the assay buffer, the extraction chemistry has no discernible residual effect on the immunoassay performance. The procurement and extraction procedure used in the present report did not alter the tissue cellular proteins in relative abundance, molecular weight, or charge, as judged by 2-D gel electrophoresis of proteins extracted from frozen sections compared before and after LCM procurement and staining of 7500 shots (data not shown). 2-D gel analysis of microdissected prostate tissue cells revealed PSA to be of low to moderate abundance compared to other cellular proteins. The current study was performed using frozen tissue stained with H&E. Fixed tissue embedded in paraffin is superior to frozen sections at the level of microscopic histomorphological details. Formalin fixation may produce cross-links that hamper protein extraction. In contrast, we have found that ethanol-fixed, 7 paraffin-embedded tissue retains morphological details and preserves PSA immunoreactivity after microvolume extraction.
The present technology provides one of the first direct estimates of the actual number of protein molecules per tissue cell in vivo, for a single specific known protein of moderate to low abundance. The number of total PSA molecules in normal prostate epithelium ranged from 10 4 to 10 6 per cell. PSA is an important serum analyte used to clinically monitor prostate cancer, but it is not a specific marker of prostate cancer. 11 Previous investigators have reported great heterogeneity in the intensity of PSA immunohistochemical staining among various neoplastic and nonneoplastic populations in the prostate. 2,12-16 Populations of microdissected cells of a pure histological class (normal epithelium, PIN, or invasive cancer) would be expected to contain some level of heterogeneity in PSA expression among the population members. Sources of imprecision and assay variability should therefore include the following components: 1) precision in the number of cells captured per sample, 2) normal biological variation in the production of PSA by different cells from the same tissue and the position of the cells in the plane of the tissue section, 2,12-16 and 3) imprecision in the immunoassay itself. Comparing the precision of cell capture (Table 1) ▶ with the variability of PSA quantity measured (Table 2) ▶ , the percentage coefficient of variation (CV n = 10) declines with increasing number of laser shots per sample. Acceptable precision can be obtained with a sample of 50–100 laser shots. This number of shots takes less than 5 minutes of operator time.
PSA immunolocalization in carcinoma cells is known to be increased or decreased in intensity compared with normal epithelium in the same prostate. Tissue cells positive for cytoplasmic PSA immunoreactivity contain antigen-positive material in the endoplasmic reticulum and secretory vesicles by immunoelectron microscopy and express PSA mRNA by in situ hybridization. Application of the new technology described in the present report (Table 4) ▶ provides quantitative confirmation of the heterogeneity in PSA expression that was previously detected only by qualitative staining. The average numbers of PSA molecules harvested per cell ranged over several logs. An immunohistochemical staining difference could be discriminated within a five- to 10-fold difference in PSA molecule number per cell. The level of variability in PSA molecules per case is further validated by the replicates of normal and invasive carcinoma cases shown in Figure 4 ▶ . Here the normal cases were relatively homogeneous in the level of PSA expression, whereas the tumor cases varied considerably.
In conclusion, the combination of LCM with high sensitivity chemiluminescence immunoassay chemistry provides a protein quantitation technology that can be applied to the measurement of proteins in microscopic pure populations of stained tissue cells. The speed, sensitivity, and linearity of the assay are acceptable for routine use, even considering the expected biological heterogeneity of histologically similar cell types. LCM immunoassays can thereby supplement or complement immunohistochemistry. Several extraction buffers were found to be suitable for cytoplasmic or membrane proteins (Materials and Methods). In addition to PSA, described here, the technology has been successfully been applied to the measurement of HER-2/neu assays (data not shown). Moreover, solubilized proteins can be analyzed by nonimmunological means (eg, enzymatic activity). With the application of microfluidics, and the multiplexing of assays, it is foreseeable that entire panels of quantitative protein assays can be performed on microscopic regions of pure tissue cells. This will provide the closest possible snapshot of the in vivo state of the protein pathways in developing, diseased, or genetically altered tissue.
Footnotes
Address reprint requests to Dr. Lance A. Liotta, Laboratory of Pathology, National Cancer Institute, NIH, 9000 Rockville Pike, Bethesda, MD 20892. E-mail: lance@helix.nih.gov.
References
- 1.Humphrey-Smith I, Cordwell SJ, Blackstock WP: Tissue-specific variation of pea mitochondrial polypeptides detected by computerized image analysis of two-dimensional electrophoresis gels. Electrophoresis 1997, 18:1217-1242 [DOI] [PubMed] [Google Scholar]
- 2.Epstein JI, Eggleston JC: Immunohistochemical localization of prostate-specific acid phosphatase and prostate-specific antigen in stage A2 adenocarcinoma of the prostate: prognostic implications. Hum Pathol 1984, 15:853-859 [DOI] [PubMed] [Google Scholar]
- 3.Emmert-Buck MR, Bonner RF, Smith PD, Chuaqui RF, Zhuang Z, Goldstein SR, Weiss RA, Liotta LA: Laser capture microdissection. Science 1996, 274:998-1001 [DOI] [PubMed] [Google Scholar]
- 4.Bonner RF, Emmert-Buck MR, Cole KA, Pohida T, Chuaqui R, Goldstein S, Liotta LA: Laser capture microdissection: molecular analysis of tissue. Science 1997, 278:1481-1483 [DOI] [PubMed] [Google Scholar]
- 5.Simone NL, Bonner RF, Gillespie JW, Emmert-Buck MR, Liotta LA: Laser-capture microdissection: opeing the microscopic frontier to molecular analysis. Trends Genet 1998, 14:272-276 [DOI] [PubMed] [Google Scholar]
- 6.Ferguson RA, Yu H, Kalyvas M, Zammit S, Diamandis EP: Ultrasensitive detection of prostate-specific antigen by a time-resolved immunofluorometric assay and the immulite immunochemiluminescent third-generation assay: potential applications in prostate and breast cancers. Clin Chem 1996, 42:675-684 [PubMed] [Google Scholar]
- 7.Fend F, Emmert-Buck MR, Chuaqui R, Cole KA, Lee J, Liotta LA, Raffeld M: Immuno-LCM: laser capture microdissection of immunostained frozen sections for mRNA analysis. Am J Pathol 1999, 154:61-66 [DOI] [PMC free article] [PubMed] [Google Scholar]
- 8.Yu H, Diamandis EP: Ultrasensitive time-resolved immunofluorometric assay of prostate-specific antigen in serum and preliminary clinical studies. Clin Chem 1993, 39:2108-2114 [PubMed] [Google Scholar]
- 9.Matschinsky FM, Passonneau JV, Lowry OH: Quantitative histochemical analysis of glycolytic intermediates and cofactors with an oil well technique. J Histochem Cytochem 1967, 16:29-39 [DOI] [PubMed] [Google Scholar]
- 10.Meier-Ruge W, Bielser W, Remy E, Hillenkamp F, Nitsche R, Unsold R: The laser in the Lowry technique for microdissection of freeze-dried tissue slices. Histochem J 1976, 8:387-401 [DOI] [PubMed] [Google Scholar]
- 11.Zarghami N, Levesque M, DíCosta M, Angelopoulou K, Diamandis EP: Frequency of expression of prostate-specific antigen mRNA in lung tumors. Am J Clin Pathol 1997, 108:184-190 [DOI] [PubMed] [Google Scholar]
- 12.Stamey TA, Graves HCB, Wehner N, Ferrari M, Freiha FS: Early detection of residual prostate cancer after radical prostatectomy by an ultrasensitive assay for prostate specific antigen. J Urol 1993, 149:787-792 [DOI] [PubMed] [Google Scholar]
- 13.Sinha AA, Wilson MJ, Gleason DF: Immunoelectron microscopic localization of prostatic-specific antigen in human prostate by the protein A-gold complex. Cancer 1987, 60:1288-1293 [DOI] [PubMed] [Google Scholar]
- 14.Qiu S, Young CYF, Bilhartz DL, Prescott JL, Farrow GM, He WW, Tindall DJ: In situ hybridization of prostate-specific antigen mRNA in human prostate. J Urol 1990, 144:1550-1555 [DOI] [PubMed] [Google Scholar]
- 15.Purnell DM, Heatfield BM, Trump BF: Immunocytochemical evaluation of human prostatic carcinomas for carcinoembryonic antigen, nonspecific cross-reacting antigen, β-chorionic gonadotrophin, and prostate-specific antigen. Cancer Res 1984, 44:285-292 [PubMed] [Google Scholar]
- 16.Kuriyama M, Wang MC, Papsidero L, Killian CS, Shimano T, Valenzuela L, Nishiura T, Murphy GP, Chu TM: Quantitation of prostate-specific antigen in serum by a sensitive enzyme immunoassay. Cancer Res 1980, 40:4568-4662 [PubMed] [Google Scholar]