

Abstract
Gene amplification is one of the most important mechanisms leading to deregulated gene expression in cancer. The exact quantitative detection of this frequent genomic alteration in solid tumors is often hampered by an admixture of nonneoplastic bystander and stroma cells. To overcome this obstacle and to develop an objective quantitative method we have combined laser-assisted microdissection of tumor cells with the novel 5′-exonuclease-based real-time polymerase chain reaction (PCR) assay. The latter method enables the highly reproducible exact quantification of minute amounts of nucleic acids. As a model system amplification of c-erbB2/Her-2/neu gene and the adjacent topoisomerase IIα gene was determined in paraffin-embedded breast cancer specimens (n = 23) after immunohistochemical labeling and laser-based microdissection of tumor cells. The high sensitivity of real-time PCR enabled the reliable and objective detection of low-level amplifications in as few as 50 cells from archival tissue sections. Low-level amplifications were shown to escape from detection unless tumor cells were isolated by microdissection. In selected cases intratumor heterogeneity was demonstrated using areas of ∼50 to 100 cells. This novel approach combining immunohistochemistry, laser microdissection, and quantitative kinetic PCR allows morphology-guided studies in archival tissue specimens and will enable the exact quantification of gene copy numbers in even small and precancerous lesions.
Aberrant gene expression is the hallmark of transformed cells. Increase of the dosage of cellular oncogenes by DNA amplification is a frequent genetic alteration causing deregulated protein expression. A variety of human cancers carry specifically amplified oncogenes with a high copy number. 1,2 The magnitude of amplification was found to correlate in different tumors with aggressive potential and proliferative activity. 3-8 In breast cancer, amplification and deletion are the most common mechanisms leading to gene deregulation. 9 In addition to well-established oncogenes like c-myc, cyclinD1, or c-erbB2, a wide variety of loci are amplified. Until now amplification of at least 22 different genes distributed on 9 chromosomes have been reported in breast cancer. 1,10-17 Yet the significance of most of these findings has to be established using standardized detection methodologies. Also, for the intensively studied c-erbB2 oncogene different levels of amplification and percentages of amplified tumors have been published, depending on the patient cohort under investigation, the histological subtype analyzed, and the methodology used. 9,18-20
The contradictory results may be in part attributable to different and only insufficiently standardized methodologies and varying scoring systems. Most of the studies using Southern blot or polymerase chain reaction (PCR) to detect gene amplification analyzed crude tumor tissues contaminated by nonneoplastic cells that may distort amplification data. This distortion is especially important in the study of small and precancerous lesions that may show lower levels of gene amplification and are by far outnumbered by contaminating bystander cells. Major limitations faced by studies using alternatively in situ methods such as fluorescence in situ hybridization are the unsatisfying preservation of histological details and the difficulties in the reproducible detection and objective scoring of low levels of amplification (less than fivefold).
In in this study we used the recently introduced technique of laser-based microdissection to obtain pure tumor cell populations from formalin-fixed paraffin-embedded histological sections which were further analyzed by quantitative real-time PCR for objective and reliable quantification of even small amplifications. Under microscopic control exact separation of tumor cell complexes from surrounding stroma cells and contact-free isolation of these cells is possible. 21 The novel real-time PCR technology which utilizes the 5′exonuclease activity of the Taq polymerase in combination with a fluorescent hybridization probe indicating PCR product accumulation offers the advantage of a very sensitive exact quantification of minute amounts of nucleic acids. 22,23
As a model system we have analyzed amplification of the c-erbB2 gene, coding for an epidermal growth factor receptor-related protein 24,25 and for the adjacent topoisomerase IIα gene 26,27 in archival breast cancer specimens. In breast cancer, c-erbB2 amplification is a frequent event reported to be of prognostic significance. 19,20 A close correlation between the level of c-erbB2 gene amplification and protein expression has been demonstrated in several studies. 20,28-30
In this study we demonstrate that the combination of laser-based microdissection and real-time PCR allows the assessment of quantitative alteration of gene dosages in microscopically selected and immunohistochemically labeled pure tumor cells derived from archival paraffin-embedded tissue samples.
Materials and Methods
Cell Lines and Tumor Cell Samples
The breast cancer cell lines MCF-7, MDA-MB-231, MDA-MB-361, and T47D were obtained from ATTC and cultured according to the protocols supplied. Tumor tissue samples were obtained from the archive of the Institute of Pathology of the Hannover Medical School and the collection of frozen tumor specimens of the Hannover Medical School.
For control and optimization of the PCR assays high-molecular weight DNA was isolated from blood (after informed consent by healthy volunteers) using the QiaAmp blood kit from Quiagen (Hilden, Germany). Frozen biopsies and cultured cells were lysed overnight at 56°C in proteinase K digestion buffer (50 mmol/L Tris, pH 8.1; 1 mmol/L ethylenediaminetetraacetic acid; 0.5% Tween 20; 200 μg/ml proteinase K) and DNA was recovered by ethanol precipitation after extensive organic extractions.
Immunohistochemistry
In sections determined for microdissection the expression of the ErbB2 protein was detected with the polyclonal rabbit anti-human antiserum from DAKO (Golstrüp, Denmark). The primary antibodies were visualized using the SuperSensitive alkaline phosphatase-detection kit from Biogenex (San Ramon, CA) with Fast Red as a substrate according to the instructions of the manufacture. Topoisomerase IIα protein expression was monitored by staining with the monoclonal antibody Ki-S1 31 directed against a carboxy-terminal epitope of Topoisomerase IIα. 32 For the diagnostically relevant scoring of the ErbB2 protein expression in serial sections the Herceptin assay (DAKO) was used.
Microdissection
For microdissection of frozen or formalin-fixed tissue sections we used the PALM Laser-MicroBeam System (P.A.L.M., Wolfratshausen, Germany) which enables the contact-free isolation of single cells or groups of cells (see Figure 7 ▶ ). The sections were mounted onto a polyethylene foil according to the manufacture’s instructions. Frozen sections were fixed with ethanol immediately after cutting in a cryostat. Formalin-fixed sections were rehydrated following standard protocols. After immunohistochemical labeling of cells the sections were counterstained for 2 minutes in hematoxylin, fixed in 100% ethanol, and air-dried. The microdissected cells were catapulted into the lid of a 0.5-ml reaction tube using the laser pressure catapulting technique of the instrument. For isolation of the DNA 30 μl of proteinase K-digestion buffer (50 mmol/L Tris, pH 8.1; 1 mmol/L ethylenediaminetetraacetic acid; 0.5% Tween 20; 10 μg/ml proteinase K) were applied into the lid. Subsequently the tubes were closed in this inverted position and incubated overnight in a hybridization oven at 40°C. For inactivation of proteinase K the samples were centrifuged and incubated at 95°C for 10 minutes in a thermoblock with heated lid. An aliquot of this lysate was used for subsequent PCR analysis.
Figure 7.

Microdissection and isolation of intraductal carcinoma cells. A: Ductal-invasive breast carcinoma. Immunohistochemical detection of ErbB2 protein overexpression in the intraductal component. B: Intraductal tumor cells are dissected by the UV laser microbeam. C: Isolated intraductal component in the lid of a reaction tube. D: Section after removal of intraductal component A–D: hematoxylin counterstain; orginal magnifications, × 400.
PCR, Probes, and Primers
In this study the quantitative real-time PCR technique based on the 5′ exonuclease activity of the Taq polymerase was used. 33 In addition to the sense and antisense primer, a nonextendable oligonucleotide probe with a 5′ fluorescent reporter dye (6FAM) and a 3′ quencher dye (TAMRA) hybridizes downstream of the sense primer to the target sequence (see Figure 1 ▶ ). 34 During the extension phase the Taq polymerase hydrolyzes this probe thereby generating a fluorescence signal which is directly proportional to the amount of PCR product synthesized. This fluorescence signal is monitored on-line using the laser detector of the ABI Prism 7700 Sequence Detection System (PE Applied Biosystems, Weiterstadt, Germany).
Figure 1.

Principal of the real-time PCR. A: The double-labeled probe anneals in between the primers. The 3′-attached dye (TAMRA) quenches the fluorescent signal emitted from the 5′-attached dye (FAM) if both chromophores are in close proximity. No fluorescence is detectable. B: The Taq polymerase extends the primer and hydrolyzes the probe. Release of the 5′-attached dye abolishes the quenching effect of the 3′-attached dye. A fluorescence signal is detected. C: Completion of the synthesis of both new strands.
The PCR amplification was performed using a 96-well tray and optical caps (PE Applied Biosystems) with a 40-μl final reaction mixture containing 250 nmol/L each primer, 150 nmol/L probe, 1 unit of AmpliTaq Gold, 200 μmol/L each of dATP, dCTP, dTTP, and dGTP in 1× TaqMan buffer A. The magnesium-ion concentration for each primer pair is listed below together with the primer sequences. The reaction mixture was preheated at 95°C for 10 minutes, followed by 40 cycles at 95°C for 15 seconds and 60°C for 1 minute.
The primer and probe sequences and the magnesium concentration are as follows (in all cases, the first oligonucleotide is the forward PCR primer, the second one is the TaqMan probe, and the third one is the reverse PCR primer): 1) c-erbB2, 5′-AGCCTCTGCATTTAGGGATTCTC, 6FAM5′-TGAGAACGGCTGCAGGCAACCC-3′TAMRA, and 5′-CTAGCGCCGGGACGC (4.5 mmol/L MgCl2); 2) topo IIα, 5′-GCCAGAATCTGTTCGCTTCAAC, 6FAM5′-AAGCAGCCAGGCTGCCTGTCCAG-3′TAMRA, and 5′-AGGAAACTGAGTGCCGGCTT (5 mmol/L MgCl2); 3) app, 5′-TCAGGTTGACGCCGCTGT, 6FAM5′-ACCCCAGAGGAGCGCCACCTG-3′TAMRA, and TTCGTAGCCGTTCTGCTGC (3.5 mmol/L MgCl2); 4) dck, 5′-GCCGCCACAAGACTAAGGAAT, 6FAM5′-AGCTGCCCGTCTTTCTCAGCCAGC-3′TAMRA, and CGATGTTCCCTTCGATGGAG (6 mmol/L MgCl2).
All PCR reagents, including the primers and fluorescent dye-labeled probes, were obtained from PE Applied Biosystems (Weiterstadt, Germany). To avoid any contamination of the preparation and staining of the tissue sections, the microdissection and the PCR set-up were performed in a separate laboratory under sterile conditions. In every run three negative controls for each probe were included to exclude false-positive results.
Evaluation of Real-Time PCR Results
Initial template concentration was derived from the cycle number at which the fluorescent signal crossed a threshold in the exponential phase of the polymerase chain reaction (CT-value, see Figure 2 ▶ ). The relative gene copy number was determined based on the threshold cycles of the gene of interest and of two internal reference genes. For calculation of gene amplifications in tumor tissue this relative value (CT-value [target gene] minus CT-value [reference gene]) is compared with the same value for adjacent normal tissue from the very same tissue section (Figure 3) ▶ .
Figure 2.

Definition of the CT-value. During the first cycles the fluorescent signal emitted by the release of the 5′-attached dye is too weak to be detected. Only background fluorescence is measured. From this background signal a threshold of detection is calculated (mean fluorescent signal during the first 15 cycles plus 10 times the SD). The CT value is that time point during the PCR process at which the signal generated because of probe hydrolysis crosses this threshold.
Figure 3.

Illustration of the internal relative calibration method. A: A gene amplification causes a lower CT value (more template), shifting the amplification plot to the left (level of amplification: 4.4 ± 0.6). B: A deletion causes a higher CT value (less template), shifting the amplification plot to the right (level of amplification: 0.4 ± 0.1). Closed circles, reference gene; triangles, target gene euploid; open circle, target gene amplified; open squares, target gene deleted. (The amplification plot for the second reference gene is omitted for reasons of clarity.)
As reference, the two genes app (chr.4q11-q13) and dck (chr.21q21.2) were chosen from chromosomal regions for which no amplifications in breast cancer have been reported.
To eliminate all variabilities because of sample impurities and fixation artifacts from the measurement and calculation of the amplification factors we always compared microdissected tumor cells with normal tissue isolated from the same section (mostly stroma cells and fat tissue).
The amplification is expressed as gene copy number in tumor cells divided by gene copy number in euploid cells. That means a level of amplification of, eg, 5 indicates 10 copies of the c-erbB2 gene. The detection threshold was a reduction of the relative CT-value by one cycle corresponding to a level of amplification of 1.8 ± 0.1.
Results
Development of the Real-Time PCR Assay
In a first step we optimized reaction conditions for maximal efficiency (indicated by a low CT-value and a high fluorescence value in the plateau phase of the reaction). Performing magnesium ion titrations we found marked differences for the optimal reaction conditions for the four different primer/probe combinations stressing the importance of individual reaction condition optimization. Using highly purified DNA samples two to four copies (the equivalent of one or two normal euploid cells) of target gene could be reproducibly detected demonstrating the superior sensitivity of the real-time PCR technology.
As references the two genes app (amyloid precursor protein) and dck (deoxycytidine kinase) were used because Bieche and colleagues 35 have described the suitability of these chromosomal regions (chr. 4q11-q13 and chr. 21q21.2) as references for quantitative PCR experiments in a series of more than 100 tumor homogenates. The exact primer and probe sequences for detection of these two loci were designed in a completely different way to increase the efficiency of the amplifications and thereby the sensitivity of the assay. This was necessary for the application of this method to the analysis of paraffin-embedded microdissected tissue samples.
Determination of Amplification Status
After optimization of all PCR systems the gene copy numbers for the c-erbB2 and the topoisomerase IIα gene were measured in leukocyte DNA from healthy donors (n = 8), DNA from frozen normal control biopsies (n = 3), and DNA from cultured cell lines with known amplification status of the c-erbB2 and the topoisomerase IIα genes (MCF-7, MDA-MB-231, MDA-MB-361, T47D). 36,37 The constant numerical ratios of target genes and control genes for the samples without amplification were verified in all cases. For the cell line MDA-MB-361 the cytogenetically described amplification of the c-erbB2 gene and the deletion of the topoisomerase IIα gene was demonstrated.
Suitability of Paraffin-Embedded Specimens
From 23 formalin-fixed paraffin-embedded samples analyzed together, 21 were suitable for PCR analysis (91%) indicated by reproducible CT-values smaller than 38 cycles, a very small variation between the reactions performed in duplicates (coefficient of variation < 1%), high fluorescent signals in the plateau phase of the reaction (ΔRn > 0.5) and similar reaction efficiencies in all reactions (>1.8). In two cases the fluorescent signals generated during PCR amplification were so weak and variable that a reliable quantitation could not be performed. In five cases both cryosections and paraffin sections were available. Four out of five showed complete concordance, in one case only in the fresh frozen material a slight amplification near the detection threshold was demonstrated.
Among the cases tested for c-erbB2 amplification was one sample derived from a twenty-year-old paraffin-embedded tumor specimen displaying a moderate protein overexpression. A low level of amplification (twofold) was still demonstrable in this case (case 11).
Assessment of the Minimal Cell Number Required
To demonstrate the reliability of the relative quantification approach we diluted DNA with a known amplification status (isolated from cell lines MCF-7 and MDA-MB-361 with a cytogenetically determined amplification and from normal tissue) up to a concentration of approximately one cell per reaction and measured the relative amounts of target and reference genes. Down to cell numbers of five cells per reaction the ratios of all four genes to each other gene were constant (see Figure 4 ▶ ). This means that for the reliable quantification of the gene copy number of one target gene relative to two reference genes at least 15 cells have to be analyzed (or 30 cells for performing all reactions in duplicate). Dissecting formalin-fixed tissue sections the sensitivity was slightly lower requiring ∼50 cells for the reproducible quantification of gene amplifications.
Figure 4.

Demonstration that the relative CT-values and thereby the ratios of the gene copy numbers are constant in serial dilutions down to concentrations of ∼5 copies per reaction. Shown are the ratios of the c-erbB2 gene (black circles) and the topoisomerase IIa gene (open circles) to the app gene for the dilution of MCF-7 genomic DNA.
Requirement of Microdissection for Detection of Low-Level Amplifications
To find out how necessary microdissection is for a sensitive detection of low levels of amplification we analyzed, in parallel, several cases undissected and after microdissection (n = 5). For this purpose a whole section was analyzed in comparison to a microdissected sample from a serial section. In two cases with marked heterogeneous protein expression, a gene amplification was detectable only in the microdissected samples. In the remaining cases omission of microdissection drastically reduced the high level of amplification measured in the microdissected samples. To obtain more quantitative information we performed mixing experiments with microdissected samples from four cases. For this purpose a constant amount of microdissected tumor cells displaying low-level amplifications (two- to fivefold) was mixed with normal tissue from the same tissue section (primarily connective tissue and fat tissue). Afterward the relative gene copy numbers were determined and compared with the original undiluted samples. The results clearly indicate that the low-level c-erbB2 gene amplification was not any longer detectable if the tumor cells comprised <30% of the cells analyzed.
Real-Time PCR with Immunohistochemically Labeled Cells
Immunohistochemical labeling of cells before microdissection has two advantages: 1) the data of the molecular genetic analysis can be correlated directly with protein expression data; and 2) immunohistochemical labeling of cells can support and extend the morphology-based classification of cells (Figure 5) ▶ . It was therefore important to prove that staining with antibodies does not interfere with the quantitative real-time PCR. Careful analysis of amplification plots for several cases demonstrated that the efficiency of the amplification reactions was not altered and that identical changes in gene copy numbers were determined.
Figure 5.

Ductal-invasive breast carcinoma displaying heterogeneous Erb-B2 protein expression (case 9). A: H&E-stained section (×100); B: serial section immunohistochemically stained for ErbB2 protein expression (H&E counterstain, ×100). Arrow, intraductal component.
Amplification of the c-erbB2 Gene
From the 11 cases with immunohistochemically demonstrated Erb-B2 protein overexpression, 10 showed amplification of the c-erbB2/Her2/neu gene. The levels of amplification ranged from 3 to 10. One case with an overt gene amplification showed an expression pattern that was classified as incomplete (case 2, <10% of the cells show a complete staining of the membrane).
One case with a strong protein expression by the intraductal component and no detectable expression in the invasive component (see Figure 5 ▶ ) had a sevenfold amplification of the c-erbB2 gene in the intraductal tumor cells and no detectable amplification in the invasive growing tumor cells (Figure 6) ▶ .
Figure 6.
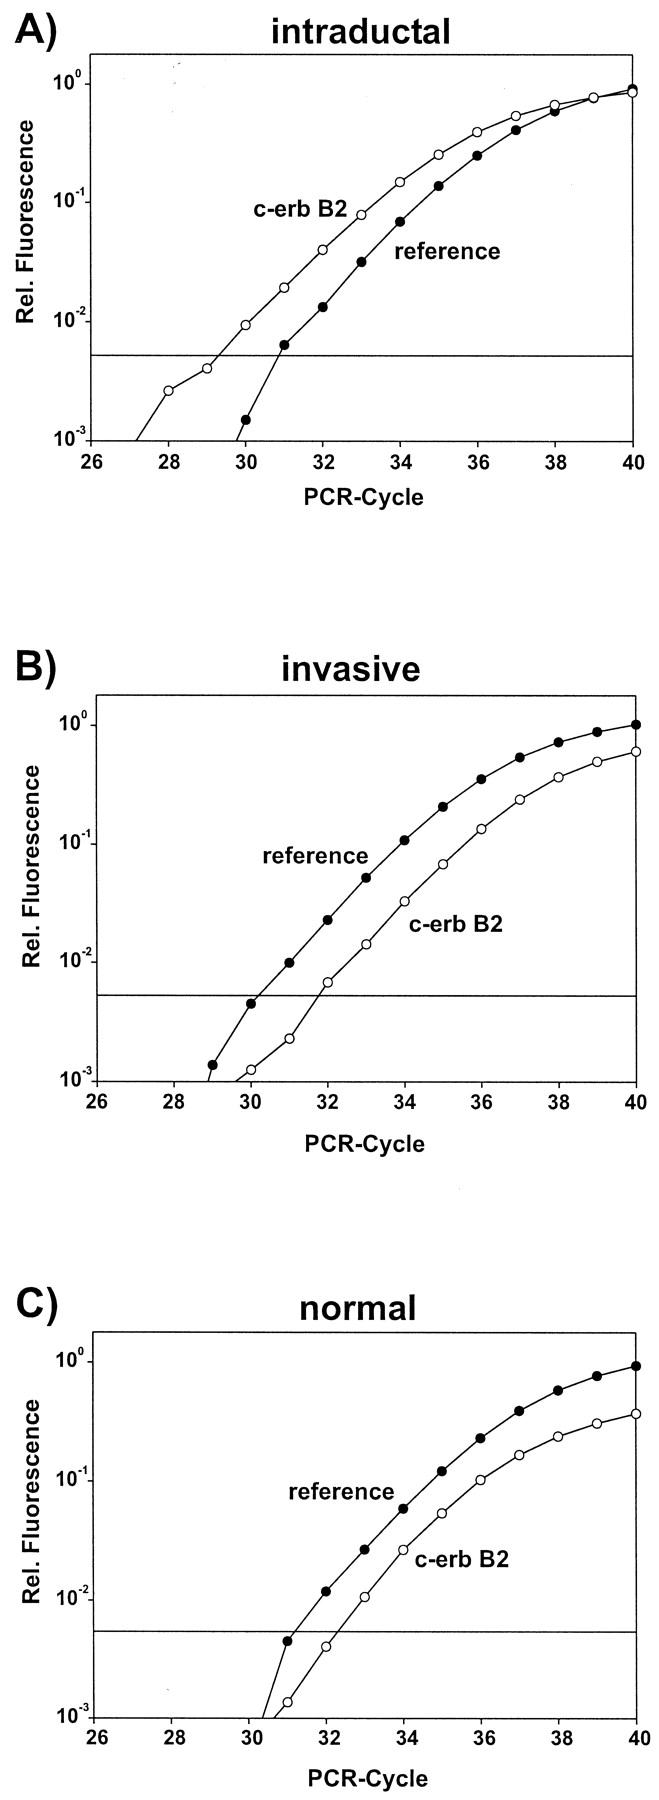
Amplification plots for case 9. A: Microdissected intraductal component with c-erbB2 gene amplification. Amplification plot is shifted to the left (lower CT value). B: Microdissected invasive component. Amplification plot not altered. C: Amplification plot for microdissected normal tissue. (In each plot the second reference gene is omitted for reasons of clarity.)
Amplification of the Topoisomerase IIα Gene
From the cases which had a c-erbB2 gene amplification 2 out of 11 showed a clear co-amplification of the topoisomerase IIα gene (amplification factor: twofold), 1 out of 12 showed a clear deletion of the topoisomerase IIα gene, 4 out of 12 showed at least a deletion of the topoisomerase IIα gene in a subset of tumor cells (deletion factor: 1.5 to 2). This means that 7 out of 11 (64%) of the tumors with a c-erbB2 amplification showed an alteration in the topoisomerase IIα gene.
The amplification data are summarized in Table 1 ▶ together with the histological diagnosis and the results of the immunohistochemical staining.
Table 1.
Results of Gene Amplification Measurements and Immunohistochemical Detection of Protein Expression
| No. | Histology | Gene amplification | Protein expression | ||
|---|---|---|---|---|---|
| c-erbB2 | topoIIα | Erb-B2 | TopoIIα | ||
| 1 | Lob, pT2 | 3 | — | 3+ | 5% |
| 2 | Duct, pT1c | 3.5 | 2 | 1+ | 80% |
| 3 | Duct, pT2-G3 | 4 | 0.75 | 3+ | 50% |
| 4 | Duct, pT3 | 4 | 2 | 3+ | 50% |
| 5 | Duct, pT1 mic-G3 | 5 | 0.75 | 3+ | 15% |
| 6 | Duct, pT1c-G2 | 6.5 | — | 2+ | 45% |
| 7 | Duct, pT3, | 5.5 | 0.5 | 3+ | 30% |
| 8 | Id, pT1a | 3 | 0.75 | 3+ | 10% |
| 9 | Duct, pT2 | 7/−* | −/−* | 3+/1+* | 40% |
| 10 | Duct, pT2 | 10 | 0.75 | 3+ | 15% |
| 11 | Duct,† | 2 | — | 2+ | 60% |
| 12 | Recurrence† | — | — | 0 | 40% |
| 13 | Duct, pT1c-G2 | — | — | 1+ | 70% |
| 14 | Duct, pT1c | — | — | 0 | 10% |
| 15 | Duct, pT1c-G2 | — | — | 1+ | 5% |
| 16 | Duct, pT1c-G2 | — | — | 1+ | 10% |
| 17 | Duct, pT2-G3 | — | — | 3+ | 80% |
| 18 | Duct, pT3 | — | — | 1+ | 20% |
| 19 | Lob, pT3 | — | — | 0 | 5% |
| 20 | Duct, pT1c | — | — | 1+ | 5% |
| 21 | Lob, pT4 | — | — | 0 | 70% |
Lob, lobular; Duct, invasive-ductal; Id, intraductal.
0, staining in less than 10%; 1+, complete membrane staining in less than 10%; 2+, weak complete membrane staining in more than 10%; 3+, strong complete membrane staining in more than 10%.
*Intraductal/invasive component.
†Original diagnosis with tumor grading not available.
Discussion
Alteration in gene copy number is one of the most important mechanisms leading to deregulated gene expression and neoplastic transformation. An exact quantitative analysis of this phenomenon during different stages of tumor development will contribute to our understanding of tumor evolution and progression. In addition there is a growing number of reports in the literature correlating gene copy numbers of certain loci with disease progression and response to therapy. 2,20
Investigations of the pathogenic or prognostic significance of gene amplifications require a reliable, sensitive, and objective method for the determination of gene copy numbers in tumor samples. The first established method for the detection of gene copy numbers and for a long time considered the most reliable method was Southern blotting. 36,38 The great disadvantage is the requirement of relatively large fresh frozen biopsies to obtain several micrograms of high molecular weight DNA. This excludes the analysis of small lesions and all formalin-fixed specimens. In addition correlation of gene amplification with morphology is not possible and the sensitivity is limited because of contamination by nontumor cells. In contrast to Southern blotting conventional quantitative PCR requires less material but it suffers also from some important disadvantages.
Conventional competitive and noncompetitive quantitative PCR assays require the analysis of a whole set of identical samples for a titration of the internal standard to quantitate the amount of target molecules in this sample. 39,40 For this reason the analysis of microdissected samples is not possible, because they cannot be divided further into a set of five to six identical samples to perform the necessary titration of the internal standard. In addition, the linear range of these assays is much smaller than that of the kinetic real-time PCR, requiring extensive pretesting of samples to approximately determine the amount of target molecules which is necessary for calibration of the internal standard. Again, this kind of pretesting is not possible for analyzing the minute amounts of nucleic acids from formalin-fixed microdissected samples displaying a considerable heterogeneity with regard to DNA content.
The only technology combining tissue morphology and quantitative molecular analysis up to now is fluorescence in situ hybridization. 41,42 This method is already widely used for the detection of c-erbB2 gene amplifications whereas immunohistochemistry reveals protein overexpression. 20 But it is still controversial which detection method should be preferred for the evaluation of the c-erbB2/Her-2/neu status of a tumor. 43 Especially small lesions (like atypical ductal hyperplasia and ductal carcinoma in situ) are difficult to study using fluorescence in situ hybridization. Besides the often poor preservation of morphological details after hybridization and the technical difficulties with reproducible quantification of hybridization signals (especially from low-level amplifications) the greatest limitation of the fluorescence in situ hybridization technique is the very restricted availability of standardized probes. The real-time PCR technology does not rely on long hybridization probes that are available only for a limited number of loci. There are also potentially important loci for which standardized manufactured hybridization probes suitable for analysis of paraffin-embedded biopsies are not at all available (eg, AIB-110, CDK413, PPABP17). Therefore, the flexibility and versatility of the primer and TaqMan probe design offers a clear advantage especially in the area of research which should not be restricted by the availability of hybridization probes. In principal for all loci in the human genome for which sequence information is available in data bases a new quantitative real-time PCR assay can be developed and validated within two weeks.
The laser-assisted microdissection allows the contact-free isolation of morphologically and immunohistochemically defined cells or groups of cells. 21 The superior quality of the morphology before and after microdissection is illustrated in Figure 7 ▶ . In addition it is demonstrated that immunohistochemically labeling of cells does not interfere with the quantitative PCR. This greatly increases the possibilities to characterize cells before microdissection supplementary to the morphology-based classification. It enables now also the systematic study of the relationship between altered protein expression and structural genomic alterations. The results of this amplification measurement are completely independent of varying and at least in part subjective scoring systems and can be directly correlated to the well-preserved tissue morphology. The direct comparison of undissected and microdissected samples from the same tumor and the mixing experiments (dilution of microdissected tumor cells in stroma cells) clearly proved the necessity of microdissection to analyze pure tumor cell populations devoid of any contaminating bystander cells. Analysis of one tumor with a heterogeneous protein expression pattern (Figure 5) ▶ demonstrated the utility of this new methodology. After microdissection, different levels of amplification could be measured in different tumor areas using the real-time PCR: a sevenfold amplification of the c-erbB2 gene in the intraductal tumor cells and no detectable amplification in the invasive growing tumor cells (see Figure 6 ▶ ). These findings are in agreement with earlier results that invasion selects probably against amplification of the c-erbB2 gene. 28,44 Using this new technique systematic studies of molecular alterations underlying heterogeneous protein expression in breast cancer specimens can be initiated.
The results concerning the co-amplification or deletion of the topoisomerase IIα gene in tumors displaying c-erbB2 gene amplification are in concordance with the findings of other groups using fluorescence in situ hybridization. 45 The frequency of topoisomerase IIα gene co-amplification detected by Southern blot is lower 46,47 most probably because of the reduced sensitivity of this technique. This lower sensitivity can prevent the detection of the frequent partial deletion in only a subset of tumor cells found in microdissected samples using quantitative real-time PCR.
The advantages of the real-time PCR methodology are the broad linear range (five to seven orders of magnitude), the speed and high throughput of the system (96 samples are analyzed in less than 2 hours), the elimination of all postamplification steps, the exclusion of all plateau effects at the end of the PCR reaction from the quantitative analysis and the superior sensitivity which comes close to the theoretical detection limit. The detection threshold for the analysis of one locus in this study was ∼50 cells from formalin-fixed paraffin-embedded tissue sections using two reference genes and performing all reactions in duplicate. In some well-preserved tissue specimens the detection threshold was even lower. It is of note that no pre-amplification of the samples before the quantitative analysis was necessary. Such a pre-amplification 48 can distort the subsequent quantitative analysis because of a slightly uneven amplification. Because the risk of contamination is a great problem working with minute amounts of starting material provided by laser-assisted microdissection the omission of all postamplification steps using this technique is a great advantage.
The real-time PCR technology is most often used for the absolute quantification of nucleic acids. 40 However, the absolute numerical quantification of gene copy numbers has some disadvantages: 1) preparation of exact quantitative standards is laborious and a serious source of errors; 2) stable storage of quantitative standards is very difficult to achieve; 3) amplification of several standards for generating a calibration curve for absolute quantification within each run is reducing the amount of samples which can be analyzed in each run thereby diminishing the throughput of the system; 4) the amplification of different template preparations (standard versus sample) is compared. This last point is of particular importance concerning the amplification of DNA from pathological specimens derived from heterogeneous sources with different degrees of tissue preservation. Slightest impurities in the sample and partial template degradation because of improper fixation will severely distort the absolute quantification. As a consequence we used a relative quantification algorithm: The threshold value (CT-value) of the gene of interest which is directly proportional to the absolute copy number is always compared to the threshold value for two reference genes. Performing this relative calculation all distortions of the amplification efficiency (and thereby the absolute quantification) because of fixation artifacts or sample impurities are eliminated from the calculation of gene copy amplification factors. In conclusion, the relative quantification is not only more simple and more economical (by saving reagents and time and enhancing the throughput) but also more reliable and exact for the determination of gene copy numbers in immunohistochemically stained archival tissue sections after microdissection.
To the best of our knowledge this is the first description of a quantitative kinetic PCR-assay to analyze formalin-fixed paraffin-embedded archival tissue sections after immunohistological staining and laser-assisted microdissection. The demonstration of reliable quantification in microdissected archival biopsies will enable the retrospective and prospective analysis of larger series of biopsies to address the importance of quantitative structural genomic alterations for the evolution and progression of neoplasia. As already pointed out this method can easily and quickly be extended to the analysis of every gene for which an amplification has been reported in the literature or might be assumed.
Acknowledgments
We thank Britta Hasemeier and Martin Bredt for invaluable help in preparing the figures and Richard Lilischkis for critical reading of the manuscript and many stimulating discussions.
Footnotes
Address reprint requests to Ulrich Lehmann, Ph.D., Institute of Pathology, Medizinische Hochschule Hannover, Carl-Neuberg-Strasse 1, D-30625 Hannover, Germany. E-mail: lehmann.ulrich@mh-hannover.de.
Supported by the Deutshe Forschungsgemeinschaft, grant DFG Fe 516/1-1.
References
- 1.Knuutila S, Bjorkqvist AM, Autio K, Tarkkanen M, Wolf M, Monni O, Szymanska J, Larramendy ML, Tapper J, Pere H, El-Rifai W, Hemmer S, Wasenius VM, Vidgren V, Zhu Y: DNA copy number amplifications in human neoplasms: review of comparative genomic hybridization studies. Am J Pathol 1998, 152:1107-1123 [PMC free article] [PubMed] [Google Scholar]
- 2.Schwab M: Amplification of oncogenes in human cancer cells. Bioessays 1998, 20:473-479 [DOI] [PubMed] [Google Scholar]
- 3.Kreipe H, Feist H, Fischer L, Felgner J, Heidorn K, Mettler L, Parwaresch R: Amplification of c-myc but not of c-erbB-2 is associated with high proliferative capacity in breast cancer. Cancer Res 1993, 53:1956-1961 [PubMed] [Google Scholar]
- 4.Schwab M: Amplification of N-myc as a prognostic marker for patients with neuroblastoma. Semin Cancer Biol 1993, 4:13-18 [PubMed] [Google Scholar]
- 5.Abou-Elella A, Gramlich T, Fritsch C, Gansler T: c-myc amplification in hepatocellular carcinoma predicts unfavorable prognosis. Mod Pathol 1996, 9:95-98 [PubMed] [Google Scholar]
- 6.Amadori D, Maltoni M, Volpi A, Nanni O, Scarpi E, Renault B, Pellegata NS, Gaudio M, Magni E, Ranzani GN: Gene amplification and proliferative kinetics in relation to prognosis of patients with gastric carcinoma. Cancer 1997, 79:226-232 [DOI] [PubMed] [Google Scholar]
- 7.Press MF, Bernstein L, Thomas PA, Meisner LF, Zhou JY, Ma Y, Hung G, Robinson RA, Harris C, El-Naggar A, Slamon DJ, Phillips RN, Ross JS, Wolman SR, Flom KJ: HER-2/neu gene amplification characterized by fluorescence in situ hybridization: poor prognosis in node-negative breast carcinomas. J Clin Oncol 1997, 15:2894-2904 [DOI] [PubMed] [Google Scholar]
- 8.Galanis E, Buckner J, Kimmel D, Jenkins R, Alderete B, O’Fallon J, Wang CH, Scheithauer BW, James CD: Gene amplification as a prognostic factor in primary and secondary high-grade malignant gliomas. Int J Oncol 1998, 13:717-724 [PubMed] [Google Scholar]
- 9.Bergstein I: Molecular alterations in breast cancer. Bowcock AM eds. Breast Cancer: Molecular Genetics, Pathogenesis, and Therapeutics. 1999, :pp 143-170 Humana Press, Totowa [Google Scholar]
- 10.Anzick SL, Kononen J, Walker RL, Azorsa DO, Tanner MM, Guan XY, Sauter G, Kallioniemi OP, Trent JM, Meltzer PS: AIB1, a steroid receptor coactivator amplified in breast and ovarian cancer. Science 1997, 277:965-968 [DOI] [PubMed] [Google Scholar]
- 11.Courjal F, Cuny M, Simony-Lafontaine J, Louason G, Speiser P, Zeillinger R, Rodriguez C, Theillet C: Mapping of DNA amplifications at 15 chromosomal localizations in 1875 breast tumors: definition of phenotypic groups. Cancer Res 1997, 57:4360-4367 [PubMed] [Google Scholar]
- 12.Vogt U, Bielawski K, Schlotter CM, Bosse U, Falkiewicz B, Podhajska AJ: Amplification of erbB-4 oncogene occurs less frequently than that of erbB-2 in primary human breast cancer. Gene 1998, 223:375-380 [DOI] [PubMed] [Google Scholar]
- 13.An HX, Beckmann MW, Reifenberger G, Bender HG, Niederacher D: Gene amplification and overexpression of CDK4 in sporadic breast carcinomas is associated with high tumor cell proliferation. Am J Pathol 1999, 154:113-118 [DOI] [PMC free article] [PubMed] [Google Scholar]
- 14.Couch FJ, Wang XY, Wu GJ, Qian J, Jenkins RB, James CD: Localization of PS6K to chromosomal region 17q23 and determination of its amplification in breast cancer. Cancer Res 1999, 59:1408-1411 [PubMed] [Google Scholar]
- 15.Nupponen NN, Porkka K, Kakkola L, Tanner M, Persson K, Borg A, Isola J, Visakorpi T: Amplification and overexpression of p40 subunit of eukaryotic translation initiation factor 3 in breast and prostate cancer. Am J Pathol 1999, 154:1777-1783 [DOI] [PMC free article] [PubMed] [Google Scholar]
- 16.Sourvinos G, Tsatsanis C, Spandidos DA: Overexpression of the Tpl-2/Cot oncogene in human breast cancer. Oncogene 1999, 18:4968-4973 [DOI] [PubMed] [Google Scholar]
- 17.Zhu Y, Qi C, Jain S, Le Beau MM, Espinosa R, III, Atkins GB, Lazar MA, Yeldandi AV, Rao MS, Reddy JK: Amplification and overexpression of peroxisome proliferator-activated receptor binding protein (PBP/PPARBP) gene in breast cancer. Proc Natl Acad Sci USA 1999, 96:10848-10853 [DOI] [PMC free article] [PubMed] [Google Scholar]
- 18.Beckmann MW, Niederacher D, Schnurch HG, Gusterson BA, Bender HG: Multistep carcinogenesis of breast cancer and tumour heterogeneity. J Mol Med 1997, 75:429-439 [DOI] [PubMed] [Google Scholar]
- 19.Revillion F, Bonneterre J, Peyrat JP: ERBB2 oncogene in human breast cancer and its clinical significance. Eur J Cancer 1998, 34:791-808 [DOI] [PubMed] [Google Scholar]
- 20.Ross JS, Fletcher JA: HER-2/neu (c-erb-B2) gene and protein in breast cancer. Am J Clin Pathol 1999, 112:S53-S67 [PubMed] [Google Scholar]
- 21.Schutze K, Lahr G: Identification of expressed genes by laser-mediated manipulation of single cells [see comments]. Nat Biotechnol 1998, 16:737-742 [DOI] [PubMed] [Google Scholar]
- 22.Gibson UE, Heid CA, Williams PM: A novel method for real time quantitative RT-PCR. Genome Res 1996, 6:995-1001 [DOI] [PubMed] [Google Scholar]
- 23.Heid CA, Stevens J, Livak KJ, Williams PM: Real time quantitative PCR. Genome Res 1996, 6:986-994 [DOI] [PubMed] [Google Scholar]
- 24.Martinez-Lacaci I, Bianco C, De Santis M, Salomon DS: Epidermal growth factor-related peptides and their cognate receptors in breast cancer. Bowcock AM eds. Breast Cancer: Molecular Genetics, Pathogenesis, and Therapeutics. 1999, :pp 31-58 Humana Press, Totowa [Google Scholar]
- 25.Klapper LN, Kirschbaum MH, Sela M, Yarden Y: Biochemical and clinical implications of the ErbB/HER signaling network of growth factor receptors. Adv Cancer Res 1999, 77:25-79 [PubMed] [Google Scholar]
- 26.Wang JC: DNA topoisomerases. Annu Rev Biochem 1996, 65:635-692 [DOI] [PubMed] [Google Scholar]
- 27.Meyer KN, Kjeldsen E, Straub T, Knudsen BR, Hickson ID, Kikuchi A, Kreipe H, Boege F: Cell cycle-coupled relocation of types I and II topoisomerases and modulation of catalytic enzyme activities. J Cell Biol 1997, 136:775-788 [DOI] [PMC free article] [PubMed] [Google Scholar]
- 28.Hynes NE, Stern DF: The biology of erbB-2/neu/HER-2 and its role in cancer. Biochim Biophys Acta 1994, 1198:165-184 [DOI] [PubMed] [Google Scholar]
- 29.Szollosi J, Balazs M, Feuerstein BG, Benz CC, Waldman FM: ERBB-2 (HER2/neu) gene copy number, p185HER-2 overexpression, and intratumor heterogeneity in human breast cancer. Cancer Res 1995, 55:5400-5407 [PubMed] [Google Scholar]
- 30.Pauletti G, Godolphin W, Press MF, Slamon DJ: Detection and quantitation of HER-2/neu gene amplification in human breast cancer archival material using fluorescence in situ hybridization. Oncogene 1996, 13:63-72 [PubMed] [Google Scholar]
- 31.Kreipe H, Heidebrecht HJ, Hansen S, Rohlk W, Kubbies M, Wacker HH, Tiemann M, Radzun HJ, Parwaresch R: A new proliferation-associated nuclear antigen detectable in paraffin-embedded tissues by the monoclonal antibody Ki-S1. Am J Pathol 1993, 142:3-9 [PMC free article] [PubMed] [Google Scholar]
- 32.Boege F, Andersen A, Jensen S, Zeidler R, Kreipe H: Proliferation-associated nuclear antigen Ki-S1 is identical with topoisomerase II alpha. Delineation of a carboxy-terminal epitope with peptide antibodies. Am J Pathol 1995, 146:1302-1308 [PMC free article] [PubMed] [Google Scholar]
- 33.Holland PM, Abramson RD, Watson R, Gelfand DH: Detection of specific polymerase chain reaction product by utilizing the 5′–3′ exonuclease activity of Thermus aquaticus DNA polymerase. Proc Natl Acad Sci USA 1991, 88:7276-7280 [DOI] [PMC free article] [PubMed] [Google Scholar]
- 34.Livak KJ, Flood SJ, Marmaro J, Giusti W, Deetz K: Oligonucleotides with fluorescent dyes at opposite ends provide a quenched probe system useful for detecting PCR product and nucleic acid hybridization. PCR Methods Appl 1995, 4:357-362 [DOI] [PubMed] [Google Scholar]
- 35.Bieche I, Olivi M, Champeme MH, Vidaud D, Lidereau R, Vidaud M: Novel approach to quantitative polymerase chain reaction using real-time detection: application to the detection of gene amplification in breast cancer. Int J Cancer 1998, 78:661-666 [DOI] [PubMed] [Google Scholar]
- 36.Farkas DH, McMahon LW, Cai P, Umek RM: Improved quantitation of HER-2/neu gene copy number in breast tumor-derived DNA samples. Am J Clin Pathol 1993, 100:444-450 [DOI] [PubMed] [Google Scholar]
- 37.Prost S, Le MG, Douc-Rasy S, Ahomadegbe JC, Spielmann M, Guerin M, Riou G: Association of c-erbB2-gene amplification with poor prognosis in non-inflammatory breast carcinomas but not in carcinomas of the inflammatory type. Int J Cancer 1994, 58:763–768 [DOI] [PubMed]
- 38.Southern EM: Detection of specific sequences among DNA fragments separated by gel electrophoresis. J Mol Biol 1975, 98:503-517 [DOI] [PubMed] [Google Scholar]
- 39.Zimmermann K, Mannhalter JW: Technical aspects of quantitative competitive PCR. Biotechniques 1996, 21:268–272, 274–279 [DOI] [PubMed]
- 40.Freeman WM, Walker SJ, Vrana KE: Quantitative RT-PCR: pitfalls and potential. Biotechniques 1999, 26:112–122, 124–125 [DOI] [PubMed]
- 41.Pinkel D, Straume T, Gray JW: Cytogenetic analysis using quantitative, high-sensitivity, fluorescence hybridization. Proc Natl Acad Sci USA 1986, 83:2934-2938 [DOI] [PMC free article] [PubMed] [Google Scholar]
- 42.Fletcher JA: DNA in situ hybridization as an adjunct in tumor diagnosis. Am J Clin Pathol 1999, 112:S11-S18 [PubMed] [Google Scholar]
- 43.Wisecarver JL: HER-2/neu testing comes of age [editorial; comment]. Am J Clin Pathol 1999, 111:299-301 [DOI] [PubMed] [Google Scholar]
- 44.Tzahar E, Yarden Y: The ErbB-2/HER2 oncogenic receptor of adenocarcinomas: from orphanhood to multiple stromal ligands. Biochim Biophys Acta 1998, 1377:M25-M37 [DOI] [PubMed] [Google Scholar]
- 45.Jarvinen T, Tanner M, Borg MB, Isola J: Characterization of topoisomerase II alpha gene amplification and deletion in breast cancer. Genes Chromosomes Cancer 1999, 26:142-150 [PubMed] [Google Scholar]
- 46.Keith WN, Douglas F, Wishart GC, McCallum HM, George WD, Kaye SB, Brown R: Co-amplification of erbB2, topoisomerase II alpha and retinoic acid receptor alpha genes in breast cancer and allelic loss at topoisomerase I on chromosome 20. Eur J Cancer 1993, 10:1469-1475 [DOI] [PubMed] [Google Scholar]
- 47.Smith K, Houlbrook S, Greenall M, Carmichael J, Harris AL: Topoisomerase II alpha co-amplification with erbB2 in human primary breast cancer and breast cancer cell lines: relationship to m-AMSA and mitoxantrone sensitivity. Oncogene 1993, 8:933-938 [PubMed] [Google Scholar]
- 48.Faulkner SW, Leigh DA: Universal amplification of DNA isolated from small regions of paraffin-embedded, formalin-fixed tissue. Biotechniques 1998, 24:47-50 [DOI] [PubMed] [Google Scholar]