

Abstract
Thiazolidinediones are effective anti-diabetic drugs that improve insulin sensitivity through the activation of the nuclear receptor and adipocyte-specific transcription factor, peroxisome proliferator-activated receptor gamma (PPAR-γ). Recent evidence suggests that PPAR-γ also controls bone cell development and bone homeostasis. In mice, PPAR-γ insufficiency results in increased bone mass, whereas administration of the specific PPAR-γ agonist rosiglitazone leads to bone loss and increased bone marrow adiposity. Although the pro-adipocytic and anti-osteoblastic activities of PPAR-γ can be separated in vitro using ligands with distinct chemical structures, little evidence exists supporting this functional separation in vivo. Netoglitazone (MCC-555, RWJ-241947) is a thiazolidinedione, which acts as either a full or partial PPAR-γ agonist, or antagonist, in a cell type specific manner. In this study, the pro-adipocytic and anti-osteoblastic activities of netoglitazone were evaluated in vitro, using both U-33/γ2 cells as a model of marrow mesenchymal cell differentiation under the control of PPAR-γ2 and primary bone marrow cultures, and in vivo in C57BL/6 mice. In vitro, netoglitazone induced adipocyte and inhibited osteoblast formation in a PPAR-γ2-dependent manner; however, it was 100-fold less effective than rosiglitazone. In vivo, the administration of netoglitazone at an effective hyperglycemic dose (10 μg/g body weight/day) did not result in trabecular bone loss. Bone quality parameters such as bone mineral density and bone microarchitecture were not affected in netoglitazone-treated animals. The observed lack of an in vivo effect of netoglitazone on bone was entirely consistent with its low anti-osteoblastic activity in vitro. In contrast to the observed in vitro effects, netoglitazone in vivo effectively induced marrow adipocyte formation and induced changes in the weights of extramedullary fat depots. Consistent with these cell type-specific effects, expression of the adipocyte-specific gene marker FABP4/aP2 was increased, whereas the expression of osteoblast-specific gene markers, Runx2, Dlx5, osteocalcin, and collagen were not affected by netoglitazone. In conclusion, netoglitazone is a member of a new class of PPAR-γ ligands with distinct anti-diabetic, anti-osteoblastic, and pro-adipocytic activities in vivo.
Keywords: PPAR-gamma, Netoglitazone, MCC-555, Bone, Fat
Introduction
Thiazolidinediones (or glitazones) represent a new class of oral anti-diabetic agents. Two of these, rosiglitazone and pioglitazone, are approved by the U.S. Food and Drug Administration for the treatment of type 2 diabetes. The primary pharmacological actions of glitazones are an improvement in insulin sensitivity in muscle and adipose tissue and an inhibition of hepatic gluconeogenesis [1]. In general, these drugs are well tolerated, however, their prolonged administration leads to the development of side effects including edema, anemia, and weight gain that are of clinical significance [1,2]. The glitazones exert their anti-diabetic effects through the activation of the nuclear receptor and transcription factor peroxisome proliferator-activated receptor gamma (PPAR-γ) which also plays an important role in fatty acids metabolism, and the development and function of adipose tissues.
Netoglitazone, also referred to as MCC-555 or RWJ-241947, is a new glitazone with a relatively high anti-diabetic efficacy, despite its low binding affinity for PPAR-γ [1,3,4]. Netoglitazone has been reported to be over 50-fold more potent than rosiglitazone in decreasing blood glucose levels in rodent models of type 2 diabetes, and 5- to 10-fold less effective than rosiglitazone in inducing adipogenesis in mouse preadipocytes [3,5,6]. These effects may be explained by the ability of netoglitazone to act as a PPAR-γ agonist, partial agonist, or antagonist, depending on cell context, and can be attributed to its ability to recruit PPAR-γ co-activators, distinct from those recruited by rosiglitazone [3].
Adipocytes and osteoblasts are derived from common marrow mesenchymal progenitors [7–11]. We have previously shown in U-33/γ2 cells, a model of marrow mesenchymal cell differentiation, that osteoblast and adipocyte development is under the control of PPAR-γ, specifically the adipocyte-restricted PPAR-γ2 isoform [11]. PPAR-γ2 activated by rosiglitazone converts cells of the osteoblast lineage to terminally differentiated adipocytes and irreversibly suppresses both the osteoblast phenotype and osteoblast-specific gene expression. In vivo, an essential role of PPAR-γ in maintaining bone homeostasis was demonstrated in animal models of either bone loss or bone accrual due to the status of PPAR-γ activation [12–17]. We have demonstrated that rosiglitazone administration to intact C57BL/6 mice induces a decrease in tibial BMD, bone volume, and changes in bone microarchitecture [12]. These changes are associated with changes in the structure and function of bone marrow, such as a decreased number of osteoblasts and an increased number of adipocytes, indicating an important role for PPAR-γ2 in mesenchymal cell lineage allocation [12]. In contrast, in a model of bone accrual due to PPAR-γ insufficiency, heterozygous PPAR-γ deficient mice exhibited high bone mass and increased osteoblastogenesis, but normal osteoblast and osteoclast function [17]. Similarly, PPARγWAThyp mice, a murine model of lipodystrophy due to a selective deficit of PPAR-γ in fat, have increased bone mass [15]. In humans, a PPAR-γ polymorphism, resulting from a silent C to T transition in exon 6, is also associated with reduced BMD [18].
We have previously demonstrated that it is possible to separate the pro-adipocytic and anti-osteoblastic activities of PPAR-γ2 by using ligands with different chemical structures [19]. The ligand binding pocket of PPAR-γ is promiscuous and binds a variety of molecules with different affinities [20]. PPAR-γ2 activation in osteoblast cells using natural and artificial ligands with distinct pharmacophores and binding affinities, resulted in the divergent activation of the pro-adipocytic and anti-osteoblastic activity of PPAR-γ2 [19], suggesting that these effects are mediated by distinct regulatory pathways that are differentially modulated depending on the nature of the particular ligand. Moreover, these results imply that selective PPAR-γ2 modulators, which have beneficial activities as insulin sensitizers without adverse effects on the skeleton, can be identified.
Since netoglitazone is a PPAR-γ modulator, with strong insulin sensitizing and weak pro-adipocytic activities in vitro, we tested the effect of this compound on bone cell differentiation in vitro and on the skeleton in vivo. Netoglitazone activities were tested in U-33/γ2 cells, which represent a model of mesenchymal cell differentiation under the control of PPAR-γ2, and in primary bone marrow cultures, which include a heterogeneous population of osteoblast progenitor cells. The in vivo activity of netoglitazone on bone was tested at a dose, which lowered blood glucose levels as effectively as rosiglitazone in diabetic animals [3] and was equivalent to the dose of rosiglitazone that we had shown previously to cause significant bone loss in mice [12]. The data demonstrated that netoglitazone is a PPAR-γ ligand that distinguishes the anti-diabetic, anti-osteoblastic, and pro-adipocytic activities of this transcription factor. Collectively, these findings suggest that selective PPAR-γ modulators that differentially activate anti-osteoblastic and pro-adipocytic activities, while retaining their beneficial effects on insulin sensitization, are feasible.
Materials and methods
Cell culture, treatment regime, and cell phenotype assays
Both, netoglitazone maleate and rosiglitazone maleate were obtained from Carex S.A. (Strasbourg, France). Murine marrow-derived UAMS-33 cells stably transfected with a PPAR-γ2 expression construct (clone 28.6), referred to as U-33/γ2 cells, and UAMS-33 cells transfected with an empty vector control (clone γc2), referred as U-33/c cells, have been previously described [11]. Cell lines were maintained in αMEM supplemented with 10% FBS (Hyclone, Logan, UT), 0.5 mg/ml G418 for positive selection of transfected cells, 100 U/ml penicillin, 100 μg/ml streptomycin, and 0.25 μg/ml amphotericin (Sigma) at 37°C in a humidified atmosphere containing 5% CO2. Media and additives were purchased from Life Technologies (Gaithersburg, MD).
To measure adipocyte formation, cells were cultured in 48-well plates and, after cultures achieved ~70% confluence, growth medium was supplemented with either the tested ligands at different concentrations or with DMSO (as vehicle control). Cells were treated for 6 days with one change of media, fixed with 10% phosphate-buffered formalin, and stained for 30 min with 0.15% Oil Red O (Sigma, St. Louis, MO) in a 55:45 (vol/vol) mixture of isopropanol and water for lipid detection [19]. After rinsing, cells were counterstained with 0.5% methyl green (Fisher Scientific, Fair Lawn, NJ) in 0.1 M sodium acetate (pH 4.0). For the quantification of adipocytes, cells in each replicate well were enumerated in 5 randomly selected fields, each containing approximately 200 cells, and the percent fraction of the cells that contained fat droplets positively stained for Oil Red O was calculated.
To measure the effect of the ligands on alkaline phosphatase activity, a marker of the osteoblast phenotype, cells were plated in 96-well plates in triplicate and treated with tested ligands at different concentrations for 6 days, as described above. After treatment, alkaline phosphatase activity was measured using p-nitrophenol as a substrate (Phosphatase Substrate, Sigma), and data were normalized to the number of cells measured with CellTiter 96 Non-Radioactive Cell Proliferation Assay (Promega, Madison, WI). One microunit (μU) of activity was defined as the amount of enzyme capable of hydrolyzing 1 pmol of p-nitrophenol substrate per minute at room temperature.
To measure the effects of the tested ligands on osteoblast mineralization, U-33/γ2 U-33/c cells were initially cultured for 6 days with or without ligands, as described above, followed by 13 days culture in pro-osteoblastic medium containing 0.2 mM ascorbic acid (Sigma) and 10 mM β-glycerophosphate (Sigma) [11]. The culture medium was replaced every other day. Calcium deposited into the extracellular matrix was extracted with 0.1% acetic acid for 5 h at room temperature, and quantified colorimetrically using a Calcium Binding Assay (Sigma).
No effects on cell viability as measured by trypan blue exclusion was observed at any ligand concentration tested.
Primary bone marrow cultures, treatment, and differentiation assays
Bone marrow was isolated by aspiration from the femora of 6 months old male C57BL/6 mice, as previously described [11], using a University of Arkansas for Medical Sciences (UAMS) IACUC approved protocol. Marrow isolates from 10 animals were pooled and cultures established by plating cells at the density 2.5 × 10⁶ cells/well on 6-well plates for differentiation assays or at 5 × 10⁶ cells per 60 mm plates for RNA isolation. Cells were plated in triplicate and grown in the presence of 15% FBS in αMEM medium. One-half of the medium was changed every 6 days.
For adipocyte differentiation, growth medium was supplemented with either netoglitazone or rosiglitazone at the following final concentrations: 0.01, 0.1, and 1 μM after 10 days of culture. Three days later, the treatment was repeated and one half of the culture medium changed. The cultures were harvested on day 6, stained for fat with Oil Red O and counterstained with methyl green, as described previously [19]. Colony Forming Units for Adipocytes (CFU-AD) were enumerated, considering a colony, which contained at least 10% cells, as CFU-AD.
For osteoblast differentiation, bone marrow cultures were established in a basal medium supplemented with 0.2 mM ascorbic acid and 10 mM β-glycerophosphate and maintained for 28 days with half the medium changed every 6 days [11]. On day 10, the medium was supplemented with either netoglitazone or rosiglitazone at the concentrations described above, and the treatments were repeated with each medium change, for the duration of the experiment. Colony Forming Units for Osteoblasts (CFU-OB) were detected by Von Kossa staining of mineral and enumerated as described [11].
RNA isolation and gene expression analysis
For RNA isolation, U-33/γ2 and U-33/c cells were grown in basal medium until cultures obtained 80% confluency, whereas bone marrow cells were grown for 10 days, followed by 3 days treatment with tested compounds. Total RNA from cell lines and primary bone marrow cultures were isolated using RNeasy kit (QIAGEN Inc., Valencia, CA). RNA isolation from the intact tibia of experimental animals was performed using TRIzol Reagent (Invitrogen, Carlsbad, CA), as described previously [12].
RT-PCR analysis of Runx2 and FABP4/aP2 mRNA expression in cell lines was performed using Advantage RT-for-PCR and Advantage cDNA PCR kits (Clontech, Palo Alto, CA). The reverse transcription (RT) reaction was incubated at 42°C for 1 h. The amount of cDNA used for each PCR reaction corresponded to 0.014 μg total RNA. The expression of osteoblast-specific isoform of Runx2 was determined by Southern analysis of RT-PCR products. PCR was performed using a forward primer (mOSF2+1.F) corresponding to the sequence unique for the bone-specific Runx2 isoform and a reverse primer (mCBFA1+655.R) corresponding to the common sequence for different Runx2 isoforms, as previously described [21]. PCR reaction products were electrophoresed on 0.9% agarose gel, transferred to BrightStar™-Plus nylon membrane (Ambion Inc., Austin, TX), and hybridized under high stringency conditions [22] to a 32P-labeled cDNA probe (140 bp) representing an osteoblast-specific fragment of Runx2 [23]. The level of fatty acid binding protein 4 (FABP4 or aP2) and glyceraldehyde-3-phosphate dehydrogenase (GAPDH) expression were detected using RT-PCR at the conditions described before [19]. For all analyzed genes, the PCR reaction conditions generated products within the linear range of amplification. No amplicons were evident in the absence of the reverse transcription reaction.
Gene expression analyzes in primary bone marrow cultures and tibiae were performed using quantitative real-time RT-PCR. The gene-specific primer sequences were selected using the Taqman Probe and Primer Design function of the Primer Express v1.5 software (Applied Biosystems, Forest City, CA). Reverse transcription reactions were carried out using 2 μg RNA, subjected previously to DNase digestion and a TaqMan Reverse Transcription Reagents (Applied Biosystems) followed by PCR in real time using a SYBR Green PCR Master Mix (Applied Biosystems) and an ABI Prism 7700 Sequence Detection System (Applied Biosystems). The reactions were performed using the following cycling conditions: 95°C for 10 min, then 40 cycles of 95°C for 15 s followed by 60 C for 1 min. The optimal concentrations of primers and templates that were used in each reaction were established based on the standard curve created prior to the reaction and corresponded to ~100% reaction efficiency. PCR results were normalized to the expression of 18S rRNA in the same samples. Gene expression was analyzed using following pairs of primers: FABP4/aP2 (forward-GCGTGGAATTCGATGAAATCA; reverse-CCCGCCATCTAGGGTTATGA), Runx2 (forward-GGGCACAAGTTCTATCTGGAAAA; reverse-CGGTGTCACTGCGCTGAA), Dlx5 (forward-TGA-CAGGAGTGTTTGACAGAAGAGT; reverse-CGGGAACGGAGCTTGGA), osteocalcin (forward-CGGCCCTGAGTCTGACAAA; reverse-GCCGGA-GTCTGTTCACTACCTT), α1(I)collagen (forward-ACTGTCCCAACCCCCAAAG; reverse-CGTATTCTTCC-GGGCAGAAA), and 18S rRNA (forward-TTCGAACGTCT-GCCCTATCAA; reverse-ATGGTAGGCACGGCGACTA).
Animals and treatment regime
Obese diabetic yellow agouti Avy mice (7-months old male) were obtained from the colony maintained at the National Center for Toxicology Research (Jefferson, AR) [24]. Non-diabetic 6-month-old male C57BL/6 mice were obtained from the colony maintained by the National Institute of Aging under contractual agreement with Harlan Sprague–Dawley/NIA. Animals were housed in groups of 4 per cage with free access to water and at a constant temperature on a 12-h light–dark cycle. All animal treatment and care protocols conformed to National Institute of Health guidelines and were performed using a University of Arkansas for Medical Sciences (UAMS) IACUC approved protocol.
To establish a dose of netoglitazone with the same anti-hyperglycemic effect as the previously reported rosiglitazone dose [12], Avy mice (four animals per group) were fed a diet supplemented with either netoglitazone (5 μg/g body weight/day or 10 μg/g body weight/day), or rosiglitazone (20 μg/g body weight/day), or non-supplemented (control group) for 4 days. Diets were prepared as described previously using a chow of identical nutritional composition [12]. Plasma glucose levels were measured at the beginning and end of the experiment for each animal fasted for 4 h before blood collection from the tail vein. Glucose levels in serum were determined based on the enzymatic reaction of β-D-glucose with oxygen using Hichem Glucar Glucose Reagent Pak (Elan, Smithfield, RI) and Beckman Glucose Analyzer 2 (Beckman Coulter Inc.).
To determine the effect of netoglitazone on the skeleton, intact C57BL/6 animals (N = 8 per group) were fed 5 g of chow supplemented with 10 μg/g body weight/day netoglitazone maleate. The control group was fed the same amount of non-supplemented chow. All animals were fed for 7 weeks with food intake monitored daily and the body weights of individual animals monitored weekly.
Bone mineral density measurements
Bone mineral density (BMD) was determined using the small animal dual energy X-ray absorptiometry (DXA) instrument Piximus 2 (GE Lunar, Madison, WI) and software V1.46 [12,25]. Mice were anesthetized and scanned prior to the onset of treatment and at sacrifice. Total body BMD and bone mineral content (BMC), excluding the head and tail regions, was obtained from each scan. The percent change in BMD was determined by inserting the values (V) collected for each time point into the calculation: (Vpost-treatment − Vpre-treatment) / Vpost-treatment × 100. Internal variations of repeated measures of total murine body BMD in our laboratory have been determined to be 1.7–2.0%.
Micro-computed tomography (MicroCT) analysis
After sacrifice, the right tibia of each animal was dissected and fixed in 10% phosphate-buffered formalin, pH 7.4, at 4 C. After 24 h, the tibiae were analyzed without further sample preparation in a microCT 40 (Scanco Medical, Bassersdorf, Switzerland) in formalin. MicroCT scans were performed on 256 successively measured slices (12 μm each) to total 3.07 mm of the proximal metaphysis [12]. The three-dimensional information was obtained by stacking the measured slices on top of each other. The volume of interest (VOI) for subsequent morphometric analysis in 3-dimensions was the entire secondary spongiosa after extracting automatically the surrounding cortical bone (length of 3.07 mm of the radial axis), and avoiding inclusion of boundaries of the VOI [26,27]. The complete secondary spongiosa of the proximal tibia was evaluated to avoid sampling errors incurred by random deviations within a single section. Careful contouring of this region yielded volumetric information of bone volume (BV), total volume (TV), and calculated ratio of BV/TV, as well as trabecular thickness (Tb.Th.), trabecular number (Tb.N.), and trabecular spacing (Tb.Sp.). Estimation of the plate-rod characteristics of the specimen was achieved using the Structure Model Index (SMI). For an ideal plate and rod structure, the SMI value is 0 and 3, respectively. For a mixed structure, the value is between 0 and 3, depending on the volume ratio between rods and plates. The geometrical degree of anisotropy (DA) is defined as the ratio between the maximal and the minimal radius of the mean intercept length ellipsoid. The connectivity density (Conn.D.) is calculated using the Euler method. The computation of both DA and Conn.D are described in detail elsewhere [26].
Determination of marrow adipocyte number
Following microCT analysis, tibiae were decalcified in formic acid, embedded in paraffin and sectioned at 5 μm as described [28]. Histological sections were stained with hematoxilin and eosin [28]. Fat cells present within the tissue area were enumerated under magnification 20× on five consecutive microscopic fields of the secondary spongiosa of the proximal tibia as described previously [12] and an average number of cells per high power field of 4 individual animals per group was calculated.
Statistical analysis
Statistically significant differences between groups were detected using one-way ANOVA followed by post hoc analysis by Student–Neuman–Keuls within the SigmaStat software (SPSS, Inc., Chicago, IL) after establishing the homogeneity of variances and normal distribution of data. In all cases, P < 0.05 was considered significant.
Results
Effect of netoglitazone on adipocyte and osteoblast differentiation
We have previously described a cellular model for testing in vitro the effects of PPAR-γ agonists on the osteoblast phenotype [11,19]. The model consists of two cell lines derived from a clonal murine pre-osteoblastic cell line, UAMS-33 [11]. UAMS-33 cells were stably transfected with either a PPAR-γ2 expression construct (U-33/γ2 cells) or empty vector (U-33/c cells). U-33/c cells serve as a negative control for PPAR-γ2-dependent effects of tested agonists. U-33/γ2 cells are bipotential and capable of both osteoblast and adipocyte differentiation. In the presence of pro-osteoblastic stimuli (ascorbic acid and β-glycerophosphate), the cells mineralize the extracellular matrix. In contrast, the addition of a PPAR-γ ligand, such as rosiglitazone, to the basal medium induces fat accumulation and adipocyte differentiation, and simultaneously suppresses the osteoblast phenotype of these cells, including the ability to mineralize extracellular matrix [11].
As shown in Fig. 1A, netoglitazone was approximately two orders of magnitude less effective than rosiglitazone in inducing adipocyte differentiation in U-33/γ2 cells. This finding is consistent with previous reports demonstrating that netoglitazone was approximately 10 times less effective in inducing adipogenesis in 3T3-L1 cells [3].
Fig. 1.

Effects of netoglitazone (squares) and rosiglitazone (circles) treatment on (A) adipocyte number; (B) alkaline phosphatase enzyme activity; (C) extracellular calcium deposition by U-33/γ2 cells; (D) extracellular calcium deposition by U-33/c cells. Vertical lines indicate standard deviation (SD) calculated from triplicate treatments. *P < 0.05 compared to rosiglitazone.
The anti-osteoblastic properties of netoglitazone and rosiglitazone were compared using two osteoblast-specific assays. First, the effects of both compounds on alkaline phosphatase activity, an enzyme specific for osteoblasts and necessary for their function such as mineralization of extracellular matrix [29], was tested. As shown in Fig. 1B, rosiglitazone effectively inhibited alkaline phosphatase activity in U-33/γ2 cells, even at the lowest tested concentration (7 nM), which is an order of magnitude lower than the known binding affinity of rosiglitazone to PPAR-γ [30]. In contrast, the complete inhibition of alkaline phosphatase enzyme activity by netoglitazone was observed only at concentrations greater than 1 μM. This indicates that netoglitazone is at least 250-fold less effective than rosiglitazone in inhibiting alkaline phosphatase activity in U-33/γ2 cells. Next, the effects of netoglitazone and rosiglitazone on the mineralization of extracellular matrix by U-33/γ2 cells were compared. As shown in Fig. 1C, complete inhibition of mineralization by rosiglitazone occurred at a concentration of 70 nM, whereas netoglitazone induced the same effect only at 6 μM. This distinction represents a 100-fold difference in the inhibition of osteoblast mineralization between rosiglitazone and netoglitazone. As expected, neither compound suppressed mineralization (Fig. 1D), alkaline phosphatase activity (data not shown), or induced fat accumulation (data not shown), in U-33/c cells, indicating that the observed effects are PPAR-γ2 specific.
Next, the effects of netoglitazone and rosiglitazone on the expression of the adipocyte-specific gene marker FABP4/aP2 and the osteoblast-specific transcription factor Runx2 were examined. U-33/γ2 cells were treated with each compound at the concentration (0.5 μM for rosiglitazone and 2.5 μM for netoglitazone), which equally induced the pro-adipocytic and anti-osteoblastic activities of PPAR-γ2. As demonstrated above, treatment with these concentrations resulted in the induction of fat accumulation in 50% of treated cells (Fig. 1A), whereas mineral deposition was decreased by 85% (Fig. 1C). Consistent with the phenotypic effects, the mRNA level for FABP4/aP2 was elevated, while Runx2 mRNA expression was almost completely suppressed, by both rosiglitazone and netoglitazone (Fig. 2). These results indicate that at the respective effective concentrations, netoglitazone possesses the same characteristics as rosiglitazone in respect to the simultaneous activation of the anti-osteoblastic and pro-adipocytic activities of PPAR-γ2. Thus, in order to achieve effects on bone marrow mesenchymal cell differentiation and gene expression in vitro similar to rosiglitazone, netoglitazone requires at least a 50-fold higher concentration.
Fig. 2.

Regulation of FABP4/aP2 and Runx2 gene expression by rosiglitazone and netoglitazone. U-33/γ2 cells were treated with either vehicle (V), 0.5 μM rosiglitazone (R), or 2.5 μM netoglitazone (N) for 3 days followed by isolation of total RNA and RT-PCR analyzes as described in Materials and methods.
Next, we compared the response of primary ex vivo murine bone marrow cultures to netoglitazone and rosiglitazone treatment. Bone marrow mesenchymal progenitors were harvested as described above and treated with either netoglitazone or rosiglitazone at three different concentrations. Their potential to differentiate toward either osteoblasts or adipocytes was measured by the ability to form colonies with deposited mineral (CFU-OB), or colonies containing fat cells (CFU-AD), respectively. As shown in Fig. 3, netoglitazone was less effective than rosiglitazone in both, the inhibition of osteoblastic and the stimulation of adipocytic differentiation. At the concentrations tested, netoglitazone did not effect CFU-OB formation (Fig. 3A); whereas its effects on CFU-AD formation were approximately 100-fold lower than these of rosiglitazone (Fig. 3B).
Fig. 3.
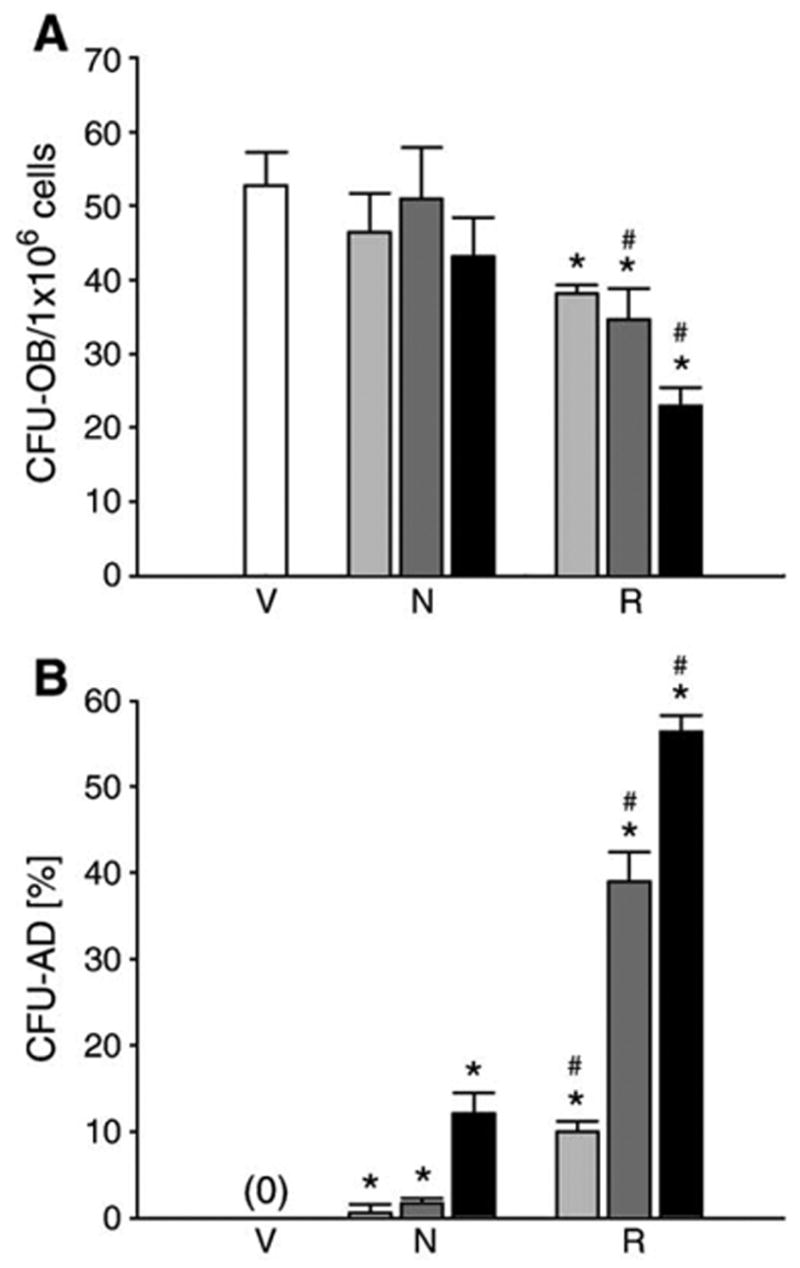
Comparison of netoglitazone and rosiglitazone effects on differentiation of bone marrow mesenchymal progenitors in ex vivo primary bone marrow cultures. Cell cultures were treated with either netoglitazone (N) or rosiglitazone (R) at the following concentrations: 0.01 μM (light gray bars), 0.1 μM (dark gray bars), and 1 μM (black bars). As a vehicle control (V), cells were treated with DMSO (white bars). Vertical lines indicate standard deviation (SD) calculated from triplicate treatments at each concentration. (A) Effects on osteoblast differentiation. Osteoblast cultures, maintained and treated as described in Materials and methods, were harvested after 28 days of growth (10 days without ligand followed by 18 days in the presence of ligand) and stained for mineral with Van Kossa. Colonies that contained mineralized nodules were enumerated and expressed as a number of CFU-OB per 1 × 10⁶ plated bone marrow cells. (B) Effects on adipocyte differentiation. Cultures were treated with tested ligands for 6 days, as described in Materials and methods, followed by harvest and staining for fat with Oil Red O, and counterstaining with methyl green. Colonies that contained at least 10% of cells positively stained with Oil Red O were considered as CFU-AD, and expressed as a percent fraction of total number of colonies. *P < 0.05 vs. control; #P < 0.05 vs. the same concentration of netoglitazone.
Next, the effects of both netoglitazone and rosiglitazone on the expression of phenotype-specific gene markers in primary ex vivo bone marrow cells were examined. As shown in Fig. 4, at the respective concentrations, both compounds affected the expression of osteoblast-specific gene markers, such as Runx2, Dlx5, osteocalcin and collagen, and adipocyte-specific marker, FABP4/aP2, in a similar manner as they affected the number of CFU-OB and CFU-AD. Once again, netoglitazone was approximately 100-fold less efficient than rosiglitazone in effecting osteoblast- and adipocyte-specific gene expression.
Fig. 4.
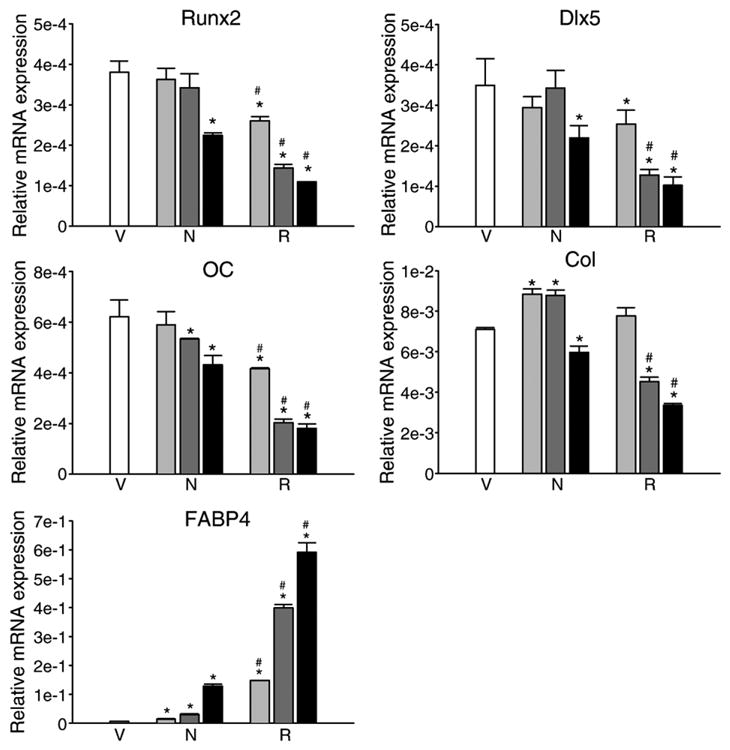
Comparison of netoglitazone and rosiglitazone effects on phenotype-specific gene expression in ex vivo primary bone marrow cultures. Cultures were established as described in Materials and methods and treated with either netoglitazone (N) or rosiglitazone (R) at the following concentrations: 0.01 μM (light gray bars), 0.1 μM (dark gray bars), and 1 μM (black bars), or DMSO as a vehicle control (V) (white bars). After 3 days of treatment, total RNA was isolated and analyzed using quantitative real time RT-PCR. Bars represent a relative mRNA expression of tested gene normalized to the levels of 18S rRNA. Vertical lines indicate standard deviation (SD) calculated from three independent PCR analyzes. Abbreviations: OC—osteocalcin; Col-α1(I) collagen. *P < 0.05 vs. control; #P < 0.05 vs. the same concentration of netoglitazone.
The identical responses of primary bone marrow cultures and U-33/γ2 cells to netoglitazone and rosiglitazone treatments suggest that the observed effects are mediated via PPAR-γ2. These data also validate U-33/γ2 cells as a reliable in vitro model to study the role of PPAR-γ2 in the control of osteoblast and adipocyte differentiation of bone marrow mesenchymal stem cells.
Comparison of the anti-hyperglycemic activities of netoglitazone and rosiglitazone in Avy mice
We have previously demonstrated that the administration of rosiglitazone, at an effective anti-hyperglycemic dose (20 μg/g/day), to non-diabetic C57BL/6 mice for 7 weeks induced significant bone loss [12]. Therefore, in order to determine the effects of netoglitazone on bone, the effective dose of netoglitazone that elicits a similar anti-hyperglycemic effect as rosiglitazone, was established. Since anti-diabetic glitazones do not affect blood glucose levels in non-diabetic animals, as well as non-diabetic humans [31,32], for testing anti-hyperglycemic effects we used obese diabetic yellow agouti Avy mice, which possess some of the characteristics of human type 2 diabetes. The diabetic phenotype of these mice, which results from a mutation in the agouti gene locus, includes hyperglycemia, hyperinsulinemia, and insulin resistance, and is male specific [24]. Previous studies, in which closely related KK-Ay mice were used, demonstrated that a dose of 10 μg/g/day of netoglitazone is as effective as a dose of 30 μg/g/day of rosiglitazone in lowering plasma glucose levels by 2-fold [3]. Therefore, the anti-hyperglycemic effect of netoglitazone in Avy males at two doses (5 and 10 μg/g/day) was compared to the rosiglitazone at the dose previously shown to reduce bone mass in non-diabetic C57BL/6 mice (20 μg/g/day) [12]. Fasting plasma glucose levels measured after 4 days administration of the tested compounds demonstrated that the dose of 10 μg/g/day netoglitazone had a similar anti-hyperglycemic effect as the 20 μg/g/day dose of rosiglitazone (Fig. 5). Both doses decreased glucose levels by approximately 15–20%, which is in the range of expected glycemic effects for rosiglitazone in diabetic patients [2,33].
Fig. 5.
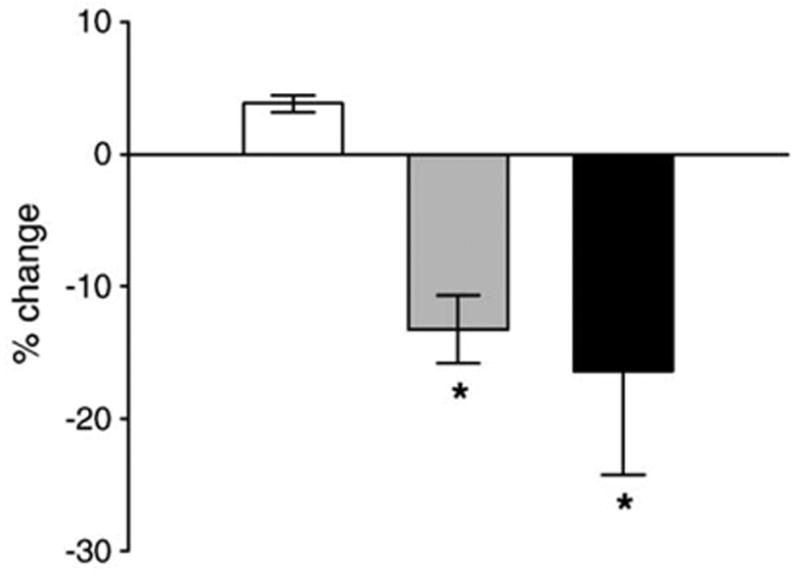
Comparison of anti-hyperglycemic effects of rosiglitazone and netoglitazone in obese yellow Avy mice. Mice were fed for 4 days with either non-supplemented chow (white bar), or chow supplemented with rosiglitazone (20 μg/g body weight/day; gray bar) or netoglitazone (10 μg/g body weight/day; black bar). Blood was collected from animals fasted for 4 h and serum glucose levels determined as described in Materials and methods. Bars show the percent change in serum glucose levels after 4 days of treatment, whereas vertical lines indicate standard deviation of measurements performed on 4 individual animals in each treatment group. *P < 0.05 vs. control.
Effects of netoglitazone on the skeleton of C57BL/6 mice
Netoglitazone (10 μg/g/day) was administered to 6 months old male C57BL/6 mice, for 7 weeks, using an experimental protocol identical to that reported for rosiglitazone [12]. Table 1 shows the effects of netoglitazone administration on body weight, the weights of white (WAT) and brown (BAT) adipose tissues, and blood glucose levels. Seven weeks of netoglitazone administration did not affect body weight, or blood glucose levels in non-diabetic C57BL/6 mice. However, netoglitazone significantly decreased WAT (epididymal fat) weight and increased the BAT (interscapular fat) weight. Similar effects were observed previously in C57BL/6 mice treated with rosiglitazone (20 μg/g/day for 7 weeks) [12]. These results suggest that netoglitazone (10 μg/g/day) is as effective as rosiglitazone (20 μg/g/day) in lowering blood glucose levels in diabetic Avy animals and effecting fat metabolism in normal C57BL/6 mice.
Table 1.
Effects of netoglitazone administration on body weight, WAT, and BAT, and blood glucose level in C57BL/6 mice
| Treatment | Body weight (g) | WAT weight (g) | BAT weight (g) | Glucose level (mg/dL) |
|---|---|---|---|---|
| Control | 30.5 ± 2.8 | 0.447 ± 0.117 | 0.136 ± 0.036 | 208.7 ± 22.7 |
| Netoglitazone | 29.8 ± 2.0 | 0.303 ± 0.040* | 0.201 ± 0.038* | 206.5 ± 35.2 |
| Netoglitazone vs. control (% change) | −2.3 | −32.2 | 47.8 | −1.1 |
Values represent a mean ± standard deviation (±SD) from a total of 6 animals in control group and 8 animals in netoglitazone group.
P < 0.05 vs. control.
Netoglitazone had no significant effect on whole body bone mineral density (BMD) (control: 0.0489 ± 0.0008 g/cm2; netoglitazone 0.0476 ± 0.0012 g/cm2; P > 0.05); however whole body bone mineral content (BMC) was significantly decreased by 4.6% (control: 0.438 ± 0.016 g; netoglitazone: 0.418 ± 0.014 g; P < 0.05). Sub-region analysis of the DEXA scans at the mid-shaft of the femur suggested decreases in cortical BMD (data not shown).
In addition, microCT analysis of trabecular bone in the proximal tibia did not reveal any changes in the bone microarchitecture of animals treated with netoglitazone (Table 2). Parameters, such as bone volume (BV/TV), trabecular number (Tb.N.), trabecular thickness (Tb.Th.), trabecular spacing (Tb.Sp.), and bone connectivity (Conn. D.), were unaffected by netoglitazone treatment. Together, these data suggest the effects of netoglitazone (at this dose and duration) on the skeleton (if any) are small and may be cortical rather than cancellous.
Table 2.
Microtomographic measurements of bone volume and trabecular microarchitecture in the proximal tibia of control and netoglitazone-treated mice
| Treatment | BV/TV (%) | TbTh (3m) | TbN (mm−1) | TbSp (mm) | Conn D (mm−3) | SMI | DA |
|---|---|---|---|---|---|---|---|
| Control | 12.4 ± 1.5 | 45.9 ± 1.6 | 4.22 ± 0.28 | 0.23 ± 0.02 | 64.8 ± 14.1 | 1.99 ± 0.19 | 2.13 ± 0.06 |
| Netoglitazone | 12.2 ± 1.3 | 45.3 ± 1.6 | 4.35 ± 0.27 | 0.23 ± 0.02 | 64.8 ± 16.5 | 2.14 ± 0.18 | 2.20 ± 0.1 |
| Netoglitazone vs. control (% change) | −1.7 | −1 | 3.1 | 0 | 0 | 7.5 | 3.3 |
Values represent a mean ± standard deviation (±SD) from a total of 4 animals per each group.
Analysis of the bone marrow composition of trabecular bone in the proximal tibia demonstrated that netoglitazone increased the number of adipocytes by 3- to 6-fold, compared to control animals (Fig. 6). Similar increases were previously observed in animals that received rosiglitazone [12]. These results suggest that in vivo netoglitazone and rosiglitazone have similar effects on marrow adipocyte formation. These observations contrast dramatically with the results in primary bone marrow cultures and U-33/γ2 cells, where netoglitazone was 100-fold less effective than rosiglitazone in inducing adipocyte formation (Figs. 1 and 3).
Fig. 6.

Netoglitazone administration increased the number of adipocytes in the proximal tibia. The images show longitudinal sections of the proximal tibia of animals fed either non-supplemented (C), or netoglitazone-supplemented (N) chow for 7 weeks (magnification 4×). Numbers below images represent an average number of adipocytes (±SD) calculated from measurements of 4 individual bone specimens and expressed per high power field (HPF, magnification 20×). Marrow adipocytes, recognized by the specific appearance of the space previously occupied by them, were enumerated on five consecutive microscopic fields per specimen in the secondary spongiosa of the proximal tibia. Abbreviations: bm—bone marrow, ad—adipocytes, b—bone. *P < 0.05 vs. control.
The observed lack of netoglitazone effects on specific trabecular bone parameters and its positive effect on marrow adipocyte development was reflected at the level of phenotype-specific gene expression measured in the whole tibia using quantitative real time RT-PCR. Netoglitazone administration did not affect the abundance of transcripts for two osteoblast-specific transcription factors, Runx2 and Dlx5, as well as the osteoblast gene markers, osteocalcin and collagen I (Table 3). In contrast, the expression of the adipocyte maker gene FABP4/aP2 was significantly increased.
Table 3.
Relative expression of phenotype-specific gene markers in the entire tibia normalized to 18S rRNA
| Treatment | Runx2 | Dlx5 | Osteocalcin | α1(I) collagen | FABP4/aP2 |
|---|---|---|---|---|---|
| Control | 9.89 ± 1.19 | 7.79 ± 0.86 | 7.53 ± 0.73 | 7.28 ± 0.54 | 5.4 ± 1.4 |
| Netoglitazone | 6.68 ± 1.66 | 7.20 ± 3.86 | 8.90 ± 3.71 | 5.64 ± 0.87 | 9.9 ± 1.0* |
| Ratio | 0.7 | 0.9 | 1.2 | 0.8 | 1.8 |
Values represent a mean ± standard deviation (±SD) from a total of 4 animals per each group.
P < 0.05 vs. control.
Discussion
Glitazones were originally developed as drugs to combat insulin resistance in type 2 diabetic patients [33]. Despite the clear clinical benefit of these drugs as a treatment for type 2 diabetes, the use of the current generation of glitazones is associated with side effects of clinical importance, such as weight gain, edema, and anemia [2,34]. In addition, there is a growing concern about the reported deleterious effects of glitazones on bone cell function and the skeleton [12–14,16,19]. For these reasons, significant efforts are ongoing to develop novel glitazones, which retain their insulin-sensitizing activity, but are devoid of activities that cause adverse effects. Netoglitazone serves as an example of a selective glitazone, with a high anti-diabetic activity and little or no adverse effects on the skeleton in vivo.
U-33/γ2 cells, in which osteoblast and adipocyte differentiation are specifically under the control of the constitutively expressed PPAR-γ2, serve as a valuable in vitro model for the assessment of the osteoblastic and adipocytic activities of different PPAR-γ modulators [19]. Using this model and primary murine bone marrow cells, we have shown that netoglitazone was significantly less effective than rosiglitazone in suppressing the osteoblast phenotype, as determined by alkaline phosphatase activity, mineralization, and osteoblast-specific gene expression. The demonstration that primary murine bone marrow mesenchy-mal progenitors responded to both PPAR-γ ligands in the same fashion as U-33/γ2 cells supported the notion that U-33/γ2 cells are a reliable tool for determining the selective effects of PPAR-γ modulators on adipocyte and osteoblast differentiation.
The weak anti-osteoblastic activity of netoglitazone in vitro correlated with the observed relatively small effects on bone in vivo. Netoglitazone at a dose of 10 μg/g/day, which lowered blood glucose levels as effectively as rosiglitazone dose of 20 μg/g/day, did not affect BMD, bone microarchitecture, or bone-specific gene expression. However, the decreased BMC observed in netoglitazone-treated animals suggests a potential cortical effect and raises the possibility that higher doses of netoglitazone or longer treatment times may cause larger skeletal effects.
In contrast to the anti-osteoblastic activities of netoglitazone, we observed a striking difference between its in vitro and in vivo pro-adipocytic activities. Although netoglitazone was less effective than rosiglitazone in inducing the adipocyte phenotype in both primary murine bone marrow cultures and U-33/γ2 cells, netoglitazone appeared to be as effective as rosiglitazone in the induction of marrow adipocyte formation in intact animals. In addition, netoglitazone effected the weights of extramedullary fat depots, such as epididymal and interscapular fat, in the same manner as rosiglitazone [12–14,16,19], suggesting a similar role of these two PPAR-γ agonists in fat metabolism in vivo.
A similar discrepancy between the in vitro and in vivo effects of netoglitazone on adipocyte development was noted previously in 3T3-L1 cells and KK-Ay mice, respectively [3]. Although the mechanism by which netoglitazone exerts its differential in vitro and in vivo effects on adipocyte differentiation is unclear, it is possible that the pro-adipocytic activity of netoglitazone in vivo is conveyed via a PPAR-γ independent mechanism; perhaps through another nuclear receptor also involved in fatty acids metabolism such as PPARα [4].
Another intriguing feature of netoglitazone activity is the disparity between its stimulatory effect on marrow adipocyte formation and lack of a suppressive effect on osteoblast differentiation. However, despite the evidence that PPAR-γ-driven differentiation toward the adipocytic phenotype simultaneously suppresses the osteoblastic phenotype and vice versa [11,35], there are numerous examples that show that the interrelationship between these two phenotypes, and the role of PPAR-γ in this process, is more complex [36,37]. We demonstrated previously in vitro, in primary bone marrow cultures and U-33/γ2 cells, that ligands of different chemical composition may selectively regulate PPAR-γ adipocytic and osteoblastic activities [19]. Similar separation of both PPAR-γ activities was demonstrated in vivo by Tornvig et al. who showed that the administration of another glitazone, troglitazone, to ApoE-deficient mice for 10 months did not affect bone mass, although it increased the number of marrow adipocytes and appeared to affect the marrow hematopoietic compartment [38]. In contrast, Kveiborg et al. have demonstrated that the induction of osteoblast differentiation by overexpression of ΔFosB in cells of the osteoblast lineage did not affect the number of marrow adipocytes [39]. Although both studies provide valuable insight into the understanding of the relationship between osteoblast and adipocyte differentiation, some limitations exist that may impact the interpretation of their results. Firstly, a high bone mass phenotype due to increased bone formation in the ApoE-deficient mice used by Tornvig and colleagues could potentially over-ride any anti-osteoblastic activity of troglitazone [38,40]. Kveiborg et al. chose to target relatively late osteoblast progenitors by overexpressing ΔFosB under the control of osteoclacin promoter, which targets a cell population that may possess a limited potential to differentiate toward adipocytes. In contrast, the studies presented here, which demonstrate a clear separation of the pro-adipocytic and anti-osteoblastic activities of netoglitazone, were performed in an animal model previously used to demonstrate that rosiglitazone possessed both activities simultaneously [12].
In summary, netoglitazone appears to be a PPAR-γ ligand that separates the pro-adipocytic and anti-diabetic activities from the anti-bone activity in vivo. This finding suggests that selective PPAR-γ modulators that differentially activate anti-osteoblastic and pro-adipocytic activities, while retaining their beneficial effects on insulin sensitization are feasible. The in vivo activity of this novel class of PPAR-γ ligands may be of clinical relevance. For example, patients with type 2 diabetes mellitus, who have a higher risk of falls and loose bone at higher rate than non-diabetics [41,42], may be at an increased risk of additional bone loss if treated with conventional thiazolidinediones, such as rosiglitazone. Further detailed clinical studies are required to provide important information regarding the potential risk to the skeleton of patients who receive glitazone therapy.
Acknowledgments
The authors wish to thank Adam Carver, a summer medical student, for microCT scanning, Nisreen Akel for DEXA scans and analysis, and Kui Teng for an analysis of gene expression using real time PCR. This work was supported by National Institute on Aging Grant R01AG17482 and American Diabetes Association Research Grant 1-03-RA-46, to BL-C.
References
- 1.Stumvoll M, Haring HU. Glitazones: clinical effects and molecular mechanisms. Ann Med. 2002;34:217–24. [PubMed] [Google Scholar]
- 2.Werner AL, Travaglini MT. A review of rosiglitazone in type 2 diabetes mellitus. Pharmacotherapy. 2001;21:1082–99. doi: 10.1592/phco.21.13.1082.34615. [DOI] [PubMed] [Google Scholar]
- 3.Reginato MJ, Bailey ST, Krakow SL, Minami C, Ishii S, Tanaka H, et al. A potent antidiabetic thiazolidinedione with unique peroxisome proliferator-activated receptor gamma-activating properties. J Biol Chem. 1998;273:32679–84. doi: 10.1074/jbc.273.49.32679. [DOI] [PubMed] [Google Scholar]
- 4.Sorbera LA, Castaner J, del Fresno M, Silvestre J. Netoglitazone. Antidiabetic PPARα/PPARγ agonist Drugs Future. 2002;27:132–9. [Google Scholar]
- 5.Pickavance L, Widdowson PS, King P, Ishii S, Tanaka H, Williams G. The development of overt diabetes in young Zucker Diabetic Fatty (ZDF) rats and the effects of chronic MCC-555 treatment. Br J Pharmacol. 1998;125:767–70. doi: 10.1038/sj.bjp.0702158. [DOI] [PMC free article] [PubMed] [Google Scholar]
- 6.Upton R, Widdowson PS, Ishii S, Tanaka H, Williams G. Improved metabolic status and insulin sensitivity in obese fatty (fa/fa) Zucker rats and Zucker Diabetic Fatty (ZDF) rats treated with the thiazolidinedione, MCC-555. Br J Pharmacol. 1998;125:1708–14. doi: 10.1038/sj.bjp.0702245. [DOI] [PMC free article] [PubMed] [Google Scholar]
- 7.Jiang Y, Jahagirdar BN, Reinhardt RL, Schwartz RE, Keene CD, Ortiz-Gonzalez XR, et al. Pluripotency of mesenchymal stem cells derived from adult marrow. Nature. 2002;418:41–9. doi: 10.1038/nature00870. [DOI] [PubMed] [Google Scholar]
- 8.Bianco P, Riminucci M, Gronthos S, Robey PG. Bone marrow stromal stem cells: nature, biology, and potential applications. Stem Cells. 2001;19:180–92. doi: 10.1634/stemcells.19-3-180. [DOI] [PubMed] [Google Scholar]
- 9.Beresford JN, Bennett JH, Devlin C, Leboy PS, Owen ME. Evidence for an inverse relationship between the differentiation of adipocytic and osteogenic cells in rat marrow stromal cell cultures. J Cell Sci. 1992;102:341–51. doi: 10.1242/jcs.102.2.341. [DOI] [PubMed] [Google Scholar]
- 10.Moerman EJ, Teng K, Lipschitz DA, Lecka-Czernik B. Aging activates adipogenic and suppresses osteogenic programs in mesenchymal marrow stroma/stem cells: the role of PPAR-gamma2 transcription factor and TGF-beta/BMP signaling pathways. Aging Cell. 2004;3:379–89. doi: 10.1111/j.1474-9728.2004.00127.x. [DOI] [PMC free article] [PubMed] [Google Scholar]
- 11.Lecka-Czernik B, Gubrij I, Moerman EA, Kajkenova O, Lipschitz DA, Manolagas SC, et al. Inhibition of Osf2/Cbfa1 expression and terminal osteoblast differentiation by PPAR-gamma 2. J Cell Biochem. 1999;74:357–71. [PubMed] [Google Scholar]
- 12.Rzonca SO, Suva LJ, Gaddy D, Montague DC, Lecka-Czernik B. Bone is a target for the antidiabetic compound rosiglitazone. Endocrinology. 2004;145:401–6. doi: 10.1210/en.2003-0746. [DOI] [PMC free article] [PubMed] [Google Scholar]
- 13.Sottile V, Seuwen K, Kneissel M. Enhanced marrow adipogenesis and bone resorption in estrogen-deprived rats treated with the PPAR-gamma agonist BRL49653 (rosiglitazone) Calcif Tissue Int. 2004;75:329–37. doi: 10.1007/s00223-004-0224-8. [DOI] [PubMed] [Google Scholar]
- 14.Soroceanu MA, Miao D, Bai XY, Su H, Goltzman D, Karaplis AC. Rosiglitazone impacts negatively on bone by promoting osteoblast/osteocyte apoptosis. J Endocrinol. 2004;183:203–16. doi: 10.1677/joe.1.05723. [DOI] [PubMed] [Google Scholar]
- 15.Cock TA, Back J, Elefteriou F, Karsenty G, Kastner P, Chan S, et al. Enhanced bone formation in lipodystrophic PPARgamma(hyp/hyp) mice relocates haematopoiesis to the spleen. EMBO Rep. 2004;5:1007–12. doi: 10.1038/sj.embor.7400254. [DOI] [PMC free article] [PubMed] [Google Scholar]
- 16.Ali AA, Weinstein RS, Stewart SA, Parfitt AM, Manolagas SC, Jilka RL. Rosiglitazone causes bone loss in mice by suppressing osteoblast differentiation and bone formation. Endocrinology. 2004:1226–35. doi: 10.1210/en.2004-0735. [DOI] [PubMed] [Google Scholar]
- 17.Akune T, Ohba S, Kamekura S, Yamaguchi M, Chung UI, Kubota N, et al. PPARgamma insufficiency enhances osteogenesis through osteoblast formation from bone marrow progenitors. J Clin Invest. 2004;113:846–55. doi: 10.1172/JCI19900. [DOI] [PMC free article] [PubMed] [Google Scholar]
- 18.Ogawa S, Urano T, Hosoi T, Miyao M, Hoshino S, Fujita M, et al. Association of bone mineral density with a polymorphism of the peroxisome proliferator-activated receptor gamma gene: PPARgamma expression in osteoblasts. Biochem Biophys Res Commun. 1999;260:122–6. doi: 10.1006/bbrc.1999.0896. [DOI] [PubMed] [Google Scholar]
- 19.Lecka-Czernik B, Moerman EJ, Grant DF, Lehmann JM, Manolagas SC, Jilka RL. Divergent effects of selective peroxisome proliferator-activated receptor-gamma 2 ligands on adipocyte versus osteoblast differentiation. Endocrinology. 2002;143:2376–84. doi: 10.1210/endo.143.6.8834. [DOI] [PubMed] [Google Scholar]
- 20.Willson TM, Lambert MH, Kliewer SA. Peroxisome proliferator-activated receptor gamma and metabolic disease. Annu Rev Biochem. 2001;70:341–67. doi: 10.1146/annurev.biochem.70.1.341. [DOI] [PubMed] [Google Scholar]
- 21.Xiao ZS, Thomas R, Hinson TK, Quarles LD. Genomic structure and isoform expression of the mouse, rat and human Cbfa1/Osf2 transcription factor. Gene. 1998;214:187–97. doi: 10.1016/s0378-1119(98)00227-3. [DOI] [PubMed] [Google Scholar]
- 22.Lecka-Czernik B, Moerman EJ, Shmookler Reis RJ, Lipschitz DA. Cellular and molecular biomarkers indicate precocious in vitro senescence in fibroblasts from SAMP6 mice. Evidence supporting a murine model of premature senescence and osteopenia. J Gerontol A Biol Sci Med Sci. 1997;52:B331–6. doi: 10.1093/gerona/52a.6.b331. [DOI] [PubMed] [Google Scholar]
- 23.Ducy P, Zhang R, Geoffroy V, Ridall AL, Karsenty G. Osf2/Cbfa1: a transcriptional activator of osteoblast differentiation. Cell. 1997;89:747–54. doi: 10.1016/s0092-8674(00)80257-3. [DOI] [PubMed] [Google Scholar]
- 24.Wolff GL, Roberts DW, Mountjoy KG. Physiological consequences of ectopic agouti gene expression: the yellow obese mouse syndrome. Physiol Genomics. 1999;1:151–63. doi: 10.1152/physiolgenomics.1999.1.3.151. [DOI] [PubMed] [Google Scholar]
- 25.Fluckey JD, Dupont-Versteegden EE, Montague DC, Knox M, Tesch P, Peterson CA, et al. A rat resistance exercise regimen attenuates losses of musculoskeletal mass during hindlimb suspension. Acta Physiol Scand. 2002;176:293–300. doi: 10.1046/j.1365-201X.2002.01040.x. [DOI] [PubMed] [Google Scholar]
- 26.Hildebrand T, Ruegsegger P. Quantification of bone microarchitecture with the structure model index. Comput Methods Biomech Biomed Eng. 1997;1:15–23. doi: 10.1080/01495739708936692. [DOI] [PubMed] [Google Scholar]
- 27.Amblard D, Lafage-Proust MH, Laib A, Thomas T, Ruegsegger P, Alexandre C, et al. Tail suspension induces bone loss in skeletally mature mice in the C57BL/6J strain but not in the C3H/HeJ strain. J Bone Miner Res. 2003;18:561–9. doi: 10.1359/jbmr.2003.18.3.561. [DOI] [PubMed] [Google Scholar]
- 28.Bendre MS, Gaddy-Kurten D, Mon-Foote T, Akel NS, Skinner RA, Nicholas RW, et al. Expression of interleukin 8 and not parathyroid hormone-related protein by human breast cancer cells correlates with bone metastasis in vivo. Cancer Res. 2002;62:5571–9. [PubMed] [Google Scholar]
- 29.Balcerzak M, Hamade E, Zhang L, Pikula S, Azzar G, Radisson J, et al. The roles of annexins and alkaline phosphatase in mineralization process. Acta Biochim Pol. 2003;50:1019–38. [PubMed] [Google Scholar]
- 30.Lehmann JM, Moore LB, Smith-Oliver TA, Wilkison WO, Willson TM, Kliewer SA. An antidiabetic thiazolidinedione is a high affinity ligand for peroxisome proliferator-activated receptor gamma (PPAR gamma) J Biol Chem. 1995;270:12953–6. doi: 10.1074/jbc.270.22.12953. [DOI] [PubMed] [Google Scholar]
- 31.Li AC, Brown KK, Silvestre MJ, Wilson TM, Palinski W, Glass CK. Peroxisome proliferator-activated receptor γ ligands inhibit development of atherosclerosis in LDL receptor-deficient mice. J Clin Invest. 2000;106:523–31. doi: 10.1172/JCI10370. [DOI] [PMC free article] [PubMed] [Google Scholar]
- 32.Frias JP, Yu JG, Kruszynska YT, Olefsky JM. Metabolic effects of troglitazone therapy in type 2 diabetic, obese, and lean normal subjects. Diabetes Care. 2000;23:64–9. doi: 10.2337/diacare.23.1.64. [DOI] [PubMed] [Google Scholar]
- 33.Diamant M, Heine RJ. Thiazolidinediones in type 2 diabetes mellitus: current clinical evidence. Drugs. 2003;63:1373–405. doi: 10.2165/00003495-200363130-00004. [DOI] [PubMed] [Google Scholar]
- 34.Gillies PS, Dunn CJ. Pioglitazone. Drugs. 2000;60:333–43. doi: 10.2165/00003495-200060020-00009. (discussion 344–5) [DOI] [PubMed] [Google Scholar]
- 35.Bennett CN, Longo KA, Wright WS, Suva LJ, Lane TF, Hankenson KD, et al. Regulation of osteoblastogenesis and bone mass by Wnt10b. Proc Natl Acad Sci U S A. 2005;102:3324–9. doi: 10.1073/pnas.0408742102. [DOI] [PMC free article] [PubMed] [Google Scholar]
- 36.Nuttall ME, Gimble JM. Is there a therapeutic opportunity to either prevent or treat osteopenic disorders by inhibiting marrow adipogenesis? Bone. 2000;27:177–84. doi: 10.1016/s8756-3282(00)00317-3. [DOI] [PubMed] [Google Scholar]
- 37.Gimble JM, Nuttall ME. Bone and fat: old questions, new insights. Endocrine. 2004;23:183–8. doi: 10.1385/ENDO:23:2-3:183. [DOI] [PubMed] [Google Scholar]
- 38.Tornvig L, Mosekilde LI, Justesen J, Falk E, Kassem M. Troglitazone treatment increases bone marrow adipose tissue volume but does not affect trabecular bone volume in mice. Calcif Tissue Int. 2001;69:46–50. doi: 10.1007/s002230020018. [DOI] [PubMed] [Google Scholar]
- 39.Kveiborg M, Sabatakos G, Chiusaroli R, Wu M, Philbrick WM, Horne WC, et al. DeltaFosB induces osteosclerosis and decreases adipogenesis by two independent cell-autonomous mechanisms. Mol Cell Biol. 2004;24:2820–30. doi: 10.1128/MCB.24.7.2820-2830.2004. [DOI] [PMC free article] [PubMed] [Google Scholar]
- 40.Schilling AF, Schinke T, Munch C, Gebauer M, Niemeier A, Priemel M, et al. Increased bone formation in mice lacking apolipoprotein E. J Bone Miner Res. 2005;20:274–82. doi: 10.1359/JBMR.041101. [DOI] [PubMed] [Google Scholar]
- 41.Schwartz AV, Hillier TA, Sellmeyer DE, Resnick HE, Gregg E, Ensrud KE, et al. Older women with diabetes have a higher risk of falls: a prospective study. Diabetes Care. 2002;25:1749–54. doi: 10.2337/diacare.25.10.1749. [DOI] [PubMed] [Google Scholar]
- 42.Schwartz AV, Sellmeyer DE, Strotmeyer ES, Tylavsky FA, Feingold KR, Resnick HE, et al. Diabetes and bone loss at the hip in older black and white adults. J Bone Miner Res. 2005;20:596–603. doi: 10.1359/JBMR.041219. [DOI] [PubMed] [Google Scholar]