

Abstract
We have examined the relationships between dementia, loss of synaptic proteins, changes in the cytoskeleton, and deposition of β-amyloid plaques in the neocortex in a clinicopathologically staged epidemiological cohort using a combination of biochemical and morphometric techniques. We report that loss of synaptic proteins is a late-stage phenomenon, occurring only at Braak stages 5 and 6, or at moderate to severe clinical grades of dementia. Loss of synaptic proteins was seen only after the emergence of the full spectrum of tau and β-amyloid pathology in the neocortex at stage 4, but not in the presence of β-amyloid plaques alone. Contrary to previous studies, we report increases in the levels of synaptophysin, syntaxin, and SNAP-25 at stage 3 and of α-synuclein and MAP2 at stage 4. Minimal and mild clinical grades of dementia were associated with either unchanged or elevated levels of synaptic proteins in the neocortex. Progressive aggregation of paired helical filament (PHF)-tau protein could be detected biochemically from stage 2 onwards, and this was earliest change relative to the normal aging background defined by Braak stage 1 that we were able to detect in the neocortex. These results are consistent with the possibility that failure of axonal transport associated with early aggregation of tau protein elicits a transient adaptive synaptic response to partial de-afferentation that may be mediated by trophic factors. This early abnormality in cytoskeletal function may contribute directly to the earliest clinically detectable stages of dementia.
Attempts to define critical steps in the neurobiological progression of Alzheimer’s disease (AD) in the human brain have been hampered by case selection methods that compare controls with cases meeting clinical or neuropathological criteria for AD. This has the effect of confounding individuals with intact cognitive functioning and minimal (preclinical) cognitive decline versus those with intermediate and advanced stages of the disease and made it difficult to determine the natural history of the neurobiology of AD as it occurs in the human brain. The advent of robust clinical and neuropathological staging tools used in an epidemiological setting makes it possible to use a cross-sectional study design to advance some way toward this objective. The problem of obtaining cases at early stages of AD is solved by defining an epidemiological cohort, in which cases are followed longitudinally to postmortem irrespective of clinical status. As cases come to postmortem at all clinical and neuropathological stages, it is then possible to build up a cross-sectional picture of disease progression.
We have implemented this strategy in a community-based cohort of postmortem cases defined in the course of a prospective epidemiological study of cognitive decline in the aging population. 1-3 To define the progression of AD in this sample empirically, we have developed analytical tools to measure a range of molecular changes in human postmortem brain tissues. 4-11 Initial neuropathological investigations of these cases have been reported previously. We showed that 90% of the cases conformed to the neuropathological staging proposed by Braak and Braak, 12 and that only 10% of the cases were at the extremes of pathology as represented by Braak stages 1 and 6. In the present study, we have combined neuropathological Braak staging with clinical staging during life as defined by CAMDEX 13 to provide an empirical framework for staging the neurobiology of AD in human isocortex.
In the present study, we have sought to examine the sequence of changes affecting synaptic proteins in the association neocortex in relation to changes in the cytoskeleton and deposition of β-amyloid plaques. The association neocortex provides a particularly useful anatomical substrate for this purpose. First, synapse loss in frontal and temporal neocortex has been proposed as the principal biological correlate of clinical dementia. 14,15 Second, and much more important, neurofibrillary degeneration does not become prominent in these regions until Braak stages 5 and 6. Therefore, the changes occurring in neocortex at Braak stages 1 to 4 could provide an insight into early events in the neurobiology of AD before the later phases of neurofibrillary degeneration.
Materials and Methods
Case Material
The brain tissue used in the present study was derived from 48 patients (33 women and 15 men) in the Cambridge Project for Later Life. 1-3 In addition to prospective clinical and neuropsychological assessments, these individuals agreed to donate their brain tissue for research purposes. 16 They have been fully characterized in earlier neuropathological studies (Table 1) ▶ . 17,18 The group consisted of 14 individuals with no cognitive impairment, seven with a definite diagnosis of cerebrovascular dementia, 19 20 with AD, five with mixed dementia, 19 one with progressive supranuclear palsy, and one with chronic delirium. Two cases from the 50 reported previously 17,18 were excluded from the present study because of lack of frozen brain tissue samples.
Table 1.
Distribution of Cases According to Braak Stage and Clinical Severity (CLINSEV)
| CLINSEV/Braak Stage | 0 | 1 | 2 | 3 | 4 | Total |
|---|---|---|---|---|---|---|
| 1 | 1 | 1 | 1 | 3 | ||
| 2 | 5 | 1 | 1 | 1 | 8 | |
| 3 | 4 | 4 | 3 | 4 | 15 | |
| 4 | 4 | 3 | 3 | 10 | ||
| 5 | 2 | 2 | 4 | 3 | 11 | |
| 6 | 1 | 1 | ||||
| Total | 14 | 6 | 10 | 9 | 9 | 48 |
A total number of 48 individuals were included in the analyses. Numbers within the cells denote the number of individuals characterized by BST and clinical severity. All individuals were with similar age at death irrespective of BST (F = 1.53, P = 0.200) or clinical severity (F = 1.17, P = 0.336).
The patients, all older than the age of 75 years at the beginning of the study, were followed at three time points: at 2.4, 6.0, and 10.0 years after the beginning of the study. Clinical status within the last 12 months before death was determined either by direct assessment or by retrospective informant interview. The average age at death was 88.65 ± 0.57 years (means ± SEM), with no differences between the age at death for the female and male patients (88.36 ± 0.77 and 89.27 ± 0.76 years for women and men, respectively). All individuals included in the analysis have undergone a similar process of collection of the brain tissue, and the postmortem interval was similar in the subgroups defined according to different Braak stages (F = 1.55, P = 0.196) or clinical severity (F = 0.39, P = 0.813).
Tissue Sampling and Morphometric Analysis
At the time of limited autopsy, one cerebral hemisphere and the contralateral cerebellar hemisphere were fixed, whereas the remaining hemisphere was sliced into 1-cm-thick slices in the coronal plane and snap-frozen. The brain sampling was performed on these frozen sections, taking the gray matter of the association areas of the frontal (BA9 and BA10) and temporal (BA22 and BA23) neocortical areas. Uniformity of sampling was maintained by using internal neuroanatomical markers when taking tissue from the frozen slices, ie, head of caudate and the beginning of ventricles (for the frontal areas) and the junction between amygdala and hippocampus (for temporal and medial temporal lobe areas). Neuropathological staging was performed by two neuropathologists (JX and HG) according to the criteria of Braak and Braak. 12 The morphometric analyses have been described previously. 17,18 Sections (7-μm thick) were cut and stained with hematoxylin and eosin to assess nerve cell loss, gliosis, and ischemic change, whereas Congo red was used to assess vascular amyloid deposits. The Campbell silver staining method and immunohistochemistry with a monoclonal antibody against Aβ (a gift from Dr. M. Landon, Nottingham University, Nottingham, UK), were used to demonstrate β-amyloid deposits, and monoclonal antibody (mAb) 11.57 was used for labeling neurofibrillary pathology.
Biochemical Analysis and Enzyme-Linked Immunoassays (ELISA)
In all experiments, 0.3 g to 0.5 g of frozen brain tissue was used. The brain tissue was homogenized in 0.32 mol/L sucrose, and the homogenate divided into two equal portions. One portion was processed through the A68 protocol, containing the synaptosomal preparation, and the other through the if-II protocol as described. 10
Phosphorylated Tau and Synaptosomal Protocol
After homogenization, an equal volume of 1 mol/L NaCl was added to the brain homogenate, and this material was centrifuged at 13,000 × g for 15 minutes. The supernatant was used for preparation of synaptosomes (containing synaptophysin, syntaxin, and SNAP-25), according to the protocol of Alford et al. 20 The pellet was rehomogenized in 0.32 mol/L sucrose, and an equal volume of buffer containing 2 mol/L NaCl, 1 mmol/L MgCl2, 2 mmol/L EGTA, 0.32 mol/L sucrose, 200 mmol/L MES, (pH 6.5), was added, followed by centrifugation in a Beckman TL100 ultracentrifuge at 25,000 × g for 15 minutes at 4°C. The supernatant was removed and sarkosyl was added to a final concentration of 1%; the mixture was incubated with gentle rotation at 25°C for 1 hour. It was then centrifuged at 200,000 × g for 30 minutes at 4°C. The supernatant was discarded, and the pellet (A68) was retained for analysis of sarkosyl-insoluble phosphorylated tau protein.
PHF-Tau and Soluble Tau/MAP2 Protocol
The brain homogenate was centrifuged at 85,000 × g for 15 minutes. The supernatant was used to prepare the S1 fraction containing heat stable proteins as described previously. 4,6,7 Soluble phosphorylated tau (mAb AT8) and synuclein (pAb PER2) immunoreactivity were measured in the S1 fraction. The pellet was suspended in 0.5 mol/L sucrose, centrifuged at 233,000 × g for 1 hour at 15°C. The pellet was resuspended in 0.5 mol/L sucrose again, and divided into two equal portions. Half was digested with Pronase (2 mg/ml final concentration) for 1 hour at 37°C. Both halves were then centrifuged at 233,000 × g for 1 hour. The pellets were suspended in 500 μl of NH4HCO3 (50 mmol/L, pH 8.0) and analyzed for PHF-tau content with mAb 423 (after Pronase digestion) or with mAbs 7.51 and AT8 (after formic acid treatment). 10
Immunoassays
The levels of synaptophysin, syntaxin, and SNAP-25 were determined using an indirect ELISA, with mAbs EP10 (1:10), SP8 (1:100), and SP12 (1:100), respectively. These antibodies have been characterized previously 21 and their immunoreactivity has been shown to be independent of postmortem delay. 22 The level of synuclein was also determined in an indirect ELISA, using a polyclonal serum PER2 (1:2,000) raised against the C-terminal portion of the α-synuclein molecule, and its characteristics have been described previously. 23 The level of MAP2 protein was determined using a competitive ELISA, with a mAb C (1:2,000), 24 with a synthetic peptide corresponding to MAP2c sequence (50 ng/ml) serving as a solid phase (a gift from Dr. A. Matus, Freidrich Miescher Institut, Basel, Switzerland). Each sample was analyzed in triplicate at six dilutions, and assay curves were plotted using Softmax, version 2.0 (Molecular Devices Corp., Sunnyvale, CA). All values have been normalized for 0.3-ml fraction from 0.3 g to 0.5 g brain tissue and expressed as relative arbitrary units of immunoreactivity.
Statistical Analysis
PHF-tau, phosphorylated tau, and pathological variables were log-transformed before analysis [value = ln (value + 1)], as these have been shown previously to increase exponentially with disease progression. 11 Synaptic protein markers and MAP2 were not log-transformed. All variables were grouped either according to Braak stage or CAMDEX clinical stage and analyzed according to a uniform one-factor orthogonal matrix structure by classical analysis of variance allowing for two repeated measures (frontal and temporal region) per case. Values for mean square error, F, P, mean difference, and 95% confidence interval of the difference are tabulated. These analyses were supplemented by one-sample t-tests to determine deviations of PHF-tau values from zero in nondemented patients. In correlational analyses, Pearson’s r was calculated for continuous data (PHF-tau measures) and Kendall’s τ for correlations determined with respect to categorical variables (Braak stage and clinical severity). The analysis of variance analyses were undertaken using the Unistat Version 3 statistical package (Unistat Ltd., UK), and other supplementary analyses used SYSTAT-6 for Windows (SPSS, Chicago, IL).
Results
Neuropathological Findings
As expected, association neocortex was essentially free of neurofibrillary tangles, τ-immunoreactive neuritic plaques and neuropil threads at Braak stages 1 to 3. Likewise, no significant changes in counts of β-amyloid plaques were detected at stages 1 to 3. The significant increase in β-amyloid plaques and the whole spectrum of τ-reactive pathology were first observed at stage 4 (Figure 1 ▶ ; Table 2 ▶ ). Therefore, histological involvement of association neocortex is relatively late in terms of the classical histological hallmarks of AD.
Figure 1.
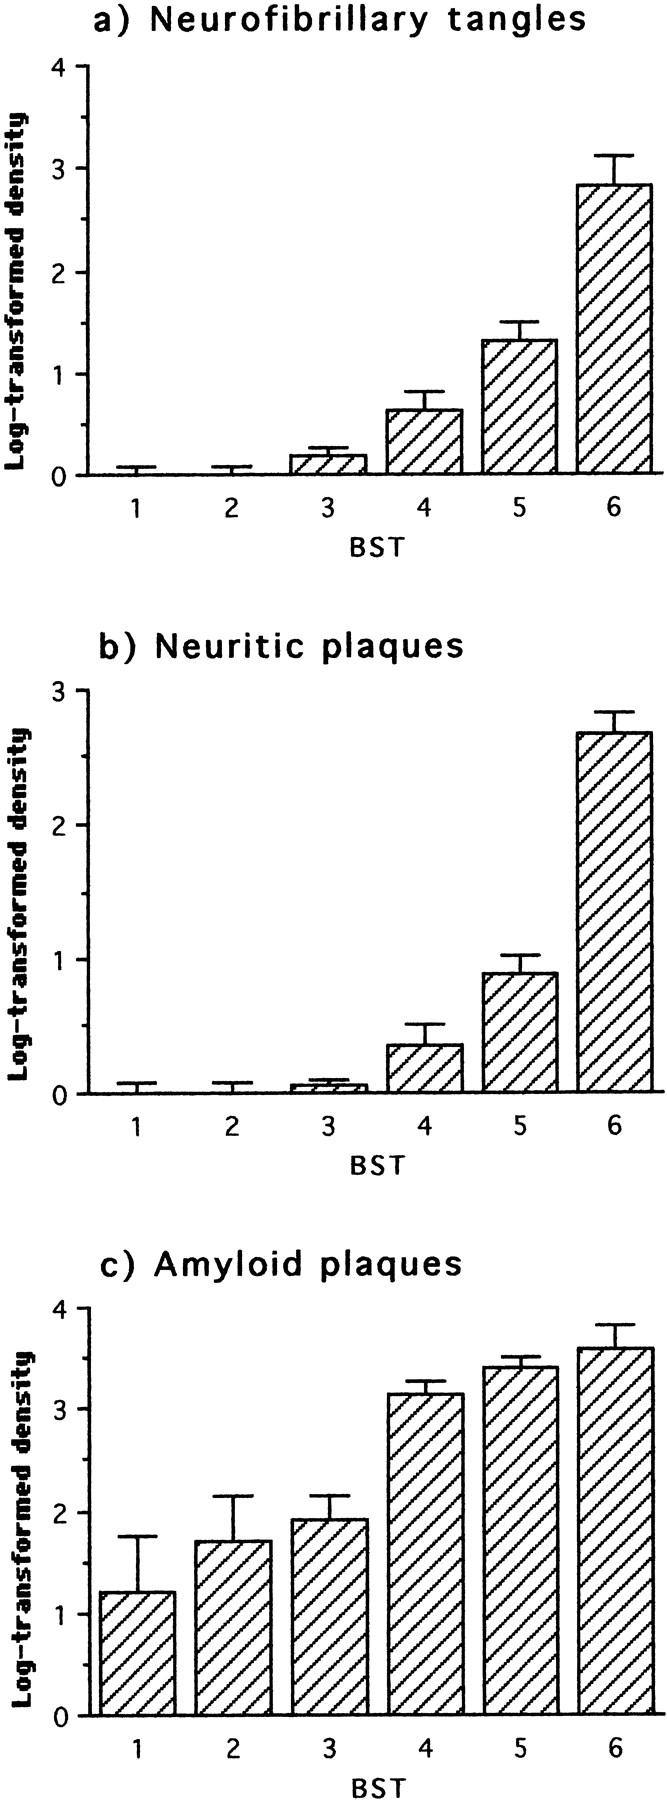
Neuropathological changes in frontal and temporal cortex with respect to Braak stage (BST). The first statistically significant deviation relative to the preceding stage(s) occurred at stage 4 for all parameters.
Table 2.
Analysis of Variance in Biochemical and Neuropathological Changes in Neocortex with Respect to Braak Stage
| Braak stage | Parameter | df | Error | F | P | Mean diff. | C.I. | ||
|---|---|---|---|---|---|---|---|---|---|
| 1,2,3,4,5,6 | PHF-tau | 423 | 5 | 3.15 | 18.35 | 0.000 | |||
| 7.51 | 5 | 3.70 | 13.13 | 0.000 | |||||
| AT8 | 5 | 2.64 | 14.93 | 0.000 | |||||
| Phosphorylated tau | Sarkosyl AT8 | 5 | 2.03 | 15.84 | 0.000 | ||||
| Soluble AT8 | 5 | 0.73 | 4.70 | 0.001 | |||||
| Synaptic proteins | Synaptophysin | 5 | 500.74 | 2.36 | 0.047 | ||||
| Syntaxin | 5 | 667.50 | 2.48 | 0.038 | |||||
| SNAP-25 | 5 | 343.51 | 2.74 | 0.024 | |||||
| α-Synuclein | 5 | 782.68 | 2.41 | 0.043 | |||||
| MAP2 | S1C | 5 | 152.29 | 4.36 | 0.001 | ||||
| Pathology | Tangles | 5 | 0.32 | 20.00 | 0.000 | ||||
| Neuritic plaques | 5 | 0.15 | 27.15 | 0.000 | |||||
| Aβ Plaques | 5 | 1.40 | 8.00 | 0.000 | |||||
| 1 v 2 | PHF-tau | 423 | 1 | 1.28 | 8.85 | 0.008 | 1.49 | 0.62 | 2.36 |
| 7.51 | 1 | 0.98 | 6.79 | 0.017 | 1.14 | 0.44 | 1.84 | ||
| AT8 | 1 | 0.43 | 11.28 | 0.003 | 0.98 | 0.44 | 1.52 | ||
| Phosphorylated tau | Sarkosyl AT8 | 1 | 1.92 | 0.19 | 0.671 | 0.27 | −1.02 | 1.55 | |
| Soluble AT8 | 1 | 1.11 | 0.17 | 0.689 | −0.19 | −1.28 | 0.91 | ||
| Synaptic proteins | Synaptophysin | 1 | 214.05 | 0.11 | 0.747 | −2.12 | −13.51 | 9.27 | |
| Syntaxin | 1 | 315.42 | 0.54 | 0.472 | 5.78 | −10.46 | 22.02 | ||
| SNAP-25 | 1 | 153.60 | 0.70 | 0.412 | 4.61 | −5.15 | 14.36 | ||
| α-Synuclein | 1 | 107.22 | 1.02 | 0.324 | −4.64 | −16.37 | 7.08 | ||
| MAP2 | S1C | 1 | 121.81 | 2.56 | 0.126 | −7.83 | −21.80 | 6.15 | |
| Pathology | Tangles | 1 | 0.00 | ||||||
| Neuritic plaques | 1 | 0.00 | |||||||
| Aβ Plaques | 1 | 2.63 | 0.45 | 0.510 | 0.48 | −0.96 | 1.93 | ||
| 1,2 v 3 | PHF-tau | 423 | 1 | 2.22 | 0.48 | 0.493 | 0.29 | −0.61 | 1.19 |
| 7.51 | 1 | 3.05 | 6.90 | 0.012 | 1.29 | 0.39 | 2.19 | ||
| AT8 | 1 | 1.91 | 5.13 | 0.028 | 0.88 | 0.15 | 1.61 | ||
| Phosphorylated tau | Sarkosyl AT8 | 1 | 1.80 | 1.45 | 0.234 | 0.45 | −0.30 | 1.221 | |
| Soluble AT8 | 1 | 0.81 | 3.25 | 0.078 | 0.46 | −0.07 | 0.98 | ||
| Synaptic proteins | Synaptophysin | 1 | 488.70 | 7.14 | 0.010 | 16.57 | 5.18 | 27.97 | |
| Syntaxin | 1 | 638.56 | 9.27 | 0.004 | 21.59 | 8.46 | 34.72 | ||
| SNAP-25 | 1 | 319.56 | 8.30 | 0.006 | 14.45 | 5.01 | 23.89 | ||
| α-Synuclein | 1 | 185.65 | 0.88 | 0.353 | 3.59 | −3.58 | 10.76 | ||
| MAP2 | S1C | 1 | 137.31 | 0.00 | 0.975 | 0.10 | −6.66 | 6.87 | |
| Pathology | Tangles | 1 | 0.14 | 3.30 | 0.075 | 0.19 | 0.01 | 0.37 | |
| Neuritic plaques | 1 | 0.03 | 1.41 | 0.241 | 0.06 | −0.03 | 0.15 | ||
| Aβ Plaques | 1 | 2.20 | 0.90 | 0.347 | 0.39 | −0.45 | 1.24 | ||
| 1,2,3 v 4 | PHF-tau | 423 | 1 | 3.39 | 11.71 | 0.001 | 1.80 | 0.15 | 3.45 |
| 7.51 | 1 | 4.06 | 8.34 | 0.005 | 1.66 | 0.21 | 3.11 | ||
| AT8 | 1 | 2.33 | 12.05 | 0.001 | 1.52 | 0.39 | 2.64 | ||
| Phosphorylated tau | Sarkosyl AT8 | 1 | 2.02 | 23.18 | 0.000 | 1.95 | 0.99 | 2.92 | |
| Soluble AT8 | 1 | 0.83 | 0.07 | 0.790 | −0.07 | −0.58 | 0.44 | ||
| Synaptic proteins | Synaptophysin | 1 | 554.88 | 0.40 | 0.532 | −4.23 | −18.33 | 9.86 | |
| Syntaxin | 1 | 747.91 | 0.96 | 0.331 | −7.65 | −24.50 | 9.19 | ||
| SNAP-25 | 1 | 407.53 | 0.25 | 0.617 | 2.90 | −10.50 | 16.30 | ||
| α-Synuclein | 1 | 993.79 | 7.73 | 0.007 | 25.05 | −7.51 | 57.61 | ||
| MAP2 | S1C | 1 | 168.24 | 11.30 | 0.001 | 12.46 | 2.96 | 21.97 | |
| Pathology | Tangles | 1 | 0.23 | 13.37 | 0.001 | 0.50 | 0.10 | 0.91 | |
| Neuritic plaques | 1 | 0.10 | 12.30 | 0.001 | 0.32 | 0.00 | 0.64 | ||
| Aβ Plaques | 1 | 1.75 | 14.03 | 0.000 | 1.42 | 0.94 | 1.90 | ||
| 1,2,3,4 v 5,6 | PHF-tau | 423 | 1 | 3.81 | 57.48 | 0.000 | 3.63 | 2.50 | 4.76 |
| 7.51 | 1 | 4.37 | 38.75 | 0.000 | 3.19 | 2.09 | 4.30 | ||
| AT8 | 1 | 3.18 | 44.04 | 0.000 | 2.90 | 1.72 | 4.08 | ||
| Phosphorylated tau | Sarkosyl AT8 | 1 | 2.59 | 40.24 | 0.000 | 2.50 | 1.65 | 3.35 | |
| Soluble AT8 | 1 | 0.81 | 9.05 | 0.003 | 0.67 | 0.22 | 1.11 | ||
| Synaptic proteins | Synaptophysin | 1 | 542.55 | 0.50 | 0.480 | −4.05 | −15.52 | 7.42 | |
| Syntaxin | 1 | 721.36 | 1.28 | 0.262 | −7.44 | −20.33 | 5.45 | ||
| SNAP-25 | 1 | 367.00 | 3.53 | 0.064 | −8.82 | −17.32 | −0.32 | ||
| α-Synuclein | 1 | 838.12 | 1.76 | 0.189 | −9.41 | −17.65 | −1.17 | ||
| MAP2 | S1C | 1 | 175.47 | 3.96 | 0.050 | −6.47 | −12.14 | −0.80 | |
| Pathology | Tangles | 1 | 0.39 | 62.86 | 0.000 | 1.21 | 0.81 | 1.62 | |
| Neuritic plaques | 1 | 0.23 | 61.03 | 0.000 | 0.91 | 0.56 | 1.26 | ||
| Aβ Plaques | 1 | 1.65 | 16.97 | 0.000 | 1.30 | 0.89 | 1.71 | ||
| 3 v 4,5,6 | PHF-tau | 423 | 1 | 4.48 | 33.27 | 0.000 | 2.98 | 1.84 | 4.12 |
| 7.51 | 1 | 4.96 | 16.80 | 0.000 | 2.23 | 1.11 | 3.35 | ||
| AT8 | 1 | 3.79 | 20.54 | 0.000 | 2.15 | 1.14 | 3.17 | ||
| Phosphorylated tau | Sarkosyl AT8 | 1 | 2.00 | 46.23 | 0.000 | 2.35 | 1.60 | 3.09 | |
| Soluble AT8 | 1 | 0.79 | 0.50 | 0.481 | 0.15 | −0.27 | 0.58 | ||
| Synaptic proteins | Synaptophysin | 1 | 604.37 | 3.81 | 0.055 | −11.72 | −23.82 | 0.39 | |
| Syntaxin | 1 | 766.84 | 6.86 | 0.011 | −17.71 | −31.53 | −3.88 | ||
| SNAP-25 | 1 | 419.29 | 3.69 | 0.059 | −9.60 | −19.76 | 0.55 | ||
| α-Synuclein | 1 | 1081.3 | 0.76 | 0.387 | 6.99 | −7.65 | 21.64 | ||
| MAP2 | S1C | 1 | 199.31 | 0.84 | 0.363 | 3.16 | −3.49 | 9.80 | |
| Pathology | Tangles | 1 | 0.56 | 24.50 | 0.000 | 0.90 | 0.56 | 1.25 | |
| Neuritic plaques | 1 | 0.34 | 22.68 | 0.000 | 0.68 | 0.42 | 0.95 | ||
| Aβ Plaques | 1 | 1.02 | 30.95 | 0.000 | 1.37 | 0.83 | 1.92 | ||
PHF-Tau and Phosphorylated Tau Protein
To determine whether staging based on the progression of pathology outside the neocortex at Braak stages 1 to 4 predicted tau protein changes occurring in the neocortex at these stages, we examined three different measures of PHF-tau accumulation that we have used extensively in previous studies. These were: mAb 7.51 immunoreactivity after formic acid treatment, mAb AT8 immunoreactivity in the PHF fraction prepared without Pronase, and mAb 423 immunoreactivity in the PHF fraction prepared with Pronase. 10,11 These parameters were highly correlated (0.73 < τ < 0.84). Statistically significant increases in all three parameters were first detected at stage 2, and this increased exponentially with respect to stage thereafter (Figure 2 ▶ ; Table 2 ▶ ). All PHF-tau markers were significantly correlated with stage (0.47 < τ < 0.50). Therefore, Braak staging correctly predicts the accumulation of PHF-tau in neocortex well before the appearance of visible histological changes in tau immunoreactivity.
Figure 2.

Immunochemical measurements with respect to Braak stage of PHF-tau using three monoclonal antibodies in the bulk PHF fraction isolated from frontal and temporal cortex. The first statistically significant deviation relative to the preceding stage(s) occurred at stage 2 for all parameters.
We also examined changes in the phosphorylation status of tau protein in soluble and sarkosyl-insoluble fractions using the mAb AT8, as described previously. 10 Sarkosyl-insoluble phosphorylated tau increased significantly at stage 4 (Table 2) ▶ , whereas that in the soluble fraction did not change until stage 6 (Figure 3 ▶ ; Table 2 ▶ ). Therefore, significant increases in non-PHF-bound forms of hyperphosphorylated tau protein appear at least two Braak stages after the onset of insoluble PHF-tau accumulation in the human brain.
Figure 3.
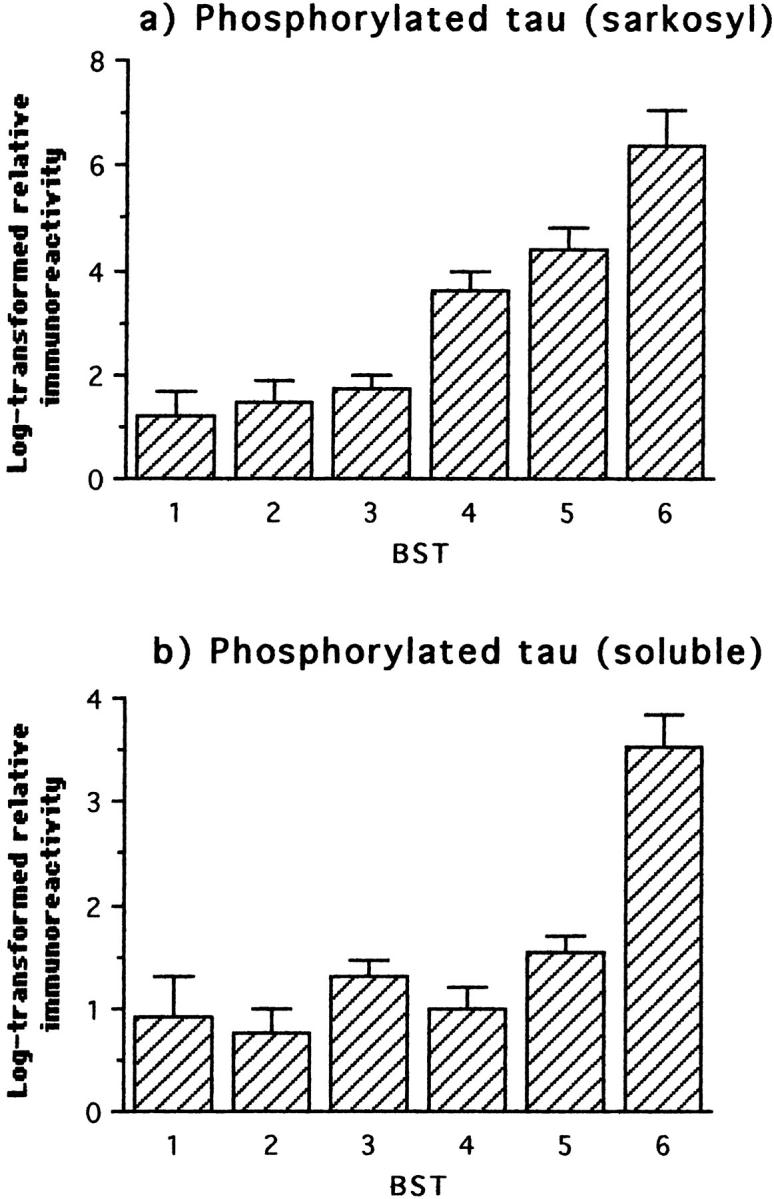
Immunochemical measurements of phosphorylated tau using mAb AT8 in the sarkosyl-insoluble fraction and in the soluble tau fraction from frontal and temporal cortex with respect to Braak stage. The first statistically significant deviation relative to the preceding stage(s) occurred at stage 4 for sarkosyl-insoluble phosphorylated tau, and in the comparison grouping stages 5 and 6 for soluble phosphorylated tau.
Synaptic Proteins
In the light of discrepancies in reports regarding changes in synaptic proteins in AD brain tissue, 14,15,25 we undertook systematic measurements of four distinct synaptic proteins: synaptophysin, syntaxin, SNAP-25, and α-synuclein. The first three showed an essentially identical biphasic profile with respect to neuropathological stage (Figure 4) ▶ . Synaptophysin, syntaxin, and SNAP-25 were significantly increased at stage 3 (Table 2) ▶ , and these levels decreased at more advanced neuropathological stages. Only the decrease in the syntaxin level relative to stage 3 reached statistical significance (Table 2) ▶ . By contrast, the profile for α-synuclein was essentially identical to that of MAP2 (see below).
Figure 4.
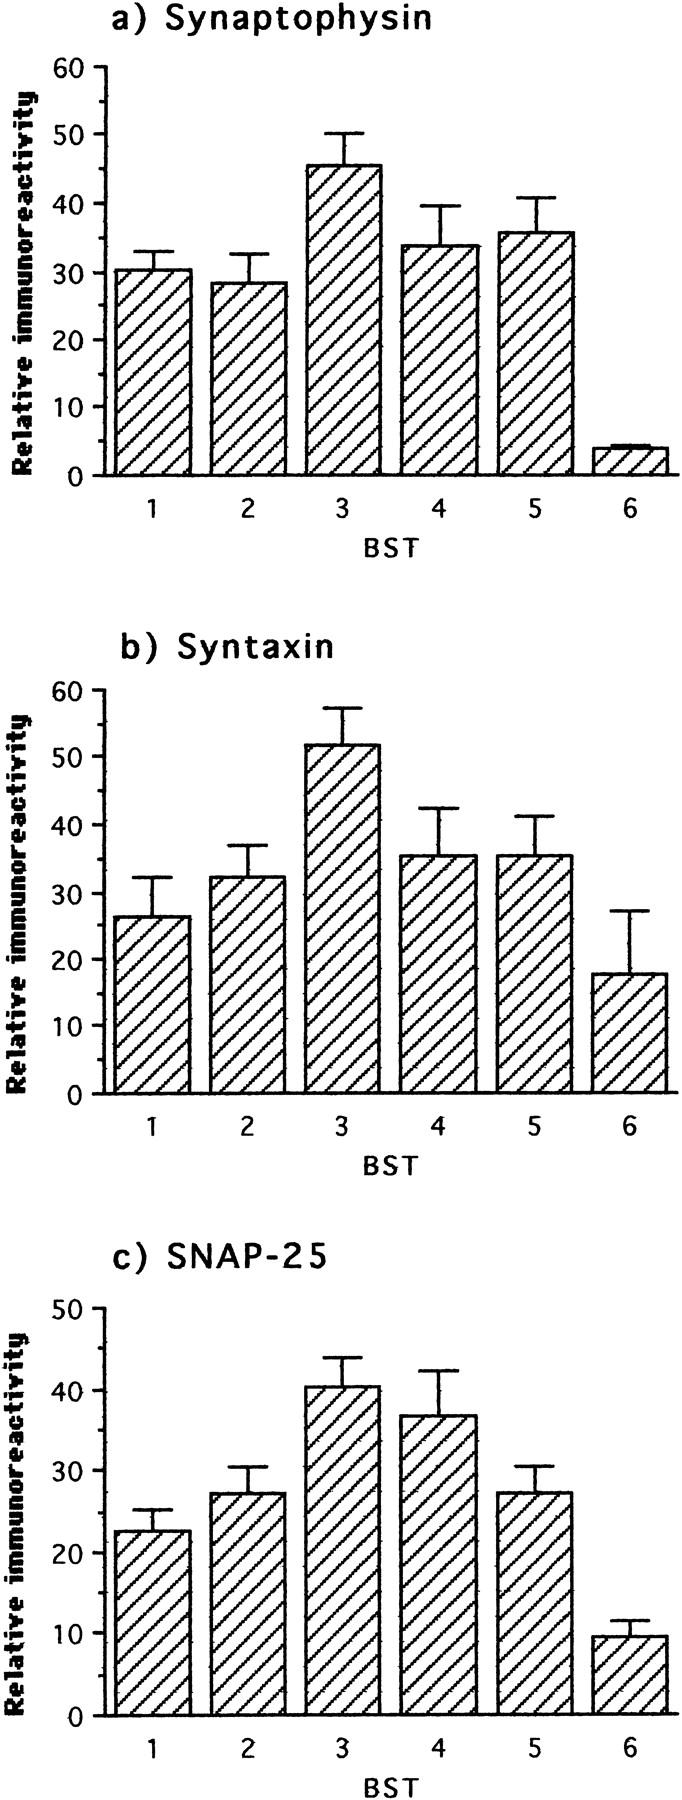
Immunochemical measurements of three synaptic proteins in frontal and temporal cortex with respect to Braak stage. The first statistically significant deviation relative to the preceding stage(s) occurred at stage 3 for all three proteins. In the comparison of stages 4 to 6 with respect to stage 3, only the decline in syntaxin reached statistical significance, although the declines in synaptophysin and SNAP-25 were close to the significance criterion (P < 0.06).
MAP2 Protein and α-Synuclein
We examined levels of MAP2 protein as a marker for change in the dendritic cytoskeleton. In contrast to PHF-tau and phosphorylated tau protein, MAP2 protein underwent a biphasic course similar to that seen for synaptic proteins. In this case, however, a statistically significant increase was not detected until stage 4, with significant declines observed in stages 5 and 6 (Figure 5 ▶ ; Table 2 ▶ ). Interestingly, levels of α-synuclein followed an almost identical course, with a transient and statistically significant increase at stage 4 (Figure 5 ▶ ; Table 2 ▶ ).
Figure 5.
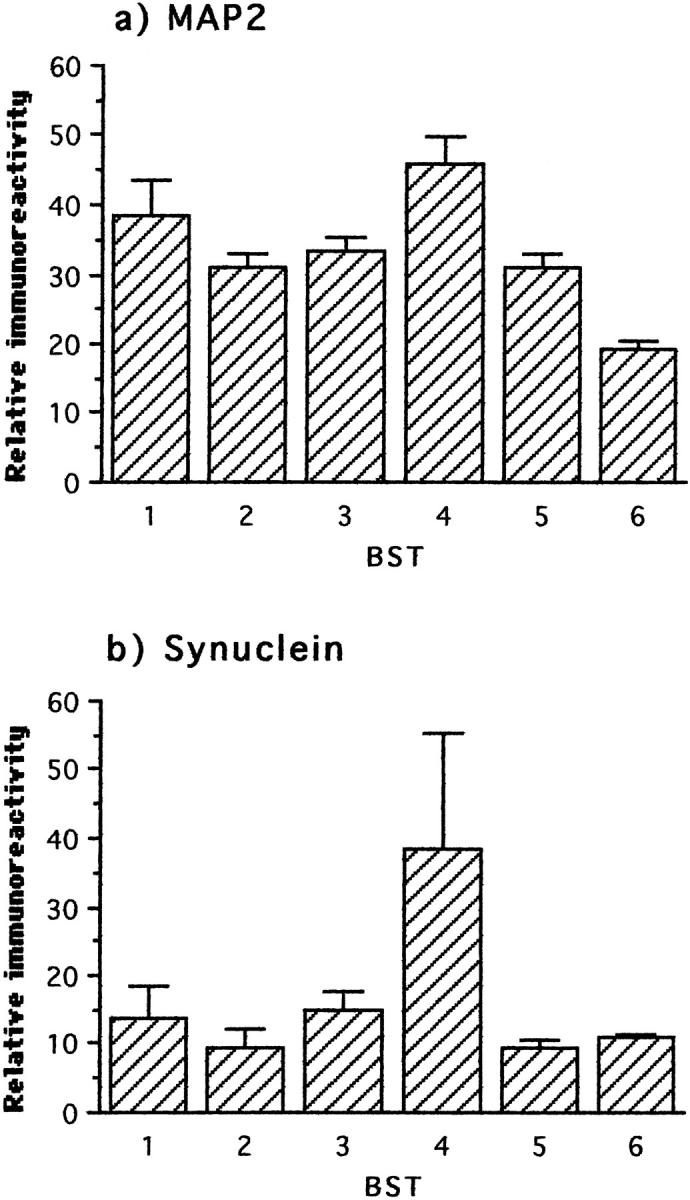
Immunochemical measurements of MAP2 and synuclein in frontal and temporal cortex with respect to Braak stage. The first statistically significant deviation relative to the preceding stage(s) occurred at stage 4 for both parameters and only the decline in MAP2 reached significance after stage 4.
Changes with Respect to Clinical Severity
We undertook an analysis of the data with respect to clinical stage, as measured at the last clinical assessment before death, to relate neurobiological changes to clinical progression. CAMDEX provides five clinical stages: normal, minimal, mild, moderate, and severe. 13 The normal and minimal stages do not meet DSM-III-R criteria for clinical dementia. For the purpose of this analysis, seven cases with vascular dementia were excluded. 17,18 The overall pattern, described briefly below, was essentially identical to that derived from the neuropathological staging.
Neuropathology
No τ-immunoreactive pathology was detected in the neocortex in cases coming to postmortem without clinical evidence of dementia before death, although appreciable numbers of β-amyloid plaques were detected in these cases. These normal cases were significantly distinct from those with a minimal level of dementia before death in terms of tangles, neuritic plaques, and β-amyloid plaques (Figure 6 ▶ ; Table 3 ▶ ). More advanced clinical stages of dementia were associated with further step-wise increases in neocortical tau pathology, although the next significant increase in β-amyloid plaques was not detected until dementia had reached the severe stage. Clinical severity was therefore more strongly correlated with tau pathology (0.50 < τ < 0.55; P < 0.0001) than with β-amyloid plaques (τ = 0.30).
Figure 6.
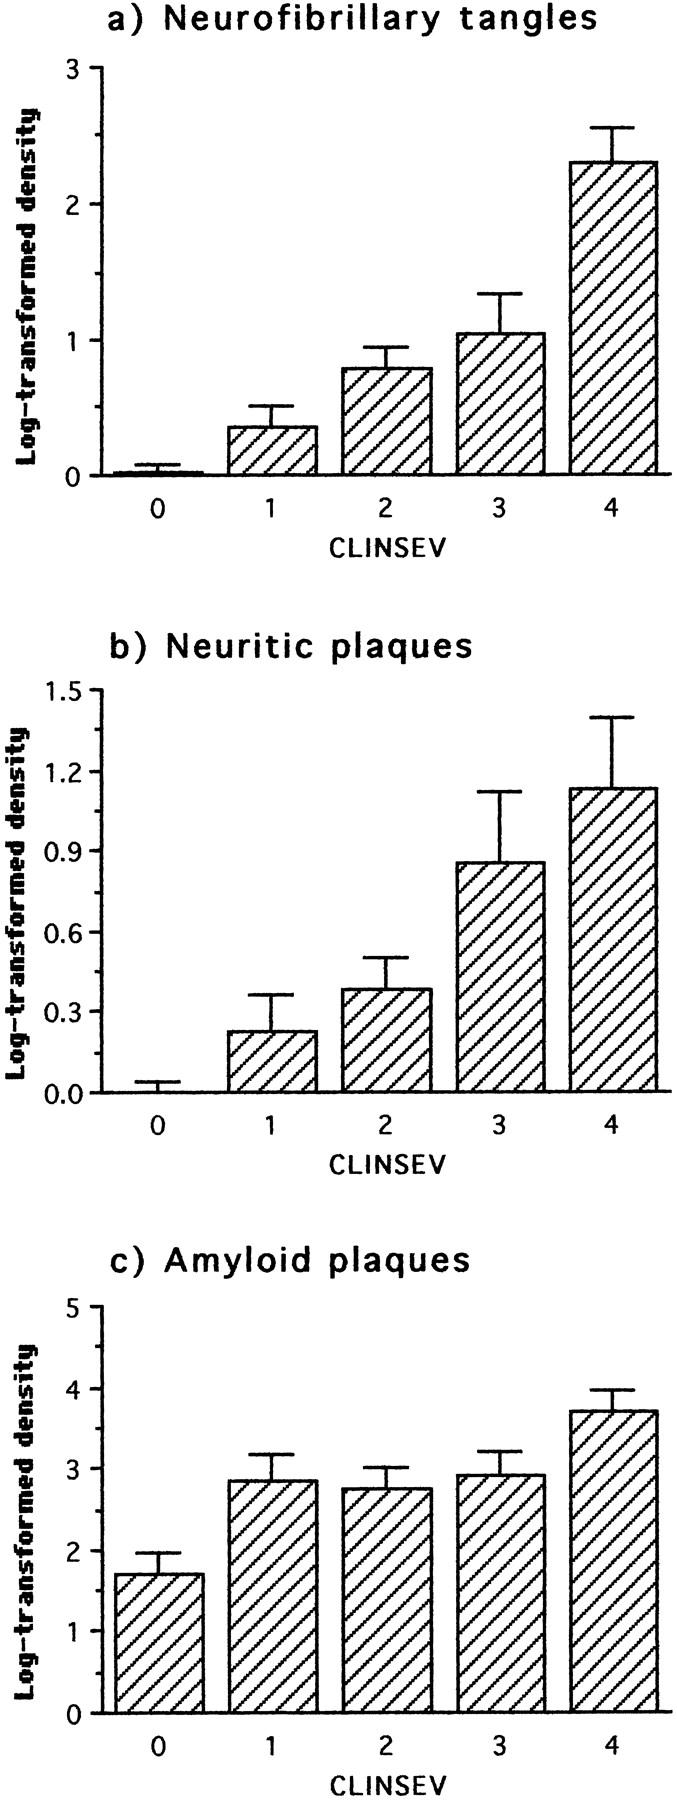
Neuropathological changes in frontal and temporal cortex staged with respect to clinical severity as defined by CAMDEX (0 = normal; 1 = minimal; 2 = mild; 3 = moderate; 4 = severe). The first statistically significant deviation with respect to the preceding clinical status occurred at minimal severity for all parameters.
Table 3.
Analysis of Variance in Biochemical and Neuropathological Changes in Neocortex with Respect to Clinical Severity (CAMDEX)
| CLINSEV | Parameter | df | Error | F | P | Mean diff. | C.I. | ||
|---|---|---|---|---|---|---|---|---|---|
| 0,1,2,3,4 | PHF-tau | 423 | 4 | 4.80 | 7.89 | 0.000 | |||
| 7.51 | 4 | 4.59 | 10.38 | 0.000 | |||||
| AT8 | 4 | 3.45 | 8.97 | 0.000 | |||||
| Phosphorylated tau | Sarkosyl AT8 | 4 | 2.96 | 7.01 | 0.000 | ||||
| Soluble AT8 | 4 | 0.81 | 3.24 | 0.017 | |||||
| Synaptic proteins | Synaptophysin | 4 | 443.54 | 4.58 | 0.002 | ||||
| Syntaxin | 4 | 635.18 | 3.09 | 0.021 | |||||
| SNAP-25 | 4 | 303.29 | 4.88 | 0.002 | |||||
| α-Synuclein | 4 | 946.21 | 0.94 | 0.446 | |||||
| MAP2 | S1C | 4 | 194.26 | 1.11 | 0.360 | ||||
| Pathology | Tangles | 4 | 0.38 | 15.40 | 0.000 | ||||
| Neuritic plaques | 4 | 0.28 | 8.42 | 0.000 | |||||
| Aβ Plaques | 4 | 1.57 | 3.81 | 0.007 | |||||
| 0 v 1 | PHF-tau | 423 | 1 | 2.66 | 4.77 | 0.035 | 1.18 | −0.39 | 2.75 |
| 7.51 | 1 | 3.23 | 7.52 | 0.009 | 1.63 | 0.15 | 3.12 | ||
| AT8 | 1 | 2.03 | 9.94 | 0.003 | 1.49 | 0.13 | 2.85 | ||
| Phosphorylated tau | Sarkosyl AT8 | 1 | 2.64 | 0.44 | 0.511 | 0.36 | −0.97 | 1.69 | |
| Soluble AT8 | 1 | 0.49 | 3.61 | 0.065 | 0.44 | −0.03 | 0.90 | ||
| Synaptic proteins | Synaptophysin | 1 | 423.24 | 0.06 | 0.809 | −1.66 | −15.84 | 12.52 | |
| Syntaxin | 1 | 433.86 | 0.03 | 0.875 | 1.09 | −13.03 | 15.21 | ||
| SNAP-25 | 1 | 237.77 | 0.43 | 0.517 | −3.34 | −13.60 | 6.92 | ||
| α-Synuclein | 1 | 709.77 | 0.81 | 0.375 | −7.94 | −21.23 | 5.35 | ||
| MAP2 | S1C | 1 | 220.36 | 1.47 | 0.233 | −7.83 | −21.80 | 6.15 | |
| Pathology | Tangles | 1 | 0.13 | 7.80 | 0.008 | 0.33 | 0.01 | 0.67 | |
| Neuritic plaques | 1 | 0.07 | 7.25 | 0.011 | 0.24 | −0.03 | 0.51 | ||
| Aβ Plaques | 1 | 1.83 | 6.04 | 0.019 | 1.10 | 0.19 | 2.01 | ||
| 0,1 v 2 | PHF-tau | 423 | 1 | 4.31 | 15.50 | 0.000 | 2.32 | 0.76 | 3.88 |
| 7.51 | 1 | 4.50 | 16.98 | 0.000 | 2.48 | 1.09 | 3.87 | ||
| AT8 | 1 | 3.31 | 9.03 | 0.004 | 1.55 | 0.23 | 2.88 | ||
| Phosphorylated tau | Sarkosyl AT8 | 1 | 2.46 | 19.43 | 0.000 | 1.96 | 1.01 | 2.91 | |
| Soluble AT8 | 1 | 0.71 | 5.32 | 0.025 | 0.55 | −0.02 | 1.12 | ||
| Synaptic proteins | Synaptophysin | 1 | 500.98 | 3.96 | 0.052 | 12.64 | −1.72 | 26.99 | |
| Syntaxin | 1 | 676.67 | 2.40 | 0.127 | 11.45 | −7.26 | 30.15 | ||
| SNAP-25 | 1 | 332.54 | 5.59 | 0.022 | 12.23 | −0.39 | 24.85 | ||
| α-Synuclein | 1 | 987.66 | 0.66 | 0.419 | 7.27 | −14.16 | 28.69 | ||
| MAP2 | S1C | 1 | 208.89 | 0.35 | 0.559 | 0.10 | −6.66 | 6.87 | |
| Pathology | Tangles | 1 | 0.24 | 21.11 | 0.000 | 0.64 | 0.28 | 1.00 | |
| Neuritic plaques | 1 | 0.14 | 8.23 | 0.006 | 0.31 | 0.03 | 0.59 | ||
| Aβ Plaques | 1 | 1.82 | 2.77 | 0.102 | 0.64 | −0.06 | 1.33 | ||
| 0,1,2 v 3 | PHF-tau | 423 | 1 | 5.99 | 4.09 | 0.047 | 1.47 | −0.46 | 3.41 |
| 7.51 | 1 | 5.94 | 7.46 | 0.008 | 1.98 | 0.27 | 3.69 | ||
| AT8 | 1 | 4.11 | 10.91 | 0.002 | 1.99 | 0.32 | 3.66 | ||
| Phosphorylated tau | Sarkosyl AT8 | 1 | 3.71 | 2.03 | 0.159 | 0.82 | −0.65 | 2.28 | |
| Soluble AT8 | 1 | 0.90 | 3.24 | 0.077 | 0.51 | −0.23 | 1.25 | ||
| Synaptic proteins | Synaptophysin | 1 | 465.16 | 12.62 | 0.001 | −22.81 | −32.73 | −12.89 | |
| Syntaxin | 1 | 667.95 | 6.35 | 0.014 | −19.40 | −34.68 | −4.11 | ||
| SNAP-25 | 1 | 333.80 | 9.86 | 0.003 | −17.08 | −26.78 | −7.39 | ||
| α-Synuclein | 1 | 824.65 | 0.10 | 0.756 | −2.67 | −13.03 | 7.70 | ||
| MAP2 | S1C | 1 | 201.98 | 0.71 | 0.404 | 12.46 | 2.96 | 21.97 | |
| Pathology | Tangles | 1 | 0.47 | 11.19 | 0.001 | 0.68 | 0.06 | 1.30 | |
| Neuritic plaques | 1 | 0.30 | 17.21 | 0.000 | 0.68 | 0.12 | 1.24 | ||
| Aβ Plaques | 1 | 1.81 | 0.71 | 0.403 | 0.34 | −0.43 | 1.10 | ||
| 0,1,2,3 v 4 | PHF-tau | 423 | 1 | 6.03 | 7.91 | 0.006 | 3.55 | 2.58 | 4.51 |
| 7.51 | 1 | 6.39 | 7.15 | 0.009 | 3.47 | 0.52 | 6.42 | ||
| AT8 | 1 | 4.61 | 6.25 | 0.015 | 2.76 | 0.57 | 4.94 | ||
| Phosphorylated tau | Sarkosyl AT8 | 1 | 3.61 | 7.33 | 0.009 | 2.64 | 1.32 | 3.97 | |
| Soluble AT8 | 1 | 0.89 | 2.29 | 0.134 | 0.73 | 0.48 | 0.98 | ||
| Synaptic proteins | Synaptophysin | 1 | 533.19 | 0.48 | 0.493 | −8.18 | −36.72 | 20.36 | |
| Syntaxin | 1 | 689.62 | 2.87 | 0.095 | −22.85 | −31.92 | −13.77 | ||
| SNAP-25 | 1 | 362.75 | 1.85 | 0.178 | −13.30 | −24.76 | −1.84 | ||
| α-Synuclein | 1 | 925.25 | 2.43 | 0.123 | 24.36 | −68.67 | 117.38 | ||
| MAP2 | S1C | 1 | 193.65 | 1.67 | 0.201 | −6.47 | −12.14 | −0.80 | |
| Pathology | Tangles | 1 | 0.52 | 23.48 | 0.000 | 1.80 | 1.09 | 2.51 | |
| Neuritic plaques | 1 | 0.37 | 7.15 | 0.009 | 0.83 | 0.00 | 1.66 | ||
| Aβ Plaques | 1 | 1.74 | 3.73 | 0.057 | 1.31 | 0.42 | 2.20 | ||
PHF-Tau and Phosphorylated Tau
Significant levels of both PHF-tau and phosphorylated tau were detected in cases without any clinical evidence of dementia (Figures 7 and 8) ▶ ▶ . Cases with minimal dementia had significantly higher levels of PHF-tau than those with normal mental function before death (Figure 7 ▶ and Table 3 ▶ ). There were further increases in PHF-tau for each further grade of severity of dementia (Table 3 ▶ ; 0.36 < τ < 0.43). By contrast, phosphorylated tau in non-PHF fractions first increased significantly over the nondemented background level only when dementia had progressed to the mild stage (Table 3) ▶ .
Figure 7.

Immunochemical measurements of PHF-tau with respect to clinical severity using three monoclonal antibodies in the bulk PHF fraction isolated from frontal and temporal cortex. The first statistically significant deviation relative to the preceding clinical status occurred at minimal severity for all parameters.
Figure 8.
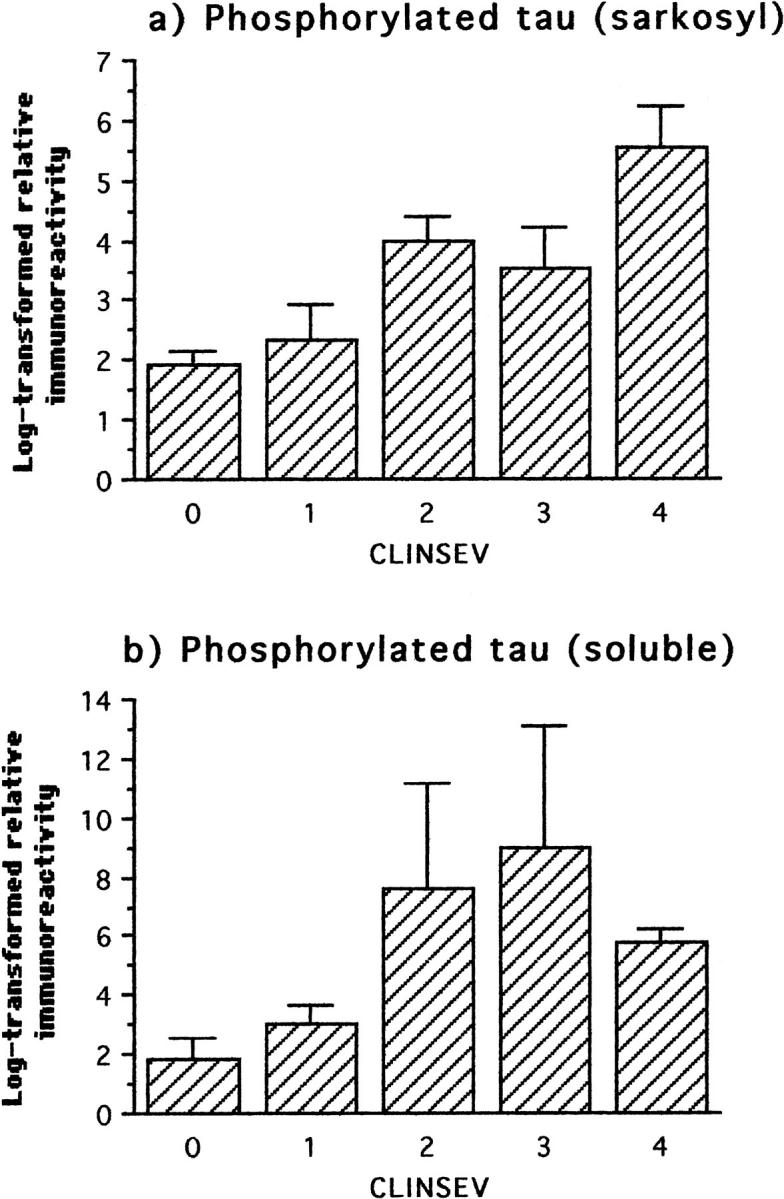
Immunochemical measurements of phosphorylated tau using mAb AT8 in the sarkosyl-insoluble fraction and in the soluble tau fraction from frontal and temporal cortex with respect to clinical severity. The first statistically significant deviation relative to the preceding clinical status occurred at the level of mild severity for both parameters.
Synaptic Proteins
The observation that the levels of synaptic proteins in neocortex increase significantly over the normal aged background at intermediate stages of AD was confirmed in the clinical analysis. Cases with a mild degree of dementia had significantly higher levels of synatophysin and SNAP-25 in neocortex than cases with no dementia or minimal dementia (Figure 9 ▶ and Table 3 ▶ ). It was only when dementia had reached the moderate stage that the levels of synaptophysin, syntaxin, and SNAP-25 began to show significant decline (Table 3) ▶ . Exclusion of the normal and minimal cases maximized the correlations between levels of synaptic proteins and clinical severity (0.31 < τ < 0.41).
Figure 9.
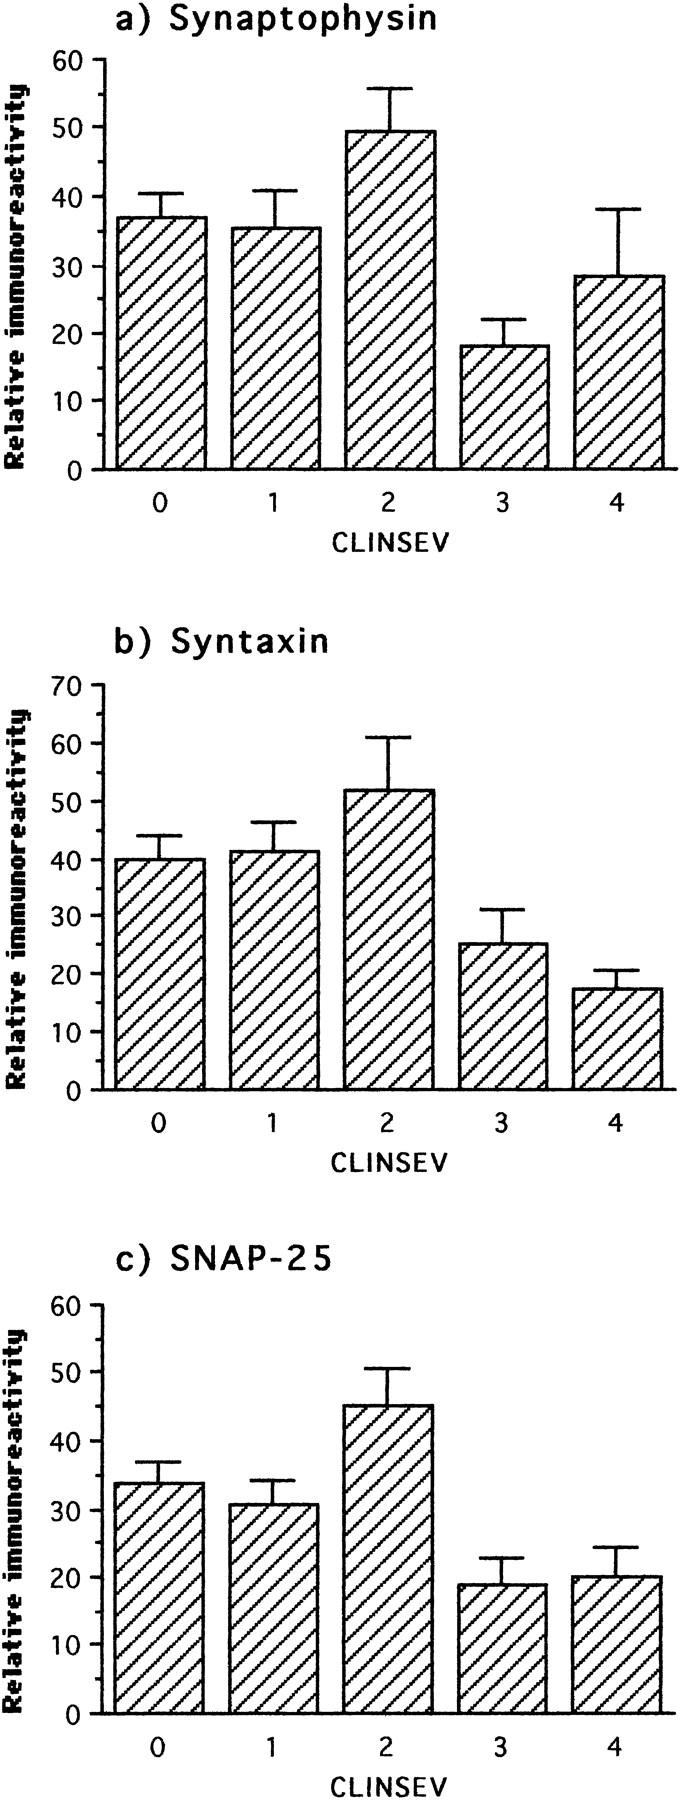
Immunochemical measurements of three synaptic proteins in frontal and temporal cortex with respect to clinical severity. The first statistically significant deviation with respect to preceding clinical status was an increase of SNAP-25 and synaptophysin at the level of mild severity. In the comparison of preceding stages with respect to moderate severity, all three proteins showed a significant decline.
MAP2 and Synuclein
There was no counterpart in the analysis undertaken with respect to clinical stage for the significant Braak stage 4 changes detected in these proteins.
Discussion
It has been proposed that the loss of synapses, particularly in the frontal neocortex, provides the best neurobiological correlate of mental impairment measured during life. 14,15 If this is so, then the question which immediately follows is to define the molecular process most closely linked with loss of synapses. Three possibilities have been proposed on the basis of morphometric studies: 1) loss of synapses is a nonspecific consequence of global neurodegenerative changes which also includes neuronal loss; 26 2) loss of synapses is because of the neurotoxicity of β-amyloid; 27,28 3) loss of synapses is because of cytoskeletal changes caused either by hyperphosphorylation-dependant tau protein dysfunction 29-34 or primary aggregation of tau protein. 35 These hypotheses have widely divergent implications for the design of therapeutic approaches to prevention of clinical dementia. We have addressed these questions empirically in human brain by direct molecular and morphometric analyses in a clinicopathologically staged epidemiological cohort. 1-3
Staging based on the pattern of pathology in medial temporal and limbic structures correctly predicts the accumulation of PHF-tau in the isocortex before histological evidence of neurofibrillary degeneration. Whereas neurofibrillary tangles and neuritic plaques do not begin to appear until stage 4 in the isocortex, PHF-tau can be detected at significant levels from stage 2 onwards, and increases in a step-wise manner with respect to stage thereafter. Accumulation of PHF-tau in the isocortex likewise distinguishes nondemented cases from those with a minimal degree of dementia before death, and increases in a step-wise manner with respect to clinical stage. The PHF-tau we have detected at stage 2 and thereafter is characterized by: having the sedimentation properties characteristic of 88% of PHFs in the brain; 10 containing acid-reversible aggregates through the repeat domain, 4 forming proteolytically stable complexes truncated at Glu-391, 36 and being associated with full-length tau phosphorylated at Ser-199/202. 10 These sedimentation and immunochemical features provide a basis for defining the species first accumulating at stage 2 as PHF-tau.
These changes in PHF-tau can be contrasted with other forms of phosphorylated tau which do not sediment with PHFs. Sarkosyl-insoluble tau appears only by Braak stage 4, and soluble hyperphosphorylated tau by stage 6. In terms of clinical severity, phosphorylated tau increases over the normal aging background at the level of mild dementia, whereas PHF-tau increases at the level of minimal dementia. Therefore forms of phosphorylated tau not sedimenting with the bulk PHF fraction appear after the onset of tau aggregation forming PHFs. It has been proposed that phosphorylation of tau causes early pooling as a result of microtubule detachment and later aggregation to form PHFs. 29-34 Our findings are inconsistent with this hypothesis: tau aggregation precedes the pooling of soluble hyperphosphorylated tau. Similarly, MAP2 protein changes occur later than tau aggregation: increased levels lag by two Braak stages and decline by four stages. It seems unlikely that a common mechanism such as disruption of the normal regulatory balance of kinases and phosphatases could be considered responsible both for the aggregation of tau protein, pooling of soluble phosphorylated tau, and the later changes in MAP2, as they occur at widely divergent stages of the disease process.
In contrast to the progressive accumulation of aggregated tau protein, the changes seen in four distinct synaptic proteins and MAP2 are biphasic with respect to both pathological and clinical staging. Braak stage 3 is characterized in the neocortex by increased levels of synaptophysin, syntaxin, and SNAP-25. Increases in MAP2 and α-synuclein do not arise until Braak stage 4. Iwai et al 37 also described slightly increased levels of immunoreactivity for synuclein in the frontal lobe at early AD stages. The subsequent decrease in presynaptic proteins, synuclein, and MAP2 was seen only after the appearance of the full spectrum of tau and β-amyloid pathology. Conversely, the presence of β-amyloid pathology in the absence of tau pathology was not associated with any loss of synaptic proteins. Therefore, our results, like those of Masliah et al 38 and Terry et al 15 , are inconsistent with the hypothesis that synapse loss in isocortex is due solely to advanced stages of β-amyloid plaque deposition. 27,28 The increase in β-amyloid plaques associated with progression of AD first becomes evident at stage 4, after the onset of PHF-deposition at stage 2, and the transient increase in synaptic proteins at stage 3. This sequence observed in human isocortex is the reverse of that expected according to the hypothesis that extracellular β-amyloid deposits initiate the cytoskeletal and synaptic changes of AD. 27,28 This is further supported by the findings of a recent study, which described accumulation of longer amyloid isoforms (Aβ42) in the human brain to appear rather early (from the fourth decade onwards), but is a variable feature in the brain tissue of octogenarians and nonagenarians. 39
Immunohistochemical studies have suggested that there is extensive synapse loss during aging, with estimates varying between 20 to 25% comparing younger individuals with those aged 60 or more, with some degree of overlap with the losses found in AD. 40-45 In the present study we confirm that advanced stages of AD are associated with a further loss of synaptic vesicle proteins in excess of that associated with normal aging. This is consistent with studies showing loss of synaptophysin in tangle-bearing neurons, 46 and a high correlation between tangle counts and neuronal loss. 47 The mini mental state exam (MMSE) score of 20 used as an exclusion criterion by Terry et al 15 implies that only cases with mild or greater severity of dementia were included in the latter study. When this exclusion criterion was applied to the present cases, the correlation between loss of synaptic protein and clinical severity could be reproduced. However, this does not imply that loss of synapses is the neurobiological substrate of early dementia. Minimal dementia was observed in the absence of synaptic loss, and mild dementia was associated with significantly higher levels of synaptophysin and SNAP-25. Therefore, loss of synapses in association neocortex cannot provide a simple explanation for the early stages of dementia.
The mechanism responsible for the transient increase in synaptic protein levels in association neocortex at stage 3 is at present unknown. Neuritic sprouting has been described in AD, associated predominantly with τ-immunoreactive neuritic plaques. 48 Furthermore, the extent of tau phosphorylation has been associated particularly with dendritic sprouting. 49 However, we did not detect any increase in τ-immunoreactive neuritic plaques or neuropil threads until Braak stage 4. Likewise, β-amyloid plaques and neurofibrillary tangles also increased only from stage 4, as were changes in phosphorylated tau protein in the soluble and sarkosyl-insoluble fractions. Therefore, the increase in synaptic protein levels precedes any of the changes that have been linked with neuritic sprouting.
Numerous trophic factors have been identified which mediate neuronal sprouting responses to neuronal injury and partial de-afferentation. 50-52 Recent experimental studies found that synaptic loss and dendritic atrophy after ischemic lesions could be ameliorated by infusion of human nerve growth factor (NGF), 52-54 and increased levels of NGF have been found in AD brain. 55,56 Thrombin, which induces cell spreading, has also been found to increase Alz-50 immunoreactivity. 57 Many growth-promoting factors have been localized to the corona of neuritic plaques, including GAP-43, 58 collagen IV, laminin and the integrin receptor VLA6, 59 transforming growth factor-β, 60 and fibroblast growth factor. 61 Interestingly, growth factors have been identified in the corona of plaques before the appearance of phosphorylated tau protein, 59 consistent with our finding that synaptic proteins increase before the accumulation of phosphorylated tau protein in the soluble and sarkosyl-insoluble fractions.
Little is known about MAP2 protein metabolism in aging and in AD. Although initial studies suggested that tangles contain MAP2 immunoreactivity, 62 MAP2 sequences were not identified either in the PHF core 63 or in other PHF preparations. 64 Most neuritic plaques do not contain any MAP2 immunoreactivity, and MAP2 immunoreactivity decreases at advanced stages of AD, particularly in entorhinal cortex (E. B. Mukaetova-Ladinska, unpublished observations). Increased expression of MAP2, particularly MAP2c, has been associated previously with neuronal trophic responses in a variety of settings. 65-68 Whatever the mechanism of induction of increased levels of MAP2 protein at stage 4, our findings are consistent with histological evidence for transient dendritic sprouting in the CA 1 region of the hippocampus at early stages of AD. 69 The fact that MAP2 and synuclein levels increase one stage after the presynaptic proteins argues against a single common mechanism, such as nonspecific reduction in turnover or transportation.
A more complex picture of synaptic pathophysiology seems to be emerging. The loss of synaptic proteins is a relatively late phenomenon in the isocortex, occurring well after the onset of clinically detectable dementia, and also after the appearance of the full spectrum of classical plaque and tangle pathology. The earliest detectable change relative to the normal aging background is the onset of tau protein aggregation at stage 2, which is consistent with our earlier immunohistochemical 70 and biochemical 11 staging studies in medial temporal lobe structures. We have recently reported that proteolytically stable truncated tau aggregates, once formed, have the capacity to propagate further tau capture via a high-affinity binding interaction. 35 The present data and our earlier evidence showing exponential redistribution of the tau protein pool in AD 7,11 would be consistent with a sequence of aggregation events which would divert tau protein away from microtubules and account for the failure of axonal transport. Our results are consistent with the hypothesis that early accumulation of PHF-tau is associated with impairment of axonal transport that elicits an early adaptive synaptic regeneration response. This transient response cannot be sustained, but is followed by loss of synaptic proteins at more advanced stages. An impairment of axonal transport associated with PHF accumulation may therefore make an important contribution to early dementia. Our results suggest whatever the upstream factors which are ultimately responsible for the onset of tau aggregation, a therapy targeting this process 35 would provide a means of intervening early in a cascade which is closely linked to the onset and progression of clinically detectable dementia.
Acknowledgments
All of the brain tissue used in the present study came from the collection of the Cambridge Brain Bank. We thank Mrs. A. O’Sullivan for liaison with the patients and their families. We are indebted to all of the patients and their families that have participated in the study.
Footnotes
Address reprint requests to E. B. Mukaetova-Ladinska, Department of Psychiatry, Addenbrooke’s Hospital, Hills Rd., Cambridge CB2 2QH, United Kingdom. E-mail: mukaetova@exl.co.uk.
Supported by MRC Grant United Kingdom (to E. B. M.-L., J. H., J. H. X., C. R. H., C. M. W.), MRC Grant, Canada (to W. H.), CONACyT Mexico, and the Alzheimer’s Research Fund, Cambridge (F. G.-S.).
E. B. M.-L. is a Research Fellow of Hughes Hall, University of Cambridge.
References
- 1.Paykel ES, Brayne C, Huppert FA, Gill C, Barkley C, Gelhaar E, Beardsall L, Girling D, Pollitt P, O’Connor D: Incidence of dementia in a population older than 75 years in the United Kingdom. Arch Gen Psychiatry 1994, 51:325-332 [DOI] [PubMed] [Google Scholar]
- 2.Paykel ES, Huppert FA, Brayne C: Incidence of dementia and cognitive decline in over-75s in Cambridge: overview of cohort study. Soc Psychiatry Psychiatr Epidemiol 1998, 33:387-392 [DOI] [PubMed] [Google Scholar]
- 3.Brayne C, Gill C, Huppert FA, Barkley C, Gelhaar G, Girling DM, O’Connor DW, Paykel ES: Incidence of clinically diagnosed subtypes of dementia in an elderly population. Cambridge Project for Later Life. Br J Psychiatry 1995, 167:255-262 [DOI] [PubMed] [Google Scholar]
- 4.Harrington CR, Mukaetova-Ladinska EB, Hills R, Edwards PC, Montejo de Garcini E, Novak M, Wischik CM: Measurement of distinct immunochemical presentations of tau protein in Alzheimer’s disease. Proc Natl Acad Sci USA 1991, 88:5842–5846 [DOI] [PMC free article] [PubMed]
- 5.Harrington CR, Louwagie J, Rossau R, Vanmechelen E, Perry RH, Perry EK, Xuereb JH, Roth M, Wischik CM: Influence of apolipoprotein E genotype on senile dementia of the Alzheimer and Lewy body types. Significance for etiological theories of Alzheimer’s disease. Am J Pathol 1994, 145:1472-1484 [PMC free article] [PubMed] [Google Scholar]
- 6.Mukaetova-Ladinska EB, Harrington CR, Hills R, O’Sullivan A, Roth M, Wischik CM: Regional distribution of paired helical filaments and normal tau proteins in aging and in Alzheimer’s disease with and without occipital lobe involvement. Dementia 1992, 3:61-69 [Google Scholar]
- 7.Mukaetova-Ladinska EB, Harrington CR, Roth M, Wischik CM: Biochemical and anatomical redistribution of tau protein in Alzheimer’s disease. Am J Pathol 1993, 143:565-578 [PMC free article] [PubMed] [Google Scholar]
- 8.Mukaetova-Ladinska EB, Harrington CR, Roth M, Wischik CM: Distribution of tau protein in Down’s syndrome: quantitative differences from Alzheimer’s disease. Dev Brain Dysfunction 1994, 7:313-329 [Google Scholar]
- 9.Mukaetova-Ladinska EB, Harrington CR, Roth M, Wischik CM: Alterations in tau protein metabolism during normal aging. Dementia 1996, 7:95-103 [DOI] [PubMed] [Google Scholar]
- 10.Wischik CM, Harrington CR, Lai RYK, Mukaetova-Ladinska EB, Xuereb JH, Gertz H-J, Wischik DJ, Edwards PC, Mena R, Roth M: Authors response to commentaries. What causes neurofibrillary tangle formation in Alzheimer’s disease? Neurobiol Aging 1995, 16:409–431 [DOI] [PubMed]
- 11.Lai RYK, Gertz H-J, Wischik DJ, Xuereb JH, Mukaetova-Ladinska EB, Harrington CR, Edwards PC, Mena R, Paykel ES, Brayne C, Huppert FA, Roth M, Wischik CM: Examination of phosphorylated tau protein as a PHF precursor at early stage Alzheimer’s disease. Neurobiol Aging 1995, 16:433-445 [DOI] [PubMed] [Google Scholar]
- 12.Braak H, Braak E: Neuropathological staging of Alzheimer-related changes. Acta Neuropathol (Berl) 1991, 82:239–259 [DOI] [PubMed]
- 13.Roth M, Tym E, Mountjoy CQ, Huppert FA, Hendrie H, Verma S, Goddard R: CAMDEX: a standardised instrument for the diagnosis of mental disorder in the elderly with special references to the early detection of dementia. Br J Psychiatry 1986, 149:698-709 [DOI] [PubMed] [Google Scholar]
- 14.DeKosky ST, Scheff SW: Synapse loss in frontal cortex biopsies in Alzheimer’s disease: correlation with cognitive severity. Ann Neurol 1990, 27:457-464 [DOI] [PubMed] [Google Scholar]
- 15.Terry RD, Masliah E, Salmon D, Butters N, DeTeresa R, Hill R, Hansen L, Katzman R: Physical basis of cognitive alterations in Alzheimer’s disease: synapse loss is the major correlate of cognitive impairment. Ann Neurol 1991, 30:572-580 [DOI] [PubMed] [Google Scholar]
- 16.Beardsall L, Barkley C, O’Sullivan A: The response of elderly community residents to request for brain donation: an interim report. Int J Geriatr Psychiatry 1992, 7:199-202 [Google Scholar]
- 17.Gertz H-J, Xuereb JH, Huppert FA, Brayne C, Kruger H, McGee MA, Paykel ES, Harrington CR, Mukaetova-Ladinska EB, O’Connor DW, Wischik CM: The relationship between clinical dementia and neuropathological staging (Braak) in a very elderly community sample. Eur Arch Psychiatry Clin Neurosci 1996, 246:132-136 [DOI] [PubMed] [Google Scholar]
- 18.Gertz H-J, Xuereb J, Huppert F, Brayne C, McGee MA, Paykel E, Harrington C, Mukaetova-Ladinska E, Arendt T, Wischik CM: Examination of the validity of the hierarchical model of neuropathological staging in normal aging and Alzheimer’s disease. Acta Neuropathol (Berl) 1998, 95:154–158 [DOI] [PubMed]
- 19.Chui HC, Victoroff JI, Margolin D, Jagust W, Shankle R, Katzman R: Criteria for the diagnosis of ischemic vascular dementia proposed by the State of California Alzheimer’s Disease Diagnostic and Treatment Centers. Neurology 1992, 42:473-480 [DOI] [PubMed] [Google Scholar]
- 20.Alford MF, Masliah E, Hansen LA, Terry RD: A simple dot-immunobinding assay for quantification of synaptophysin-like immunoreactivity in human brain. J Histochem Cytochem 1994, 42:283-287 [DOI] [PubMed] [Google Scholar]
- 21.Honer WG, Falkai P, Young C, Wang T, Xie J, Bonner J, Hu L, Boulianne GL, Lu Z, Trimble WS: Cingulate cortex synaptic terminal proteins and neural cell adhesion molecule in schizophrenia. Neuroscience 1997, 78:99-110 [DOI] [PubMed] [Google Scholar]
- 22.Honer WG, Kaufmann CA, Kleinman JE, Casanova MF, Davies P: Monoclonal antibodies to study the brain in schizophrenia. Brain Res 1989, 500:379-383 [DOI] [PubMed] [Google Scholar]
- 23.Jakes R, Spillantini MG, Goedert M: Identification of two distinct synucleins from human brain. FEBS Lett 1994, 345:27-32 [DOI] [PubMed] [Google Scholar]
- 24.Huber G, Matus A: Differences in the cellular distributions of two microtubule associated proteins, MAP1 and MAP2, in rat brain. J Neurosci 1984, 4:151-160 [DOI] [PMC free article] [PubMed] [Google Scholar]
- 25.Dickson DW, Crystal HA, Bevona C, Honer W, Vincent I, Davies P: Correlations of synaptic and pathological markers with cognition of the elderly. Neurobiol Aging 1995, 16:285-304 [DOI] [PubMed] [Google Scholar]
- 26.Scheff SW, Sparks DL, Price DA: Quantitative assessment of synaptic density in the outer molecular layer of the hippocampal dentate gyrus in Alzheimer’s disease. Dementia 1996, 7:226-232 [DOI] [PubMed] [Google Scholar]
- 27.Selkoe DJ: Amyloid β-protein and the genetics of Alzheimer’s disease. J Biol Chem 1996, 271:18295-18298 [DOI] [PubMed] [Google Scholar]
- 28.Mattson MP: Cellular action of β-amyloid precursor protein and its soluble and fibrillogenic derivatives. Physiol Rev 1997, 77:1081-1132 [DOI] [PubMed] [Google Scholar]
- 29.Lee VMY, Balin MJ, Otvos L, Jr, Trojanowski JQ: A68: a major subunit of paired helical filaments and derivatized forms of normal tau. Science 1991, 251:675-678 [DOI] [PubMed] [Google Scholar]
- 30.Goedert M, Spillantini MG, Crowther RA: Tau proteins and neurofibrillary degeneration. Brain Pathol 1991, 1:279-286 [DOI] [PubMed] [Google Scholar]
- 31.Goedert M, Spillantini MG, Cairns NJ, Crowther RA: Tau proteins of Alzheimer paired helical filaments: abnormal phosphorylation of all six brain isoforms. Neuron 1992, 8:159-168 [DOI] [PubMed] [Google Scholar]
- 32.Gustke N, Steiner B, Mandelkow E-M, Biernat J, Meyer HE, Goedert M, Mandelkow E: The Alzheimer-like phosphorylation of tau protein reduces microtubule binding and involves Ser-Pro and Thr-Pro motifs. FEBS Lett 1992, 307:199-205 [DOI] [PubMed] [Google Scholar]
- 33.Lichtenberg-Kraag B, Mandelkow EM, Biernat J, Steiner B, Schroter C, Gustke N, Meyer AE, Mandelkow E: Phosphorylation-dependent epitopes of neurofilament antibodies on tau protein and relationship with Alzheimer tau. Proc Natl Acad Sci USA 1992, 89:5384-5388 [DOI] [PMC free article] [PubMed] [Google Scholar]
- 34.Biernat J, Gustke N, Drewes G, Mandelkow E-M, Mandelkow E: Phosphorylation of SER262 strongly reduces binding of tau to microtubules: distinction between PHF-like immunoreactivity and microtubule binding. Neuron 1993, 11:153-163 [DOI] [PubMed] [Google Scholar]
- 35.Wischik CM, Edwards PC, Lai RY, Roth M, Harrington CR: Selective inhibition of Alzheimer disease-like tau aggregation by phenothiazines. Proc Natl Acad Sci USA 1996, 93:11213-11218 [DOI] [PMC free article] [PubMed] [Google Scholar]
- 36.Novak M, Kabat J, Wischik CM: Molecular characterization of the minimal protease resistant tau unit of the Alzheimer’s disease paired helical filament. EMBO J 1993, 12:365-370 [DOI] [PMC free article] [PubMed] [Google Scholar]
- 37.Iwai A, Masliah E, Sundsmo MP, DeTeresa R, Mallory M, Salmon DP, Saitoh T: The synaptic protein NACP is abnormally expressed during the progression of Alzheimer’s disease. Brain Res 1996, 720:230-234 [DOI] [PubMed] [Google Scholar]
- 38.Masliah E, Terry RD, Mallory M, Alford M, Hansen L: Diffuse plaques do not accentuate synapse loss in Alzheimer disease. Am J Pathol 1990, 137:1293-1297 [PMC free article] [PubMed] [Google Scholar]
- 39.Funato H, Yoshimura M, Kusui K, Tamaoka A, Ishikawa K, Ohkoshi N, Namekata K, Okeda R, Ihara Y: Quantitation of amyloid β-protein (Aβ) in the cortex during aging and Alzheimer’s disease. Am J Pathol 1998, 152:1633-1640 [PMC free article] [PubMed] [Google Scholar]
- 40.Davies CA, Mann DMA, Sumpter PQ, Yates PO: A quantitative morphometric analysis of the neuronal and synaptic content of the frontal and temporal cortex in patients with Alzheimer’s disease. J Neurol Sci 1987, 78:151-164 [DOI] [PubMed] [Google Scholar]
- 41.Masliah E, Mallory M, Hansen L, DeTeresa R, Terry RD: Quantitative synaptic alterations in the human neocortex during normal aging. Neurology 1993, 43:192-197 [DOI] [PubMed] [Google Scholar]
- 42.Scheff SW, Price DA: Synapse loss in the temporal lobe in Alzheimer’s disease. Ann Neurol 1993, 33:190-199 [DOI] [PubMed] [Google Scholar]
- 43.Zhan SS, Beyreuther K, Schmidt HP: Synaptophysin immunoreactivity of the cortical neuropil in vascular dementia of Binswanger type compared with dementia of Alzheimer type and non-demented controls. Dementia 1994, 5:79-87 [DOI] [PubMed] [Google Scholar]
- 44.Brun A, Liu X, Erikson C: Synapse loss and gliosis in the molecular layer of the cerebral cortex in Alzheimer’s disease and in frontal lobe degeneration. Neurodegeneration 1995, 4:171-177 [DOI] [PubMed] [Google Scholar]
- 45.Liu X, Erikson C, Brun A: Cortical synaptic changes and gliosis in normal aging, Alzheimer’s disease and frontal lobe degeneration. Dementia 1996, 7:128-134 [DOI] [PubMed] [Google Scholar]
- 46.Callahan LM, Coleman PD: Neurons bearing neurofibrillary tangles are responsible for selected synaptic deficits in Alzheimer’s disease. Neurobiol Aging 1995, 16:311-314 [DOI] [PubMed] [Google Scholar]
- 47.Bondareff W, Wischik CM, Novak M, Amos WB, Klug A, Roth M: Molecular analysis of neurofibrillary degeneration in Alzheimer’s disease. An immunohistochemical study. Am J Pathol 1990, 137:711–723 [PMC free article] [PubMed]
- 48.Masliah E, Mallory M, Hansen L, DeTeresa R, Alford M, Terry R: Synaptic and neuritic alterations during the progression of Alzheimer’s disease. Neurosci Lett 1994, 174:67-72 [DOI] [PubMed] [Google Scholar]
- 49.Diaz-Nido J, Armas-Portela R, Correas I, Dominiquez JE, Montejo E, Avila J: Microtubule protein phosphorylation in neuroblastoma cells and neurite growth. J Cell Sci Suppl 1991, 15:51-59 [DOI] [PubMed] [Google Scholar]
- 50.Ng S-C, de la Monte SM, Conboy GL, Karns LR, Fishman MC: Cloning of human GAP-43: growth association and ischemic resurgence. Neuron 1988, 1:133-139 [DOI] [PubMed] [Google Scholar]
- 51.Schauwecker PE, Cheng H-W, Serquinia MP, Mori N, McNeill TH: Lesion-induced sprouting of commissural/association axons and induction of GAP-43 mRNA in hillar and CA3 pyramidal neurons in the hippocampus are diminished in aged rats. J Neuroscience 1995, 15:2462-2470 [DOI] [PMC free article] [PubMed] [Google Scholar]
- 52.Kolb B, Cote S, Ribeiro-Da-Silva A, Cuello AC: Nerve growth factor treatment prevents dendritic atrophy and promotes recovery of function after cortical injury. Neuroscience 1997, 76:1139-1159 [DOI] [PubMed] [Google Scholar]
- 53.Chen KS, Masliah E, Mallory M, Gage FH: Synaptic loss in cognitively impaired aged rats is ameliorated by chronic human nerve growth factor infusion. Neuroscience 1995, 68:19-277477924 [Google Scholar]
- 54.Burgos I, Cuello AC, Liberini P, Pioro E, Masliah E: NGF-mediated synaptic sprouting in the cerebral cortex of lesioned primate brain. Brain Res 1995, 692:154-160 [DOI] [PubMed] [Google Scholar]
- 55.Scott SA, Mufson EJ, Weingartner JA, Skau KA, Crutsher KA: Nerve growth factor in Alzheimer’s disease: increased levels throughout the brain coupled with declines in nucleus basalis. J Neurosci 1995, 15:6213-6221 [DOI] [PMC free article] [PubMed] [Google Scholar]
- 56.Narisawa-Saito M, Wakabayashi K, Tsuji S, Takahashi H, Nawa H: Regional specificity in NGF, BDNF and NT-3 levels in Alzheimer’s disease. NeurpoReport 1996, 7:2925-2928 [DOI] [PubMed] [Google Scholar]
- 57.Brewer GJ: Thrombin causes cell spreading and redistribution of β-amyloid immunoreactivity in cultured hippocampal neurons. J Neurochem 1996, 67:119-130 [DOI] [PubMed] [Google Scholar]
- 58.Masliah E, Mallory M, Hansen L, Alford M, Albright T, DeTeresa R, Terry R, Baudier J, Saitoh T: Patterns of aberrant sprouting in Alzheimer’s disease. Neuron 1991, 6:729-739 [DOI] [PubMed] [Google Scholar]
- 59.Zhan S-S, Kamphorst W, Van Nostrand WE, Eikelenboom P: Distribution of neuronal growth-promoting factors and cytoskeletal proteins in altered neurites in Alzheimer’s disease and non-demented elderly. Acta Neuropathol (Berl) 1995, 89:356–362 [DOI] [PubMed]
- 60.Flanders KC, Lippa CF, Smith TW, Pollen DA, Sporn MB: Altered expression of transforming growth factor-β in Alzheimer’s disease. Neurology 1995, 45:1561-1569 [DOI] [PubMed] [Google Scholar]
- 61.Nakamura S, Arima K, Haga S, Aizawa T, Motoi Y, Otsuka M, Ueki A, Ikeda K: Fibroblast growth factor (FGF)-9 immunoreactivity in senile plaques. Brain Res 1998, 814:222-225 [DOI] [PubMed] [Google Scholar]
- 62.Kosik KS, Duffy LK, Dowling MM, Abraham CR, Muskey A, Selkoe DJ: Microtubule-associated protein 2: monoclonal antibodies demonstrate the selective incorporation of certain epitopes into Alzheimer neurofibrillary tangles. Proc Natl Acad Sci USA 1984, 81:7941-7945 [DOI] [PMC free article] [PubMed] [Google Scholar]
- 63.Wischik CM, Novak M, Thogersen HC, Edwards PC, Runswick MJ, Jakes R, Walker JE, Milstein C, Roth M, Klug A: Isolation of a fragment of tau derived from the core of the paired helical filament of Alzheimer disease. Proc Natl Acad Sci USA 1988, 85:4506-4510 [DOI] [PMC free article] [PubMed] [Google Scholar]
- 64.Six J, Lubke U, Mercken M, Vandermeeren M, Ceuterick C, Van de Voorde A, Boons J, Gheuens J: Specific monoclonal antibodies against normal microtubule-associated protein -2 (MAP2) epitopes present in Alzheimer pathological structures do not recognize paired helical filaments. Acta Neuropathol (Berl) 1992, 83:179–189 [DOI] [PubMed]
- 65.Caceres A, Busciglio J, Ferreira A, Steward O: An immunocytochemical and biochemical study of the microtubule-associated protein MAP-2 during postlesion dendritic remodelling in the central nervous system of adult rats. Mol Brain Res 1988, 3:233-246 [DOI] [PubMed] [Google Scholar]
- 66.Edson K, Weisshaar B, Matus A: Actin depolymerisation induces process formation on MAP2-transfected non-neuronal cells. Development 1993, 117:689-700 [DOI] [PubMed] [Google Scholar]
- 67.Yin HS, Chou HC, Chiu MM: Changes in the microtubule proteins in the developing and transected spinal cords of the bullfrog tadpole: induction of microtubule-associated protein 2c and enhanced levels of tau and tubulin in regenerating central axons. Neuroscience 1995, 67:763-775 [DOI] [PubMed] [Google Scholar]
- 68.Yamanouchi H, Zhang W, Jay V, Becker LE: Enhanced expression of microtubule-associated protein 2 in large neurons of cortical dysplasia. Ann Neurol 1996, 39:57-61 [DOI] [PubMed] [Google Scholar]
- 69.Braak E, Braak H: Alzheimer’s disease: transiently developing dendritic changes in pyramidal cells of sector CA1 of the Ammon’s horn. Acta Neuropathol (Berl) 1997, 93:323–325 [DOI] [PubMed]
- 70.Mena R, Edwards P, Harrington CR, Mukaetova-Ladinska EB, Wischik CM: Staging the pathological assembly of truncated tau protein into paired helical filaments in Alzheimer’s disease. Acta Neuropathol (Berl) 1996, 91:633–641 [DOI] [PubMed]