

Abstract
γ-Glutamyl transpeptidase (GGT), a major enzyme of glutathione (GSH) homeostasis, is often used as a biliary marker to follow the differentiation of hepatic precursor cells. The expression of the GGT gene is driven by different promoters and yields multiple mRNAs, depending on the cell type or the stage of differentiation. In the present study, we analyzed the GGT mRNA expression pattern by quantitative reverse transcriptase-polymerase chain reaction or by in situ hybridization i) in the liver, in vivo, at early stages of development; ii) in oval cells, which proliferate and differentiate into hepatocytes in response to galactosamine injury in vivo; and finally, iii) during hepatoblast differentiation, in vitro. We show that GGT gene transcription originates from promoters P3, P4, and P5 in rat hepatic precursor cells. Differentiation of these cells induces profound alterations in GGT gene expression, leading to extinction of promoters P4 and P5, when they differentiate into the hepatocytic pathway, and to extinction of promoters P3 and P5 when they differentiate into the biliary pathway. This diversity in GGT mRNA expression provides unique molecular probes to follow hepatic precursor cell differentiation. Furthermore, the identification of factors governing GGT P5 and P4 promoter expression should provide further insight into the molecular events that occur as the liver precursor cell differentiates into the hepatic lineages.
In rodent development, the liver appears at ∼10 days of embryonic life and consists of immature hepatic cells that have migrated from the hepatic diverticulum into the surrounding mesoderm. 1 These cells, generally referred to as hepatoblasts, 2 already express α-fetoprotein and albumin. 3 From embryonic day 15 (E15), most of the hepatoblasts undergo differentiation into the hepatocytic pathway and acquire hepatocytic markers such as the HES6 antigen. 4 A few of them surrounding the vascular spaces lose α-fetoprotein and albumin; express CK19, 5,6 OV-6, 7 and BDS7 antigens 8 ; and differentiate into biliary cells. 5 The bipotent character of these liver cells is progressively lost during development and remains in only 5% of the cells at birth. 4 Numerous lines of evidence indicate the persistence of a few hepatic bipotent cells in the periportal area of adult liver from which oval cells are believed to arise in response to toxic injuries. 9,10 The characteristics of hepatoblasts have been clearly established both in vivo 4,5 and in vitro by their differentiation into either immature biliary cells or hepatocytes, depending on the presence or the absence of Na+ butyrate in serum-supplemented medium. 4
Monoclonal antibodies that discriminate between steps in liver cell differentiation have been useful in the study of lineage relationships between hepatoblasts, oval cells, and hepatoma cells. 5,8,11 Nevertheless, there are only a limited number of genes that can be used as reliable markers for short windows of differentiation and can give access to regulatory factors. Glutathione transferase P (GST-P) or γ-glutamyl transpeptidase (GGT) activities are present at the early steps of liver development and are restricted to biliary cells in the adult stage. 12,13 These activities are consistently used as biliary markers along with monoclonal antibodies directed against cytoskeletal or unknown cell surface antigens. 4,7 However, the specificity of GGT or GST-P activities as biliary markers is impaired by their expression in perinatal hepatocytes 12,13 and their induction in adult hepatocytes in response to chemical injuries or carcinogenic treatments. 14,15
In the rat, the GGT gene is transcribed from five promoters (P1 to P5) into several mRNAs (mRNAs I, II, III, IV-1, IV-2, and V), which differ only in their 5′ untranslated regions 16-18 ; the mRNAs IV-1 and IV-2 are two splicing variants of the mRNA IV primary transcript. 19 All of these mRNAs encode a protein that is involved in GSH extracellular breakdown and contributes to the intracellular cysteine and GSH supply to epithelial cells. 20,21 We demonstrated that GGT transcription is initiated on different promoters in mature biliary cells and in immature perinatal hepatocytes 22 ; we also established that, in undifferentiated hepatoma cells, GGT transcription originates from the distal promoter P5, which is silent in differentiated cells. 17
In the present work we studied the GGT gene expression pattern along with the differentiation of hepatic precursor cells. We report that GGT gene transcription originates from three promoters in hepatic precursor cells and that this expression profile is differentially altered, depending on whether these cells differentiate into the hepatocytic or biliary lineage.
Materials and Methods
Animals
Wistar rats were obtained from Charles River Company (St. Aubin les Elbeuf, France) and maintained in our animal facility. Time-pregnant rats were used for investigations of prenatal and postnatal stages. Gestation age was defined as the time after the onset of mating period (E1: 24 hours after mating); the day of birth was defined as postnatal day 1 (PN1). Hepatic necrosis and regeneration were induced in adult male rats by a single intraperitoneal injection of galactosamine D (70 mg/100 g body weight) as previously described. 23
Material
Hydrocortisone, Na+ butyrate, fluorescein, isothiocyanate, levamisole trypsin, and galactosamine D were obtained from Sigma-Aldrich (St.-Quentin Fallavier, France). MetaPhor agarose gel and SYBR green I were from FMC Bioproducts (Rockland, ME). Mouse monoclonal antibodies against rat CK19 were from Novocastra (France); anti-mouse IgG1 antibodies, streptavidin horseradish peroxidase complex, [γ-32P]ATP, [α-32P]UTP, and Rapid-hyb buffer were obtained from Amersham (Les Ulis, France). Taq DNA polymerase was from Appligene (Illkirch, France). Mouse monoclonal antibodies against surface components of rat hepatocytes (anti-HES6) and biliary epithelial cells (anti-BDS7) were a gift of N. Marceau and have been described elsewhere. 24 Dig-dUTP oligonucleotide tailing, digoxigenin-UTP, antidigoxigenin alkaline phosphatase, and nitroblue tetrazolium/bromo-chloro-indolyl-phosphate were obtained from Boehringer Mannheim. Fluorescein isothiocyanate anti-mouse antibodies were from Valbiotech (Paris, France).
Cell Isolation and Culture
Livers were isolated from 12-day-old rat fetuses and washed in 10 mmol/L HEPES buffer (pH 7.4). Cells were dispersed in this buffer (supplemented with 3 mmol/L CaCl2 and 0.5 mg/ml collagenase) under gentle stirring for 30 minutes at 37°C. The cell suspension was washed twice in culture medium 25 supplemented with 5 μg/ml of bovine serum albumin, 100 μg/ml streptomycin sulfate, and 100 IU/ml penicillin. Cells from three livers were seeded per well on a 24-well plate in 500 μl of basal medium supplemented with 10% fetal calf serum. After 24 hours the medium was renewed, and hemisuccinate hydrocortisone (4.5 × 10⁻⁵ mol/L) with or without 3.75 mmol/L Na+ butyrate was added; this medium was changed at 24-hour intervals for 5 days.
RNA Preparation and Quantification
Total RNA was isolated from frozen tissues or cells according to the method of Chomczynski. 26 RNA samples were then loaded on an 1% agarose denaturing gel containing 6% formaldehyde and stained by SYBR green I; the 28 S rRNA bands were quantitated to cross-check the amount of RNA initially estimated from the optical density at 260 nm.
Standard Reverse Transcriptase-Polymerase Chain Reaction Analysis
Total RNA (5–400 ng) was reverse transcribed by the extension of antisense primers B (Figure 1A) ▶ . Sequences from GGT mRNAs I–V were amplified between the primers A and B (Figure 1A) ▶ in 100 μl of 0.16 mmol/L deoxynucleoside triphosphates, 0.4 μmol/L of each oligomer, 10 mmol/L Tris-HCl (pH 9), 50 mmol/L KCl, 1.5 mmol/L MgCl2, 0.1% Triton X-100, 0.2 mg/ml gelatin, and 2 U of Taq DNA polymerase. The 35-cycle polymerase chain reaction (PCR) pattern was denaturation at 94°C (1 minute), annealing between 55°C and 58°C (1 minute), and extension at 72°C (2 minutes). PCR products were separated on a 3% agarose gel, blotted onto a nylon membrane, and hybridized to an NH-22 oligomer (5′-GTCCAGTAGGAGCCCCCAAACC-3′), which extends from −27 to −7 in the 5′ sequence common to all GGT mRNAs or to the SN-4 oligomer (5′-CCTAAGCTGTCTCAGGATCC-3′), which maps from −566 to −547 in the specific GGT mRNA V sequence. 17 All of these oligonucleotides were labeled at the 5′ ends, using T4 polynucleotide kinase and [γ-32P]ATP. Hybridization was performed at 42°C with Rapid-hyb buffer according to the manufacturer’s instructions. Blots were washed at 42°C in 1× standard saline citrate (SSC) and scanned on STORM 840 Phosphor Screen (Molecular Dynamics).
Figure 1.

Oligonucleotides used in PCR reactions and in the construction of DNA templates for GGT RNA standard synthesis. A: Sequence of the oligonucleotides. Positions of the oligonucleotides in the different GGT mRNA sequences are numbered 5′ to 3′ from the A (+1) in the initiation codon. Standard and quantitative amplifications of GGT transcripts I–V were performed with specific sets of primers A and B. B: Schematic representation of the construction of GGT DNA templates used to transcribe mRNA I–IV and mRNA V standards. Oligomers A (extended with T7 sequence), B, C (extended with tail 2), and D (extended with tail 1), used to construct DNA templates by directed in vitro mutagenesis, are mapped on diagrams of the 5′ region of GGT mRNAs I–IV and mRNA V. The open boxes correspond to the beginning of the reading frame; the thick lanes to the 5′ untranslated sequence from −1 to −144, common to all GGT transcripts; and the thin lanes stand for specific regions at each 5′ mRNA end. The NH-22 and SN-4 probes are mapped on the diagram.
Quantitative Reverse Transcriptase-PCR Analysis
Quantitation of the different GGT mRNA transcripts was obtained by competitive reverse transcriptase-PCR (RT-PCR) analysis. 27 This involves reverse transcription and amplification of the transcript of interest along with known amounts of an RNA standard transcribed from a DNA template corresponding to the sequence to be amplified with an extra 20-nucleotide internal sequence. DNA templates were obtained from plasmids containing the 5′-specific sequences of the mRNAs III, 16 IV, 19 and V, 17 by directed mutagenesis as depicted in Figure 1B ▶ . Two amplifications were carried out between the T7-tailed oligomer A and the tail 2-oligomer C, and between oligomer B and the tail 1-oligomer D, separately; T7 promoter, tail 1, and its complementary tail 2 sequence are those used by Grassi et al. 27 Amplification products were annealed, and a second PCR was performed between the T7 oligomer A and oligomer B to generate DNA templates. GGT RNA controls were obtained by run-off in vitro transcription of 50 ng of the DNA templates, using T7 RNA polymerase (Promega), in the supplied buffer and 10 μCi of [α-32P]UTP (3000 Ci/mmol) as a tracer. DNA templates were removed from the medium by RNase-free DNase I digestion, and a PstI digestion was performed in the 20-bp extra sequence to prevent amplification from the remaining DNA template. Synthesized RNA was checked on a denaturing acrylamide gel, and its amount was determined from incorporated radioactive UTP.
A fixed amount of RNA sample (5–500 ng), along with increasing amounts of in vitro transcribed standard RNA (5 × 10 2 to 5 × 10⁶molecules), was reversed transcribed from the antisense primer B, and GGT sequences were amplified from different sets of primers A and B, as described above. Endogenous RNA and its corresponding standard were amplified with the same efficiency because these RNAs differ only by a 20-nucleotide sequence inserted into the standard. A 10-μl aliquot of the PCR reaction was diluted (1:5) and subjected to a two-cycle PCR reaction under the above conditions to prevent heterodimer formation between the control and the DNA analyzed, as reported previously. 28 Control PCR reactions, without reverse transcriptase, were performed to check the absence of DNA template in the RNA samples. PCR products were separated on 2% or 3% MetaPhor agarose gels and stained with SYBR green I according to the supplier’s recommendation. The fluorescence signal was scanned on a STORM 840 Phosphor Screen (Molecular Dynamics) and analyzed using Image Quant v 1.11 software.
Synthesis of Specific RNA and Oligomer GGT Probes for in Situ Hybridization
Digoxigenin-labeled antisense or sense probes were synthesized using T7 or SP6 polymerase and the appropriate templates. These cRNA probes were purified by ethanol precipitation and their size was checked on 1% agarose gel. The cRNA-3 and cRNA-4 probes, specific for GGT mRNA III and GGT mRNA IV, respectively, were obtained as previously described. 22 DNA fragments extending from nucleotide −445 up to nucleotide −156 upstream from the GGT mRNA V transcription start site were amplified from the plasmid pGEM-3-V2. 17 Amplified products were subcloned into pGEM-T Vector (Promega). The cRNA-5 probe specific for mRNA V was obtained from this plasmid digested with SalI (antisense probe) or NcoI (sense probe) and transcribed using T7 or SP6 promoter, respectively.
Oligonucleotide probes used for in situ hybridization were a 26-mer antisense sequence specific for GGT mRNA IV (oligomer AS4: 5′-GCCTCTTTACATCGTGGATGCATAGG-3′) and its complementary sense probe (oligomer: S4). These oligonucleotides correspond to the sequence from nucleotide −454 to nucleotide −429 in the 5′ mRNA IV specific region, upstream from the initiation codon. These high-performance liquid chromatography-purified oligonucleotides were labeled using the Dig-dUTP Oligonucleotide Tailing Kit according to the supplier’s instructions.
In Situ Hybridization
Rat embryos from E12 to E18 and livers from newborn and postnatal rats were rinsed in Ca2+- and Mg2+-free phosphate-buffered saline (PBS), fixed overnight in 4% paraformaldehyde (PFA) at +4°C, and embedded in paraffin. Sections (5 μm) were mounted on superfrost+ slides (CML, Nemours, France) and stored at room temperature. After deparaffinization and rehydration, sections were rinsed in PBS. Deproteinization was carried out in 0.2 N HCl for 15 minutes at room temperature. Sections were then digested with proteinase K (5–10 μg/ml) in 100 mmol/L Tris-HCl (pH 7.5), 2 mmol/L CaCl2 for 20 minutes at 37°C, postfixed in 4% PFA for 15 minutes at room temperature, and acetylated for 10 minutes at room temperature in 100 mmol/L triethanolamine (pH 8) containing 0.25% acetic anhydride. The sections were then rinsed in 2× SSC and dehydrated in graded ethanol baths.
For in situ hybridization using digoxigenin-labeled RNA probes, sections were prehybridized for 4 hours in 50% deionized formamide, 1× Denhardt’s solution, 200 mmol/L NaCl, 10 mmol/L Tris (pH 7.5), 5.5 mmol/L NaH2PO4, 2 mmol/L Na2HPO4, and 5 mmol/L EDTA containing 1 mg/ml of tRNA and then hybridized for 16 hours in the same buffer containing 10% dextran sulfate and 1 μg/ml of digoxigenin-labeled riboprobe. Prehybridization and hybridization were performed at 55°C for GGT mRNA III and GGT mRNA V. After hybridization, sections were washed successively in 2× SSC, 1× SSC, 0.5× SSC, and 0.1× SSC (two times) for 30 minutes. Washings were performed at 50°C for GGT mRNA V and 55°C for GGT mRNA III. GGT mRNA IV detection was performed by in situ hybridization, using digoxigenin-labeled oligonucleotide-specific probes, as we did not succeed in obtaining a signal with the short specific cRNA-4 sequence. Sections were prehybridized for 2 hours at 37°C in 100 μl of hybridization buffer (50% deionized formamide, 4× SSC, 1× Denhardt’s solution, 500 μg/ml of tRNA and 250 μg/ml of ssDNA). Hybridization was performed for 16 hours at 37°C in 40 μl of hybridization buffer containing 5% dextran sulfate and 100 nmol/L dig-labeled oligonucleotide probe. After hybridization, sections were briefly rinsed in 2× SSC at room temperature, then in 2× SSC for 30 minutes at 37°C, and, finally, twice in 1× SSC for 30 minutes at 37°C.
Hybridization signals were detected using digoxigenin nucleic acid with antidigoxigenin alkaline phosphatase antibodies (Fab fragments) and visualized with nitroblue tetrazolium/bromo-chloro-indolyl-phosphate and high-molecular-weight polyvinyl alcohol (10%) to prevent diffusion of reaction intermediates. The reaction was carried out for 4–24 hours. Sections were then counterstained with methyl green. Negative controls included hybridization with digoxigenin-labeled sense riboprobe or oligonucleotide sense probe.
Histochemistry
Immunodetection of CK19 was carried out on tissue sections treated as described above for in situ hybridization up to the PBS rinse that followed rehydration. A treatment with 1 mg/ml of trypsin was carried out for 30 minutes at 37°C to demask the antigen. Preincubation of the sections in 10% normal goat serum, incubation with CK19 (1:100) and secondary biotinylated antibodies, and detection using streptavidin horseradish peroxidase complex were performed as previously described. 22 Sections were then counterstained with methyl green. Controls performed without the primary antibody were negative. Immunodetection of the BDS7 or the HES6 antigen was performed on cells fixed in 4% PFA, 0.1 mol/L cacodylate buffer for 20 minutes at 4°C, using the respective mAbs and a fluorescein isothiocyanate-tagged goat anti-mouse secondary antibody as previously described. 29 Histochemical GGT detection and detection of GGT activity in homogenates were performed as previously described. 22
Results
RT-PCR Analysis of GGT Transcripts in the Developing Liver
We analyzed the expression of GGT transcripts by RT-PCR, using five sets of primers. To demonstrate the specificity of these sets of PCR primers, we first analyzed the DNA fragments, amplified from these primers and E18 liver RNA samples by hybridization to an internal oligomer (Figure 2) ▶ . The RNA amplification primed by the oligomers designed from the GGT mRNA III and the GGT mRNA V yielded 225-bp (lane 3) and 210-bp fragments (lane 5), respectively, as expected from the mRNA III and mRNA V sequences (Figure 2) ▶ . The set of primers designed from the mRNA IV produced 276-bp and 528-bp fragments (lane 4) that were expected from the mRNA IV-1 and mRNA IV-2 sequences, respectively. In this reaction, we also consistently noticed a minor band (350 bp) that could correspond to another GGT mRNA IV variant. The 294-bp and 306-bp fragments amplified from kidney RNA samples (data not shown), using specific primers for mRNA I and mRNA II, were not detected in this liver sample (lanes 1 and 2) or in any other liver samples analyzed in this study. This indicates the absence of these two GGT transcripts in the liver. The 225-bp-, 276-bp-, 528-bp-, and 210-pb-specific fragments are therefore suitable for quantitative analysis of the GGT mRNA III, IV-1, IV-2, and V transcripts, respectively.
Figure 2.

Southern blot analysis of GGT PCR products. Total RNA from 18-day-old liver embryos (lanes 1, 2, 4, 5: 400 ng; lane 3: 5 ng) was reverse transcribed and amplified, using the five different sets of oligomers A and B (Figure 1) ▶ specific for GGT mRNAs I, II, III, IV, or V (lanes 1–5). Amplified products were separated on an agarose gel, blotted, and analyzed by hybridization to two internal oligomers (NH-22, specific for mRNAs I–IV, and SN-4, specific for mRNA V). The sizes reported on the autoradiogram were deduced from a DNA ladder run on the same gel. The blot was scanned on STORM 840 Phosphor Screen (Molecular Dynamics).
The amounts of GGT mRNAs were assessed by quantitative RT-PCR, as illustrated in Figure 3A ▶ for the analysis of GGT mRNA V from the E12 liver RNA sample. Total RNA (150 ng) was coamplified along with increasing amounts (from 5 × 10 2 to 5 × 10 4 molecules) of mRNA V-specific standard, using mRNA V-specific primers. Quantitative fluorescence analysis of the PCR products showed that the intensity of the 230-nucleotide band amplified from the mRNA V standard increased with the amount of added molecules (Figure 3A) ▶ , whereas the intensity of the 210-nucleotide-specific mRNA V fragment decreased with the amount of RNA standard. The ratios of the amounts of amplified standards to the amounts of amplified endogenous products plotted against amounts of standard molecules yielded a straight line (Figure 3B) ▶ . A ratio of 1 for the amount of the two PCR fragments, was obtained for 2 × 10 4 molecules of the RNA standard. This value corresponds to the amount of mRNA V molecules in the analyzed RNA sample. A similar analysis was performed for the GGT mRNAs III, IV-1, IV-2, and V at different stages of liver development; the results are shown in Figure 3C ▶ . The values for mRNA IV corresponded to the sum of the values obtained for mRNA IV-1 and IV-2. These two splicing variants of the primary transcript initiated on promoter P4 are expressed in a ratio that remains unchanged during liver development.
Figure 3.

Quantitation of GGT mRNA transcripts during liver development. A: Analysis of RT-PCR products. DNA fragments amplified from 150 ng of E12 liver embryo RNA in the presence of increasing amounts (5 × 10 2 to 5 × 10 4 molecules) of added mRNA V standard were separated on a 2.5% Metaphor agarose gel along with a DNA ladder and stained with SYBR green. Fluorescence signals of the 210-bp fragment (amplified from the endogenous RNA) and the 230-bp fragment (amplified from the standard RNA) were scanned on a STORM 840 Phosphor Screen (Molecular Dynamics) and analyzed using Image Quant v 1.11 software. No RNA was added in lane 0; lane control (-RT) is a control without reverse transcriptase. B: Quantitation of RT-PCR products. For each amplification reaction, the ratio between the intensities of the two bands (endogenous and standard RNAs) was plotted against the amount of standard RNA molecules added in the sample. C: Amount of GGT mRNA transcripts during liver development. The amounts of GGT mRNAs were assessed in RNA from the liver at different developmental stages, from embryonic day 12 (E12) up to the adult stage. The values (mean of two experiments), obtained as described in A and B for mRNA V at E12, are expressed in molecules per μg of total RNA.
In 12-day-old rat liver embryos that are at a stage when hepatoblasts have not yet matured into the hepatocytic or biliary lineages, we detected the expression of GGT mRNAs III, IV, and V, which represented 55%, 35%, and 10%, respectively, of the total GGT mRNA (Figure 3C) ▶ . The GGT mRNA III level increased from 7.5 × 10 5 molecules/μg of total RNA in 12-day embryonic liver to 1.8 × 10 6 molecules/μg of total RNA at birth (PN1), when most of the hepatoblasts have differentiated into immature hepatocytes. This amount decreased abruptly in the early postnatal period corresponding to the final maturation of hepatocytes. In contrast, mRNA IV and mRNA V accumulation in the liver decreased by eightfold from E12 to E18, in parallel with hepatoblast differentiation. From E18 up to the adult stage, mRNA V expression continued to decrease down to a barely detectable level, whereas mRNA IV accumulation was induced up to 10-fold and accounted for 90% of the GGT transcripts in the adult liver.
In Situ Hybridization Analysis of GGT Transcripts during Liver Development
The expression of the various GGT mRNA transcripts was localized by in situ hybridization in liver sections at different developmental stages. In E14 (Figure 4A) ▶ as well as in E12 liver (not shown), GGT mRNA III accumulation was revealed in all hepatic cells by a uniform and specific signal not detected in a serial section hybridized with the control sense probe (Figure 4B) ▶ . At this stage, most of the cells correspond to hepatoblasts and have the capacity to differentiate into either of the hepatic lineages. 4,5 At a later developmental stage (E18), GGT mRNA III staining was no longer uniform over the section (Figure 4C) ▶ . Cells negative for GGT mRNA III exhibited a round nucleus that was counterstained more intensively than was the hepatic cell nucleus. These cells, which were α-fetoprotein-negative, correspond to hemopoietic cells, as previously shown. 22 Staining of PN2 liver sections (Figure 4D) ▶ revealed a weak expression of GGT mRNA III in immature hepatocytes and no expression in cells surrounding bile ducts (arrow). The GGT mRNA III expression decreased from birth, and no GGT mRNA III signal was detected in the adult liver (not shown).
Figure 4.

Localization of GGT mRNA III transcripts in fetal and adult livers. Paraffin sections from 14-day-old (E14) (A and B) and 18-day-old (E18) (C) rat embryos and 2-day postnatal (PN3) liver (D) were hybridized to antisense (A, C, and D) or sense (B) cRNA-3 probe. At E14, GGT mRNA III staining occurs uniformly on the section. Arrowheads in C mark hemopoietic cells, and arrows in D correspond to biliary cells. Original magnification: ×630.
GGT mRNA IV accumulation also occurred uniformly in hepatoblasts, as illustrated in a 14-day-old embryo section (Figure 5A) ▶ . No signal appeared in an adjacent section hybridized with the sense probe (Figure 5B) ▶ . GGT mRNA IV accumulation decreased from this stage and became undetectable in liver sections from E16 (not shown) until birth (Figure 5C) ▶ . At birth, cytokeratin 19-positive bile duct cells (Figure 5D) ▶ were negative for GGT mRNA IV (Figure 5C) ▶ . Two days after birth, GGT mRNA IV accumulation (Figure 5E) ▶ reappeared only in cells around bile ducts that were CK19 positive (Figure 5G) ▶ , and they did not exhibit any staining with the control probe (Figure 5F) ▶ .
Figure 5.
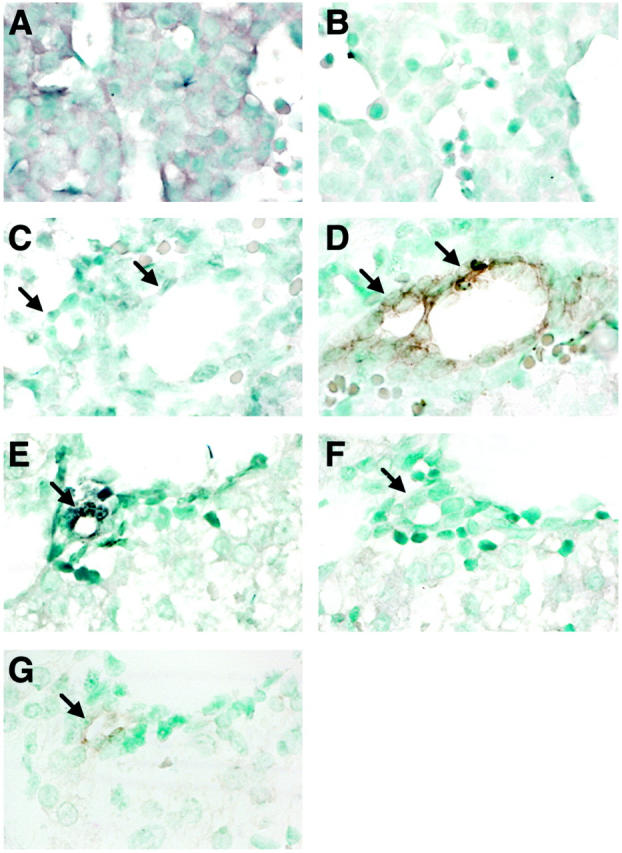
Localization of GGT mRNA IV transcripts in fetal liver. Paraffin sections (×630) from E14 embryo (A and B), newborn (PN1) (C and D), and PN3 (E–G) livers were hybridized to GGT antisense oligomer AS4 (A, C, and E) or sense oligomer S4 (B and F) probes. Immunostaining for cytokeratin 19 was performed on serial sections of PN1 (D) and PN3 livers (G). GGT mRNA IV labeling occurs in all cells at E14, is absent at PN1, and reappears at PN3 in biliary CK19-positive cells. Arrows mark biliary cells.
As observed for GGT mRNA III and IV, GGT mRNA V was uniformly expressed in hepatic cells in the 14-day-old liver embryo (Figure 6A) ▶ and was not detected with the sense cRNA-5 probe (Figure 6B) ▶ . An identical pattern of GGT mRNA V staining was observed in 12-day-old embryo sections (not shown). At a later developmental stage (16-day-old embryo), GGT mRNA V accumulation was very low (Figure 6C) ▶ and disappeared at E18 (Figure 6E) ▶ ; no signal occurred in adjacent sections hybridized to the sense cRNA-5 probe (Figure 6, D and F) ▶ . No signal was detected in other organs of the embryo (data not shown).
Figure 6.

Localization of GGT mRNA V transcripts in fetal liver. Paraffin liver sections (×630) from 14-day-old (E14) (A and B), 16-day-old (E16) (C and D), and 18-day-old (E18) (E and F) rat embryos were hybridized to cRNA-5 GGT antisense (A, C, and E) and sense (B, D, and F) probes. GGT mRNA V accumulation is detected at E14 in all cells; it decreases at E16 and is not detected at E18. The nuclei of hemopoietic cells are smaller and stain more intensely than those from hepatic cells.
RT-PCR Analysis of GGT Transcripts in the Liver of Galactosamine-Treated Rats
Rat liver regeneration, in response to galactosamine D injury, induces an early proliferation of small oval-shaped cells, which then undergo hepatocytic differentiation. 10,23 Two days after the treatment, these oval cells formed small rows or duct-like structures radiating from the portal vein in the disorganized hepatocytic plates, as shown on Figure 7 ▶ and as previously documented. 10,23 An increase in liver GGT activity was measured from 1 day after the treatment; 3 days later, this activity reached its maximum and represented a 15-fold induction over the basal level. Twelve days after the treatment, GGT activity returned to its basal level. This increase in liver GGT activity was associated with GGT-positive oval cell proliferation, whereas the basal GGT level corresponded to the activity expressed in biliary cells as shown in liver sections (Figure 7) ▶ .
Figure 7.

Histochemical staining showing GGT activity in the liver of a galactosamine-treated rat. GGT staining was performed on paraffin sections obtained from a liver before (A) and 2 days after (B) galactosamine administration. Original magnification: ×200. In the control liver (A), GGT staining appears only in biliary cells around bile ducts (arrow); at day 2 (B), GGT staining is seen in bile ducts (arrow) and in oval cells (arrowheads) adjacent to bile ducts in the portal area and radiating into the disorganized liver parenchyma.
Analysis of GGT mRNA expression indicated that the GGT mRNA IV and V levels rapidly increased and peaked 1 day after treatment at values representing 3 and 10 times their respective basal levels (Figure 8) ▶ . The increase in mRNA III level, detected from day 2, reached its maximum value at day 3, which represents a 60-fold induction over the basal level (Figure 8) ▶ . Thus oval cell proliferation brings about an early induction of GGT mRNAs III, IV, and V. Differentiation of these cells into hepatocytes, which occurred from day 3, 10,23 is accompanied by a rapid decrease in mRNAs IV and V, which returned to basal levels at days 3 and 6, respectively. The mRNA III expression remained high until the seventh day, then decreased sharply and returned to its low basal level at day 10. The GGT mRNA expression pattern in oval cells differentiating into hepatocytes was very similar to the profile observed in liver development from the E12 to the adult stage (Figure 3C) ▶ .
Figure 8.

Amount of GGT mRNA transcripts in the liver of galactosamine-treated rats. The amounts of GGT mRNAs were assessed in RNA from control livers (day 0) and at different periods of time after the treatment (day 1 to day 10), by quantitative RT-PCR. The GGT mRNA values (mean of three determinations), obtained as described in Figure 3 ▶ , are expressed in molecules per μg of total RNA.
RT-PCR Analysis of GGT Transcripts in Cultured Hepatoblasts Differentiating along Hepatocytic and Biliary Phenotypes
One day after seeding, E12 hepatoblasts formed islands of small cells that had dark and ovoid nuclei and were negative for HES6 and BDS7, two liver cell lineage markers 4,29 (data not shown). After 5 days in culture, the cells displayed a polygonal shape, a round nucleus with a visible nucleolus, and a large and dense cytoplasm, revealing the presence of numerous organelles (Figure 9A) ▶ . Distinct intercellular spaces were seen, which are characteristic of hepatocytes in culture and similar to those observed in embryonic liver. In these cultures, most of the cells were positive for the HES6 hepatocyte marker, as revealed by the fluorescent signal (Figure 9C) ▶ , and negative for the biliary marker BDS7 (not shown). In contrast, after 5 days of exposure to butyrate, a treatment known to induce a biliary differentiation, 29 the cells exhibited a flattened morphology, a clear cytoplasm, an oval nucleus with several nucleoli, and a poorly delineated plasma membrane (Figure 9B) ▶ . Those cells were mostly positive for the biliary antigen BDS7 (Figure 9D) ▶ . These characteristics show that E12 hepatoblasts cultured in the absence of Na+ butyrate differentiated into the hepatocytic pathway and that butyrate treatment induced differentiation into the biliary lineage.
Figure 9.

Morphology of E12 hepatoblasts cultured in vitro and expression of HES6 and BDS7. Phase-contrast (A and B, ×120) and immunofluorescence (C and D, ×320) microscopy of hepatoblasts from E12 liver cultured with standard medium (A and C) and in the presence of Na+ butyrate (B and D). C and D: Immunodetection of HES6 (C) and BDS7 (D).
The expression of the GGT mRNAs was assessed quantitatively in 12-day embryonic liver cells cultured under the standard medium and in the presence of Na+ butyrate. Hepatocytic differentiation in standard culture conditions induced a 150-fold decrease in GGT mRNA IV accumulation (Figure 10) ▶ . In contrast, cells that were treated with Na+ butyrate and displayed biliary characteristics exhibited a 170-fold increase in their GGT mRNA IV content (Figure 10) ▶ . Culture under either condition did not significantly affect the other GGT transcripts (Figure 10) ▶ . These data show that GGT mRNA IV expression is tightly associated with biliary differentiation and is controlled by positive or negative factors that are regulated when cells enter the biliary pathway.
Figure 10.

Amount of GGT mRNA transcripts in E12 hepatoblasts cultured in vitro. The amounts of GGT mRNAs were assessed by quantitative RT-PCR in cells before seeding (time 0) and after a 5-day culture (time 5) in the presence or in the absence of Na+ butyrate. The values (mean of two experiments), obtained as described in Figure 3 ▶ , are expressed in molecules of GGT mRNA per μg of total RNA.
Discussion
GGT activity is expressed at the early stages of liver development before hepatoblasts undergo biliary or hepatocytic differentiation. It peaks around birth and then decreases sharply until the adult stage, when it remains only in biliary cells. 12 We showed previously that GGT gene expression in normal and transformed liver cells originates from different promoters, depending on the cell type and its state of differentiation. 17,22 These data prompted us to investigate whether the GGT mRNA expression pattern could be altered during hepatic precursor cell differentiation. We report here that GGT gene transcription originates from three promoters in hepatoblasts and oval cells and that this expression profile is differentially altered, depending on whether these cells differentiate into the hepatocytic or biliary lineage.
In 12-day and 14-day embryonic livers, the GGT gene is expressed from promoters P3, P4, and P5 in hepatoblasts before their differentiation into the hepatocytic or biliary lineage. GGT mRNA III is the major GGT transcript detected from E12 until the early postnatal period in immature hepatocytes. GGT promoter P3 expression disappears, along with α-fetoprotein gene expression, during the final maturation of hepatocytes after birth. The decrease in GGT mRNA IV and V expression from E12 to E18 parallels the differentiation of the bulk of the hepatoblasts in the hepatocytic lineage, 4 characterized in vivo by the extinction of bipotent characters such as glutathione transferase P, M2-pyruvate kinase, 30 or OC-2 antigen. 7 Therefore, hepatoblast differentiation into the hepatocytic pathway is associated with alterations in GGT gene expression and leads to an extinction of promoters P4 and P5. CK-19-positive biliary cells emerging in the portal area at birth express only mRNA IV. In the adult, these cells represent less than 5% of the liver cells and account for nearly all of the liver GGT activity. It is worth noting that, during hepatoblast differentiation, GGT mRNA IV expression parallels OC-2 antigen expression, which occurs transiently in hepatoblasts and is reactivated in immature biliary cells already expressing OV-6 and CK19. 4,6 Thus differentiation of liver precursor cells into the biliary pathway can be correlated with the extinction of GGT expression from promoters P3 and P5 and with an induction of GGT expression from promoter P4.
Liver necrosis induced by galactosamine D induces a rapid proliferation of GGT-positive oval cells, which then differentiate into hepatocytes and contribute to hepatic regeneration. 10,23 Proliferation of GGT-positive oval cells is associated with an early induction in the accumulation of GGT mRNAs III, IV, and V. Their subsequent differentiation into immature hepatocytes leads to an extinction of the mRNA IV and V expression from promoters P4 and P5. GGT expression from promoter P3 ceases later with final hepatocyte maturation. This GGT expression pattern observed at the different stages of this experimental model mimicks that observed during liver development, when hepatoblasts differentiate mainly into the hepatocytic pathway. It confirms that hepatic precursor cells lose promoter P4 and P5 expression when they enter the hepatocytic pathway.
The switch in the expression of the different GGT promoters was confirmed in hepatoblasts induced to differentiate in vitro. In these precursor cells, GGT promoter P4 expression is strongly activated when cells differentiate into the biliary pathway and silenced when they differentiate into the hepatocytic pathway. In these experiments we did not observe significant alteration in mRNA III or mRNA V levels, most probably because these alterations occur later in the differentiation process, as observed in the galactosamine model. This differentiation step could not be achieved in these cultures.
The physiological significance of the GGT gene expression diversity, well conserved among different species 18 and yielding a unique protein, is still unknown. It should be pointed out that three promoters of the GGT gene are active in liver precursor cells that rely uniquely on GGT for their cysteine supply. The appearance, later, of an endogenous cysteine supply in the hepatocytes through the cystathionine pathway parallels the suppression of GGT expression. It can be speculated that variations in the use of alternative promoters allow for fine-tuning of GGT expression through mRNAs that may be different in their half-lives or their translational capacities.
It remains that GGT mRNAs, because of their specific 5′ untranslated regions, provide a panel of unique molecular probes to identify short windows of liver cell differentiation. The analysis of GGT promoter regulation should also provide further insight into the molecular mechanisms of liver cell differentiation. GGT promoter P5 expression is restricted to undifferentiated liver cells, which is consistent with the high level of GGT mRNA V expression in HTC and H5 hepatoma cells and its absence in more differentiated hepatoma cells. 17 We already identified, in this promoter, a proximal element required for its activity, which binds HNF-3 and AP-1 factors. 17 GGT promoter P5 extinction, along with liver cell differentiation, could be linked to the decrease in the HNF3β/HNF3α ratio that occurs during liver development. 31 Such a hypothesis is supported by the importance of the HNF3β/HNF3α ratio in the expression of the CC10 gene, which bears a similar cis-acting element containing HNF3 and AP-1 overlapping sites. 32 Similarly, the knowledge of factors involved in P4 promoter activation or extinction should be of value in understanding the mechanisms underlying liver precursor cell differentiation in both hepatic lineages.
Acknowledgments
We thank Dr. Guellaen, Dr. J. Hanoune, and Dr. Lotersztajn for their helpful comments and Dr. L. Aggerbeck for the careful correction of the manuscript.
Footnotes
Address reprint requests to Dr. Yannick Laperche, INSERM Unité 99, Hôpital Henri Mondor, 94010 Créteil, France. E-mail: laperche@im3.inserm.fr.
Supported by INSERM, the Association pour la Recherche contre le Cancer, and the University Paris Val de Marne. Also supported by a fellowship from the Ministère de l’Enseignement et de la Recherche (N. H.) and a fellowship from the Fondation pour la Recherche Médicale (T. S.).
References
- 1.Cascio S, Zaret KS: Hepatocyte differentiation initiates during endodermal-mesenchymal interactions prior to liver formation. Development 1991, 113:217-225 [DOI] [PubMed] [Google Scholar]
- 2.Fausto N, Lemire JM, Shiojiri N: Cell lineages in hepatic development and the identification of progenitor cells in normal and injured liver. Proc Soc Exp Biol Med 1993, 204:237-241 [DOI] [PubMed] [Google Scholar]
- 3.Shiojiri N: Enzymo- and immunocytochemical analysis of the differentiation of liver cells in the prenatal mouse. J Embryol Exp Morphol 1981, 62:139-152 [PubMed] [Google Scholar]
- 4.Germain L, Blouin MJ, Marceau N: Biliary epithelial and hepatocytic cell lineage relationships in embryonic rat liver as determined by the differential expression of cytokeratins, alpha-fetoprotein, albumin, and cell surface-exposed components. Cancer Res 1988, 48:4909-4918 [PubMed] [Google Scholar]
- 5.Shiojiri N, Lemire JM, Fausto N: Cell lineages and oval cell progenitors in rat liver development. Cancer Res 1991, 51:2611-2620 [PubMed] [Google Scholar]
- 6.Tee LB, Kirilak Y, Huang WH, Morgan RH, Yeoh GC: Differentiation of oval cells into duct-like cells in preneoplastic liver of rats placed on a choline-deficient diet supplemented with ethionine. Carcinogenesis 1994, 15:2747-2756 [DOI] [PubMed] [Google Scholar]
- 7.Hixson DC, Chapman L, McBride A, Faris R, Yang L: Antigenic phenotypes common to rat oval cells, primary hepatocellular carcinomas and developing bile ducts. Carcinogenesis 1997, 18:1169-1175 [DOI] [PubMed] [Google Scholar]
- 8.Faris RA, Monfils BA, Dunsford HA, Hixson DC: Antigenic relationship between oval cells and a subpopulation of hepatic foci, nodules, and carcinomas induced by the “resistant hepatocyte” model system. Cancer Res 1991, 51:1308-1317 [PubMed] [Google Scholar]
- 9.Evarts RP, Hu Z, Omori N, Omori M, Marsden ER, Thorgeirsson SS: Precursor-product relationship between oval cells and hepatocytes: comparison between tritiated thymidine and bromodeoxyuridine as tracers. Carcinogenesis 1996, 17:2143-2151 [DOI] [PubMed] [Google Scholar]
- 10.Lemire JM, Shiojiri N, Fausto N: Oval cell proliferation and the origin of small hepatocytes in liver injury induced by d-galactosamine. Am J Pathol 1991, 139:535-552 [PMC free article] [PubMed] [Google Scholar]
- 11.Bisgaard HC, Parmelee DC, Dunsford HA, Sechi S, Thorgeirsson SS: Keratin 14 protein in cultured nonparenchymal rat hepatic epithelial cells: characterization of keratin 14 and keratin 19 as antigens for the commonly used mouse monoclonal antibody OV-6. Mol Carcinog 1993, 7:60-66 [DOI] [PubMed] [Google Scholar]
- 12.Iannocone PM, Kozuimi J: Pattern and rate of disappearance of gamma-glutamyl transpeptidase activity in fetal and neonatal rat livers. J Histochem Cytochem 1983, 31:1312-1316 [DOI] [PubMed] [Google Scholar]
- 13.Tee LB, Gilmore KS, Meyer DJ, Ketterer B, Vandenberghe Y, Yeoh GC: Expression of glutathione S-transferase during rat liver development. Biochem J 1992, 282:209-218 [DOI] [PMC free article] [PubMed] [Google Scholar]
- 14.Kitahara A, Satoh K, Nishimura K, Ishikawa T, Ruike K, Sato K, Tsuda H, Ito N: Changes in molecular forms of rat hepatic glutathione S-transferase during chemical hepatocarcinogenesis. Cancer Res 1984, 44:2698-2703 [PubMed] [Google Scholar]
- 15.Power CA, Griffiths SA, Simpson JL, Laperche Y, Guellaen G, Manson MM: Induction of gamma-glutamyl transpeptidase mRNA by aflatoxin B1 and ethoxyquin in rat liver. Carcinogenesis 1987, 8:737-740 [DOI] [PubMed] [Google Scholar]
- 16.Brouillet A, Darbouy M, Okamoto T, Chobert MN, Lahuna O, Garlatti M, Goodspeed D, Laperche Y: Functional characterization of the rat gamma-glutamyl transpeptidase promoter that is expressed and regulated in the liver and hepatoma cells. J Biol Chem 1994, 269:14878-14884 [PubMed] [Google Scholar]
- 17.Nomura S, Lahuna O, Suzuki T, Brouillet A, Chobert MN, Laperche Y: A specific distal promoter controls gamma-glutamyl transpeptidase gene expression in undifferentiated rat transformed liver cells. Biochem J 1997, 326:311-320 [DOI] [PMC free article] [PubMed] [Google Scholar]
- 18.Chikhi N, Holic N, Guellaen G, Laperche Y: Gamma-glutamyl transpeptidase gene organization and expression: a comparative analysis in rat, mouse, pig and human species. Comp Biochem Physiol B 1999, 122:367-368 [DOI] [PubMed] [Google Scholar]
- 19.Okamoto T, Darbouy M, Brouillet A, Lahuna O, Chobert MN, Laperche Y: Expression of the rat gamma-glutamyl transpeptidase gene from a specific promoter in the small intestine and in hepatoma cells. Biochemistry 1994, 33:11536-11543 [DOI] [PubMed] [Google Scholar]
- 20.Hanigan MH, Ricketts WA: Extracellular glutathione is a source of cysteine for cells that express gamma-glutamyl transpeptidase. Biochemistry 1993, 32:6302-6306 [DOI] [PubMed] [Google Scholar]
- 21.Lieberman MW, Wiseman AL, Shi ZZ, Carter BZ, Barrios R, Ou CN, Chevez-Barrios P, Wang Y, Habib GM, Goodman JC, Huang SL, Lebovitz RM, Matzuk MM: Growth retardation and cysteine deficiency in gamma-glutamyl transpeptidase-deficient mice. Proc Natl Acad Sci USA 1996, 93:7923-7926 [DOI] [PMC free article] [PubMed] [Google Scholar]
- 22.Brouillet A, Holic N, Chobert MN, Laperche Y: The gamma-glutamyl transpeptidase gene is transcribed from a different promoter in rat hepatocytes and biliary cells. Am J Pathol 1998, 152:1039-1048 [PMC free article] [PubMed] [Google Scholar]
- 23.Dabeva MD, Shafritz DA: Activation, proliferation, and differentiation of progenitor cells into hepatocytes in the d-galactosamine model of liver regeneration. Am J Pathol 1993, 143:1606-1620 [PMC free article] [PubMed] [Google Scholar]
- 24.Germain L, Noel M, Gourdeau H, Marceau N: Promotion of growth and differentiation of rat ductular oval cells in primary culture. Cancer Res 1988, 48:368-378 [PubMed] [Google Scholar]
- 25.Guguen-Guillouzo C, Clement B, Baffet G, Beaumont C, Morel-Chany E, Glaise D, Guillouzo A: Maintenance and reversibility of active albumin secretion by adult rat hepatocytes co-cultured with another liver epithelial cell type. Exp Cell Res 1983, 143:47-54 [DOI] [PubMed] [Google Scholar]
- 26.Chomczynski P, Sacchi N: Single-step method of RNA isolation by acid guanidinium thiocyanate-phenol-chloroform extraction. Anal Biochem 1987, 162:156-159 [DOI] [PubMed] [Google Scholar]
- 27.Grassi G, Zentilin L, Tafuro S, Diviacco S, Ventura A, Falaschi A, Giacca M: A rapid procedure for the quantitation of low abundance RNAs by competitive reverse transcription-polymerase chain reaction. Nucleic Acids Res 1994, 22:4547-4549 [DOI] [PMC free article] [PubMed] [Google Scholar]
- 28.Becker-Andre M, Hahlbrock K: Absolute mRNA quantification using the polymerase chain reaction (PCR). A novel approach by a PCR aided transcript titration assay (PATTY). Nucleic Acids Res 1989, 17:9437-9446 [DOI] [PMC free article] [PubMed] [Google Scholar]
- 29.Blouin MJ, Lamy I, Loranger A, Noel M, Corlu A, Guguen-Guillouzo C, Marceau N: Specialization switch in differentiating embryonic rat liver progenitor cells in response to sodium butyrate. Exp Cell Res 1995, 217:22-30 [DOI] [PubMed] [Google Scholar]
- 30.Tee LB, Kirilak Y, Huang WH, Smith PG, Morgan RH, Yeoh GC: Dual phenotypic expression of hepatocytes and bile ductular markers in developing and preneoplastic rat liver. Carcinogenesis 1996, 17:251-259 [DOI] [PubMed] [Google Scholar]
- 31.Chaya D, Fougere-Deschatrette C, Weiss MC: Liver-enriched transcription factors uncoupled from expression of hepatic functions in hepatoma cell lines. Mol Cell Biol 1997, 17:6311-6320 [DOI] [PMC free article] [PubMed] [Google Scholar]
- 32.Sawaya PL, Stripp BR, Whitsett JA, Luse DS: The lung-specific CC10 gene is regulated by transcription factors from the AP-1, octamer, and hepatocyte nuclear factor 3 families. Mol Cell Biol 1993, 13:3860-3871 [DOI] [PMC free article] [PubMed] [Google Scholar]