

Abstract
Cellular recovery in acute renal failure is a form of wound healing. Fibroblast-like cells or myofibroblasts are involved in wound healing. We examined the serial changes in tubular damage and origin and kinetics of regenerating cells in uranyl acetate-induced acute renal failure, with a special emphasis on interstitial myofibroblasts. Acute renal failure was induced in rats by intravenous injection of uranyl acetate (5 mg/kg). All rats received bromodeoxyuridine intraperitoneally 1 hour before sacrifice. Serial changes in the distribution of tubular necrosis and bromodeoxyuridine-incorporated or vimentin-positive regenerating cells, and their spatial and temporal relation to α-smooth muscle actin-positive myofibroblasts as well as ED 1-positive monocytes/macrophages were examined. Necrotic tubules initially appeared around the corticomedullary junction after uranyl acetate injection, then spread both downstream and upstream of proximal tubules. Peritubular α-smooth muscle actin-positive myofibroblasts appeared and extended along the denuded tubular basement membrane, establishing network formation throughout the cortex and the outer stripe of outer medulla at days 4 to 5. Tubular regeneration originated in nonlethally injured cells in the distal end of S3 segments, which was confirmed by lectin and immunohistochemical staining using markers for tubular segment. Subsequently, upstream proliferation was noted along the tubular basement membrane firmly attached by myofibroblasts. During cellular recovery, no entry of myofibroblasts into the tubular lumen across the tubular basement membrane was noted and only a few myofibroblasts showed bromodeoxyuridine positivity. The fractional area of α-smooth muscle actin-positive interstitium reached a peak level at day 7 in the cortex and outer stripe of outer medulla, then gradually disappeared by day 15 and remained only around dilated tubules and in the expanded interstitium at day 21. ED 1-positive monocytes/macrophages were transiently infiltrated mainly into the region of injury. They did not show specific association with initially necrotic tubules, but some of them located in close proximity to regenerating tubules. Nonlethally injured cells at the distal end of proximal tubules are likely to be the main source of tubular regeneration, and the transient appearance of interstitial myofibroblasts attached to the tubular basement membrane immediately after tubular necrosis might play a role in promoting cellular recovery in possible association with monocytes/macrophages in uranyl acetate-induced acute renal failure.
Renal interstitial myofibroblasts have often been regarded rather harmful in clinical and experimental settings as they are considered as indicators of interstitial fibrosis. 1-3 However, fibroblastic cells contribute to wound healing through the formation of granulation tissue and are responsible for wound contraction. Fibroblastic cells present in granulation tissue are mesenchymal cells known to exhibit features of smooth-muscle cell differentiation and hence have occasionally been named myofibroblasts.
Cellular recovery after acute renal failure (ARF) is a unique form of wound healing or tissue remodeling, and complete regenerative repair can occur. It is possible that interstitial myofibroblasts also participate in the regenerative repair in ARF based on their potential role in wound healing. In this regard, embryonic differentiation of the kidney requires interaction between the mesenchyme and epithelium. 4 During nephrogenesis, a part of the renal mesenchyme that responds to a signal from the ureteral epithelium is converted into a new epithelium, kidney tubules. 4 The source of regenerating cells in ARF is thought to be tubular epithelial cells at both ends of the necrotic (damaged) segment of the nephron, as well as other isolated surviving cells along the denuded surface of the tubular basement membrane (TBM). 5 However, the exact origin of regenerating cells and the sequence of cellular recovery after acute tubular damage are not well known. Therefore, it is important to understand the role of renal interstitial myofibroblasts in the cellular recovery in ARF and the pathway involved in such process.
To investigate the above issues, we used in the present study a rat model of ARF induced by injection of uranyl acetate (UA). Specifically, we investigated the serial changes in the distribution of tubular necrosis and regenerating cells, ie, bromodeoxyuridine (BrdU)-incorporating cells or vimentin-expressing cells, and their temporal and spatial relationship to interstitial cells expressing α-smooth muscle actin (α-SMA; myofibroblasts) as well as interstitial monocytes/macrophages. In addition, we determined the origin of the initial regenerating cells using lectins and immunohistochemical markers for nephron segments. Our results indicate that tubular regeneration commences in nonlethally injured cells in the distal end of S3 segment of the proximal tubule (PT) and that transient appearance of interstitial myofibroblasts might play a role in cellular recovery in UA-induced ARF.
Materials and Methods
Preparation of UA-Induced ARF
A total of 50 male Sprague-Dawley rats weighing 230 to 300 g (SLC Co., Shizuoka, Japan) were used in the present study. Rats had free access to standard rat chow and drinking water. They received a single intravenous injection of 5 mg/kg of UA via the dorsal penile vein, and five rats were sacrificed before and at 2, 2.5, 3, 4, 5, 7, 9, 15, and 21 days after UA injection. To label cells that actively synthesize DNA, all rats were injected intraperitoneally with 40 mg/kg BrdU (Sigma Chemical Co., St. Louis, MO) 1 hour before sacrifice. 6 Rats were anesthetized with intraperitoneal pentobarbital sodium (30 mg/kg), and a blood sample was collected through the abdominal aorta, then both kidneys were removed after flushing with phosphate-buffered saline (PBS). Serum creatinine level was measured by the enzymatic method (Mizuho Med., Saga, Japan).
Immunohistochemistry and Lectin Histochemistry
The kidneys were bisected through longitudinal axis and were fixed with either 4% paraformaldehyde or methacarn solution and embedded in paraffin. For histological examination of renal tissues, 4-μm sections were stained with periodic acid-Schiff (PAS). A direct or indirect peroxidase or alkaline phosphatase method was used to detect a variety of antigens and lectins. This included the analysis of BrdU, α-SMA, vimentin, phaseolus vulgaris erythroagglutinin (PHA-E), 7 aquaporin-1 (AQP-1), 8 Tamm-Horsfall protein (THP), 9 and ED 1 monocytes/macrophages.
To detect BrdU, 4% paraformaldehyde-fixed sections were deparaffinized and endogenous peroxidase was blocked by treatment with 3% H2O2 for 30 minutes, then the sections were incubated with normal rabbit serum for 20 minutes, followed by incubation with mouse monoclonal antibody against BrdU (Amersham International, Poole, UK) overnight at 37°C. After washing in PBS, sections were incubated with peroxidase-conjugated rabbit anti-mouse IgG (1:50; Chemicon International Inc., Temecula, CA) for 60 minutes at room temperature. The reaction products were visualized by incubation with diaminobenzidine.
To detect PHA-E lectin binding sites, methacarn-fixed sections were deparaffinized and rehydrated then incubated with biotinylated PHA-E lectins (1:800; Sigma) for 60 minutes. After washing in PBS, sections were incubated with Vectastain ABC-AP reagent, an avidin-biotin-alkaline phosphatase complex (Vector Laboratories, Burlingame, CA) for 30 minutes. Finally, the Vector Red Alkaline Phosphatase Substrate Kit I (Vector Laboratories) was used as chromogen in which 1 mmol/L levamisole (Sigma) was added to block endogenous alkaline phosphatase. All incubations were performed at room temperature.
To detect other antigens, a standardized ABC technique was performed by using the antibodies listed in Table 1 ▶ . Briefly, sections were incubated with the primary antibody and reacted with the biotinylated secondary antibody for 30 minutes at room temperature. Then, streptavidin-conjugated peroxidase (Nichirei, Tokyo, Japan) or Vectastain ABC-AP reagent was added for 30 minutes. Visualization was performed after BrdU or lectin staining.
Table 1.
Antibodies Used to Detect Specific Antigens in Paraffin-Embedded Kidney Sections
| Primary antibodies (suppliers) | Biotinylated secondary antibodies (suppliers) | Labeled enzyme |
|---|---|---|
| Rabbit polyclonal antibody against aquaporin-1 (Chemicon) | Donkey polyclonal antibody against rabbit IgG (Chemicon) | Alkaline phosphatase |
| Sheep polyclonal antibody against Tamm-Horsfall glycoprotein (Chemicon) | Rabbit polyclonal antibody against sheep IgG (Vector Laboratories) | Alkaline phosphatase |
| Mouse monoclonal antibody against human α-smooth muscle actin (DAKO) | Donkey polyclonal antibody against mouse IgG (Chemicon) | Peroxidase |
| Mouse monoclonal antibody against vimentin (clone V9) (Sigma) | Donkey polyclonal antibody against mouse IgG (Chemicon) | Peroxidase |
| Mouse monoclonal antibody against rat monocytes/macrophages (ED1) (Serotec, Oxford, UK) | Donkey polyclonal antibody against mouse IgG (Chemicon) | Peroxidase |
To determine the exact location of the initial regenerating cells, double-immunostaining for BrdU and AQP-1, or BrdU and THP was performed. For this purpose, tissue sections were first stained for BrdU using the diaminobenzidine detection system followed by detection of AQP-1 or THP using the Vectastain ABC-AP kit with Vector Red. As for BrdU and AQP-1 staining, biotin-conjugated donkey anti-mouse IgG (1:50; Chemicon) was used as a secondary antibody for BrdU, whereas alkaline phosphatase-conjugated donkey anti-rabbit IgG (1:60; Chemicon) was used for AQP-1. To determine whether interstitial myofibroblasts show DNA synthesis, double-immunostaining for α-SMA and BrdU was performed on the sections at day 5. Sections were first stained for α-SMA using the Vectastain ABC-AP kit with Vector Red, then stained for BrdU using the diaminobenzidine detection system. Consecutive sections were also used for comparison of different staining patterns. Counterstaining, if necessary, was performed by using hematoxylin or methyl green.
For control sections, the first antibodies were omitted or replaced by the normal serum of corresponding animal and signals in both control and experimental sections were negative or negligible.
Immunoelectron Microscopy for Detection of α-SMA
Cortical tissues fixed with 4% paraformaldehyde were dehydrated in a graded ethanol series and embedded in Unicryl (British BioCell, Cardiff, UK) at −30°C according to the instructions provided by the manufacturer. Ultrathin sections were incubated with mouse anti-human α-SMA (DAKO, Carpinteria, CA) diluted 1:100 in PBS, and subsequently, with rabbit anti-mouse IgG (Chemicon) diluted 1:500 in PBS, and goat anti-rabbit IgG conjugated with 10 nm gold (Ultra Biosols, Liverpool, UK) diluted 1:10 in 0.02 mol/L Tris-HCl buffer (pH 7.0). Sections were stained with UA then examined by a JEM-1220 electron microscope (JEOL, Tokyo, Japan).
Morphometric Analysis of Location of Tubular Necrosis and of BrdU-Positive Tubular Cells
To examine the serial changes in the distribution of PT necrosis, areas of PAS-stained longitudinal sections of the kidney obtained at days 2, 2.5, 3, 4, 5, and 7 were projected onto a TV monitor. The viewed area of each section was ∼6.4 mm 2 in each rat. The cross-section of PT with severe damage (representing desquamation of tubular epithelial cells associated with focal granulovacuolar epithelial cell degeneration amounting to 75 to 100% of the section) was counted as necrotic tubules. The location of targeted PT in the cortex (CO) or the outer stripe of outer medulla (OSOM) was expressed as A/B (0 to 1.0) using a computer-assisted image analyzer, where A represented the distance between the center of PT and the border of CO-OSOM or OSOM, the inner stripe of outer medulla (ISOM), respectively, and B the thickness of each kidney layer at the same site. The number of severe necrotic PT in each 20 arbitrarily divided zones in each kidney layer was displayed in histograms.
The method for locating BrdU-positive cells in tubules at days 2, 2.5, 3, 4, 5, 7, 9, 15, and 21 was similar to that used for PT necrosis described above. Areas of BrdU-stained longitudinal sections were displayed onto the monitor. The viewed area of each section was ∼10.0 mm 2 in each rat. BrdU-positive cells in CO, OSOM, or ISOM were expressed as A/B, where A represents the distance between a BrdU-positive cell and the border of CO-OSOM, OSOM-ISOM, or ISOM-the inner medulla, respectively, and B the thickness of each kidney layer at the same site. The number of BrdU-positive cells in each 20 arbitrarily divided zones in each kidney layer was displayed in histograms.
Morphometric Analysis of the Number of BrdU-Positive Cells and of ED 1-Positive Interstitial Monocytes/Macrophages
For semiquantitative analysis, the number of BrdU-positive cells in both tubules and the interstitium or the number of ED 1-positive cells in the interstitium in CO, OSOM, or ISOM at days 2, 2.5 (only for BrdU), 3, 4, 5, 7, 9, 15, and 21 were counted in 50 randomly selected fields of each layer in each kidney at ×400 magnification. The mean number at each time point was displayed in histograms.
Morphometric Analysis of α-SMA/BrdU Double-Positive Interstitial Cells
The number of α-SMA/BrdU double-positive cells in BrdU-positive cells or in α-SMA-positive cells in the interstitium was counted in 50 randomly selected fields of OSOM at day 5 at ×400 magnification, and the mean percentage of α-SMA/BrdU double-positive cells was calculated.
Morphometric Analysis of α-SMA-Positive Cells
For semiquantification of α-SMA-positive area in CO, OSOM, and ISOM at days 2, 3, 4, 5, 7, 9, 15, and 21, point counting was performed using a routine established method. 10 A total of 20 fields at ×400 magnification per section were counted in each animal on a 1-cm 2 eyepiece graticule with 10 equidistant grid lines. Each field was 0.0625 mm2, and the total area counted per slide was 1.25 mm2. The percentage of fractional area (percentage of positive area per total area counted of the section) was calculated using the following formula: Percentage of fractional area equals number of grid intersections with positive staining/total number of grid intersections multiplied by 100.
Statistical Analysis
Data are expressed as the mean ± SEM. Differences between data sets were examined for statistical significance using one-way analysis of variance followed by Fisher’s t-test. A P level <0.05 was accepted as statistically significant.
Results
Serum Creatinine (Scr)
Scr increased significantly as early as day 3 after UA injection (P < 0.05 versus level before induction of ARF), and reached a peak value at day 7 (P < 0.001 versus level before induction of ARF), then returned to normal level by day 15 (Figure 1) ▶ .
Figure 1.

Serial changes in serum creatinine (Scr) after induction of UA-induced ARF. Data represent the mean ± SEM values of five animals. *, P < 0.05 versus before induction of ARF; #, P < 0.001 versus before induction of ARF.
Damage of PTs Observed by PAS Staining
Although slight morphological changes could be seen throughout the PT in PAS-stained tissues, the initial lesions of severe necrosis were predominantly located around the corticomedullary junction where the denuded TBM was evident as early as day 2 (Figure 2, B and G) ▶ . PT damage with severe necrosis spread progressively to both downstream and upstream of PT (Figures 2 and 3) ▶ ▶ . Between days 4 and 5, tubular necrosis was almost maximally distributed in OSOM and CO (Figure 3) ▶ with cellular debris in the tubular lumen (Figure 2D) ▶ . By day 7, the majority of necrotic tubules disappeared and denuded TBM were almost covered with regenerating cells with flattened cytoplasm (Figure 2, E and H) ▶ , but there were still few clusters of severely damaged tubules (Figure 2E) ▶ . After day 7, stratification of hyperplastic PT with focal papillary projections could be seen in OSOM (Figure 2, E ▶ and I). By day 21, desquamation of epithelial cells in papillary clusters was noted in the tubular lumen, and hyperproliferation was almost remodeled with occasional tubular dilation (Figure 2F) ▶ .
Figure 2.
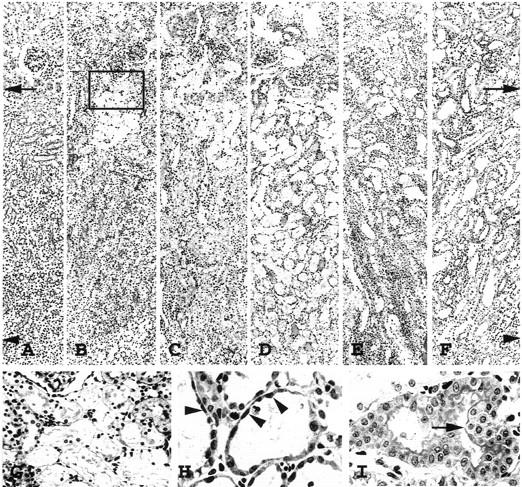
Photomicrographs of periodic acid-Schiff-stained sections, showing PT injury in OSOM before induction of ARF (A); day 2 (B); day 3 (C); day 5 (D); day 7 (E and H); and day 9 (F and I). G: Enlarged photomicrograph of the inset in B; arrows, border between CO and OSOM; arrowheads, border between OSOM and ISOM. PT necrosis initially occurred around the corticomedullary junction where denuded TBM was evident at day 2 (B and G), then spread upstream and downstream of the nephron, reaching a peak level around day 5 (D). At day 7 (E) the TBM was almost covered with flattened, regenerated tubular cells (H, arrowheads). Hyperplastic tubules (I, arrow) were evident at day 9. Original magnifications, ×100 (A–F); ×300 (G); ×650 (H and I).
Figure 3.

Morphometric analysis of serial changes in the distribution of PT necrosis in CO and OSOM. S, surface of the kidney; B1, border between CO and OSOM; B2, border between OSOM and ISOM. Data represent the mean values of three or four animals.
Recovery of Tubular Cell Damage
Location and Kinetics of BrdU-Positive Cells in Tubules
The majority of BrdU-positive regenerating cells initially appeared at the border zone between OSOM and ISOM as early as day 2 (Figures 4B and 5) ▶ ▶ . However, there was a sudden sharp rise in the number of these cells at day 2.5 (Figure 5) ▶ . To identify the origin of BrdU-positive cells, double-staining of BrdU and AQP-1 or BrdU and THP was performed in consecutive sections at day 2. Although AQP-1 is positive in the apical brush border and in basolateral membrane of PT, as well as in both apical and basolateral membrane of TDL in the normal kidney, 8 heavy immunostaining is considered to be a marker for TDL. The majority of BrdU-positive cells around the border between OSOM and ISOM was almost confined to tubular epithelial cells, but not to interstitial cells. These BrdU-positive cells were not located in heavy AQP-1-positive staining tubules (Figure 6A) ▶ or in THP-positive staining tubules (marker for TAL) (Figure 6B) ▶ . In addition, most BrdU-positive cells showed minor morphological change (Figure 6C) ▶ in the PTs with weak AQP-1 positivity (Figure 6A) ▶ . However, a small number of BrdU-positive cells was found in both AQP-1- and THP-negative staining cells (Figure 6B) ▶ , indicating collecting duct cells which was also judged by morphology. It is unlikely that BrdU-positive collecting duct cells are the source of initial regenerating cells, which will proliferate to cover the PT damage, because collecting ducts are not connected with PT segments directly. These findings suggested that the majority of the initial regenerating cells originated from nonlethally injured cells at the distal end of S3 segments of PT. A small number of TAL also showed BrdU-positivity, especially in the late phase of this model (data not shown). Morphometric analysis revealed that the frequency distribution of BrdU-positive tubular cells was shifted from the inner to the outer zone of OSOM by day 5 (Figures 4 and 5) ▶ ▶ . These findings suggest the upstream proliferation of regenerating cells from the end of the S3 segment of PT. The BrdU activity in OSOM subsided at day 7 (Figures 4F and 5) ▶ ▶ when the regenerating cells almost covered the denuded TBM as noted in PAS-stained sections (Figure 2H) ▶ . Parallel to the hyperproliferation in OSOM (Figure 2I) ▶ , the second peak of BrdU-positive cells appeared at day 9 (Figure 4G and 5) ▶ ▶ , but decreased by day 21 (Figure 5) ▶ . Determination of the mean number of BrdU-positive cells per field also showed a biphasic BrdU-activity in tubular cells in OSOM (Figure 7) ▶ .
Figure 4.

Serial changes in the distribution of BrdU-positive cells (black nuclei) in OSOM before induction of ARF (A), day 2 (B), day 3 (C), day 4 (D), day 5 (E), day 7 (F), and day 9 (G). Arrows, border between CO and OSOM; arrowheads, border between OSOM and ISOM. Original magnifications, ×100 (A–G).
Figure 5.

Serial changes in the frequency distribution of tubular BrdU-positive cells in CO, OSOM, and ISOM. S, surface of the kidney; B1, border between CO and OSOM; B2, border between OSOM and ISOM; B3, border between ISOM and inner medulla. Data represent the mean values of three or four animals.
Figure 6.

Double-staining of AQP-1 (pink color) and BrdU (brown color) (A), and THP (pink color) and BrdU (brown color) (B), or staining of vimentin (brown color) (C) around the border between OSOM and ISOM in consecutive sections at day 2. Arrow, weak AQP-1 expression in PT; arrowheads, border between OSOM and ISOM; 1 and 2, identical PTs; 3, identical collecting duct. Original magnifications, ×350 (A–C).
Figure 7.

Morphometric analysis of the number of BrdU-positive tubular or interstitial cells in CO, OSOM, and ISOM. Each bar represents the mean ± SEM of four or five animals. *, P < 0.05 versus before induction of ARF; #, P < 0.001 versus before induction of ARF; +, P < 0.05; ++, P < 0.001; N, no significant difference.
In CO, BrdU-positivity significantly appeared at and after day 3, reaching a peak level between days 5 and 15, but did not show a regular pattern of frequency distribution (Figures 5 and 7) ▶ ▶ . A small number of distal tubules also showed BrdU-positivity in CO (data not shown). In ISOM, a significant number of BrdU-positive cells was noted as early as day 3, but the total number of such cells was less than that in OSOM (Figures 5 and 7) ▶ ▶ . The majority of these cells were TAL and collecting duct cells, which were also judged by morphology. The frequency distribution of BrdU-positive cells seemed to be shifted from the outer to the inner zones of ISOM (Figure 5) ▶ and BrdU activity in ISOM showed a biphasic appearance, similar to that in OSOM (Figures 5 and 7) ▶ ▶ .
Vimentin Expression in Tubules
We used vimentin expression as a marker for tubular regeneration and/or dedifferentiation as reported previously. 11 In normal kidney, vimentin was expressed in glomerular epithelial cells, mesangial cells, and vascular endothelial cells and to a lesser extent in interstitial cells, but tubular epithelial cells did not express vimentin (Figure 8A) ▶ . 11,12 Vimentin-positive tubular cells in OSOM appeared as early as day 2 exclusively in the inner zone of the OSOM (Figure 8B) ▶ . High-power magnification showed these to be spindle-like large cells containing oval-shaped nuclei (Figure 8H) ▶ , extending mainly upstream of the nephron segments in OSOM (Figure 8) ▶ , similar to PT regeneration observed by BrdU (Figures 4 and 5) ▶ ▶ . Vimentin was also positive in initial BrdU-positive regenerating PT (Figure 6C) ▶ . These findings confirmed upstream proliferation of the S3 segment of PT during the recovery phase at day 7 when most TBM were covered with flattened PT cells showing intense vimentin staining (Figure 8F) ▶ . Intense vimentin staining could be found in PT until day 9 (Figure 8G) ▶ , then gradually disappeared. Hyperproliferative PT also expressed vimentin (Figure 8, F, G, and J) ▶ after day 7. When PHA-E, a constituent molecule of brush border, 7 was used as a marker of differentiated apical membrane of PT, totally negative staining for PHA-E was found in regenerating PT until day 5, but slight staining for PHA-E reappeared in PT at day 7 (Figure 9) ▶ . These findings indicated that early-redifferentiated PT cells after proliferation do not fully recover at least until day 9.
Figure 8.

Serial changes in the distribution of cells expressing vimentin (black color) before induction of ARF (A), day 2 (B, H, and I), day 3 (C), day 4 (D), day 5 (E), day 7 (F), day 9 (G and J). Arrows, border between CO and OSOM; arrowheads, border between OSOM and ISOM. Vimentin-positive spindle-like cells with large oval nuclei (arrowheads) could be seen at day 2 around the border between OSOM and ISOM (H); interstitial vimentin expression (arrows) was increasingly seen at day 2 (I); and vimentin expression (arrow) was also found in hyperproliferative PT (J). Original magnifications, ×100 (A–G); ×700 (H–J).
Figure 9.

Location of PHA-E binding sites in normal rats (A) and in experimental rats at days 5 (B) and 7 (C). Staining of brush-border was quite strong (arrows) in PTs of normal rats (A), but totally negative in regenerating PTs at day 5 (B). A faint staining could be seen on the reappeared brush-border (arrowheads) at day 7 (C). Original magnifications, ×750 (A–C).
Interstitial Cellular Response
BrdU-Positive Cells in Interstitium
The number of BrdU-positive cells in the interstitium in CO, OSOM, and ISOM also increased significantly as early as days 5, 4, and 4, respectively, and showed biphasic peak at days 5 and 9 (Figure 7) ▶ . The peak points of BrdU activity in the interstitium were similar to that in the tubules (Figure 7) ▶ , but the number of BrdU-positive cells in the interstitium was less than in tubules, the second peak was higher than the first one, and significant appearance of these cells in the interstitium of CO, OSOM, and ISOM did not precede that in tubules (Figure 7) ▶ . Moreover, the distribution of BrdU-positive cells in the interstitium in OSOM did not show a regular pattern and temporal association with regenerating tubules.
Appearance of Interstitial Myofibroblasts
In normal rats, α-SMA protein was detected in vascular smooth muscle cells but not in glomeruli, tubules, or interstitial cells (Figure 10A) ▶ . α-SMA-positive interstitial cells, indicating myofibroblasts, were visible in OSOM as early as day 2 (Figure 10B) ▶ . Initially they appeared exclusively around damaged tubules with denuded TBM which were located mainly in the outer zone of the OSOM (Figure 10B) ▶ and extended along with the progression of severe tubular damage (Figures 2 and 10) ▶ ▶ . Between days 4 and 5, myofibroblasts formed a network around necrotic tubules throughout the cortex and medulla as if they structurally supported the frame of the denuded TBM (Figures 10D and 11A) ▶ ▶ . The exact location of myofibroblasts when they entered the tubular lumen was not clear under light microscopic examination (Figure 11A) ▶ . Immunoelectron microscopy revealed that the cell processes labeled with gold particles, indicating α-SMA, were firmly attached to the outer surface of the denuded TBM and formed a network appearance by day 5 (Figure 12) ▶ . Entry of myofibroblasts into tubular lumen across TBM was not evident at the ultrastructural level (Figure 12) ▶ . We performed α-SMA/BrdU double-immunostaining in OSOM at day 5 (Figure 13) ▶ when interstitial myofibroblasts are developing network formation. Among BrdU-positive interstitial cells, only 2.5 ± 0.5% showed α-SMA-positivity, and among α-SMA-positive cells, only 1.5 ± 0.3% expressed BrdU positivity, suggesting that most BrdU-positive interstitial cells were not myofibroblasts and that myofibroblasts seemed not to undergo cell proliferation actively. Most peritubular α-SMA expression was transient in OSOM and CO and began to decrease from day 9 (Figure 10F) ▶ , became faint by day 15 (Figure 10H) ▶ , and almost negative by day 21 (Figure 10I) ▶ . However, α-SMA staining in focally expanded interstitium, around hyperplastic tubules (Figure 10G) ▶ and dilated tubules (Figure 10I) ▶ , was seen at day 7 and thereafter. By day 21, α-SMA-positive cells were present only around dilated tubules (Figure 10I) ▶ and in small areas of focally expanded interstitium (Figure 10I) ▶ . Periglomerular α-SMA staining was noted at day 7 and became most prominent at day 15 (Figure 10H) ▶ but diminished rapidly by day 21. α-SMA-positive staining in the expanded interstitial area and periglomerular area was confirmed by increased fractional areas of α-SMA in the later phase of this model (Figure 14) ▶ .
Figure 10.

Serial changes in the distribution of cells expressing α-SMA (black color) before induction of ARF (A), day 2 (B), day 3 (C), day 5 (D), day 7 (E and G), day 9 (F), day 15 (H), and day 21 (I). G: Expanded interstitium around hyperplastic tubules showed α-SMA-positive staining (arrowheads). H: At day 15, peritubular α-SMA staining became faint (arrows), however, prominent positive stainings were noted in the periglomerular region (arrowheads). I: At day 21 α-SMA-positive cells were seen only around the very dilated tubules (arrows) and in small areas of focally expanded interstitium (arrowhead). Original magnifications, ×100 (A–F); ×300 (G–I).
Figure 11.

Expression of α-SMA (A), vimentin (B), and ED 1-positive monocytes/macrophages (C) in OSOM in consecutive sections at day 5. α-SMA staining was seen only in peritubular interstitial cells (myofibroblasts, thick arrows) (A). In contrast, vimentin staining was found in both regenerating tubules (arrowheads) and peritubular interstitial cells (thick arrows) (B). ED 1-positive monocytes/macrophages (thin arrows) could be seen in peritubular regions, some located in close proximity to regenerating tubules (C). 1 and 2, identical PTs. Original magnifications, ×500 (A–C).
Figure 12.

Immunoelectron micrographs for α -SMA. A: Interstitial cell processes labeled by gold particles (arrowheads), indicating α-SMA attached firmly to the denuded TBM (arrows) at day 5. B: Enlarged micrograph of A. M, Myofibroblast; P, necrotic PT cell. Scale bars: A, 2.0 μm; B, 0.5 μm.
Figure 13.

Double-immunostaining of α-SMA (pink color) and BrdU (brown color) in OSOM at day 5. A proliferating (α-SMA-negative/BrdU-positive) interstitial cell is indicated by the arrow in A and at higher magnification in B, whereas nonproliferative (α-SMA-positive/BrdU-negative) myofibroblast is indicated by the arrowhead in A and higher magnification in C. Original magnifications, ×350 (A); ×1,500 (B and C).
Figure 14.

Morphometric analysis of α-SMA fractional area in CO, OSOM, and ISOM. α-SMA fractional area significantly increased from day 4 in all three layers, and reached peak values at days 7, 7, or 9, respectively. Each bar represents the mean ± SEM of four or five animals. *, P < 0.05 versus before induction of ARF; #, P < 0.001 versus before induction of ARF; +, P < 0.05; ++, P < 0.001; N, no significant difference.
In ISOM the interstitial expression of α-SMA extended from the OSOM, and significantly increased in the outer zone of ISOM at day 5, then extended to the whole ISOM, reaching a peak level at day 9 (Figure 14) ▶ .
In normal rats, only a faint vimentin staining could be seen in some renal interstitial cells in OSOM. After induction of ARF, the number of faint vimentin-positive peritubular interstitial cells increased throughout OSOM as early as day 2 (Figure 8I) ▶ . This was followed by further increases in intensity of staining (Figure 11B) ▶ . After day 4, the serial changes in vimentin-staining in the interstitium were similar to those of α-SMA staining (Figure 11, A and B) ▶ . These findings suggest that interstitial cells may firstly express vimentin then acquire α-SMA.
Interstitial ED 1-Positive Monocytes/Macrophages
ED 1-positive monocytes/macrophages were found only occasionally in control kidneys. With the development of PT damage after induction of ARF, interstitial ED 1-positive cells increased in the region of injury, then gradually disappeared after tubules have regenerated (data not shown). Specific accumulation of ED 1-positive cells closely around the initially necrotic PT with the denuded TBM was not evident, and the distribution of ED 1-positive cells did not show a regular pattern in CO, OSOM, and ISOM. However, some ED 1-positive cells located in close proximity to myofibroblasts surrounding regenerating tubules (Figure 11C) ▶ after day 3. Morphometric analysis revealed that interstitial ED 1-positive cells in CO, OSOM, and ISOM significantly increased as early as day 3, peaking at days 5, 4 to 7, and 5, respectively (Figure 15) ▶ .
Figure 15.

Morphometric analysis of the number of ED 1-positive interstitial monocytes/macrophages in CO, OSOM, and ISOM. Each bar represents the mean ± SEM of four or five animals. *, P < 0.05 versus before induction of ARF; #, P < 0.001 versus before induction of ARF; +, P < 0.05; ++, P < 0.001; N, no significant difference.
Discussion
In this study, we determined the serial distribution of interstitial myofibroblasts in the kidney in the UA-induced ARF model, with respect to the development of and recovery from acute tubular injury. The major findings of our study were the following: 1) tubular necrosis initially appeared around the corticomedullary junction (the initial part of the straight PT), then spread to both downstream and upstream of the PT; 2) peritubular myofibroblasts appeared and developed along the proximal nephron with tubular necrosis; 3) cellular recovery began at the distal end of S3 segments (the terminal parts of the straight PT); and 4) the regenerating cells may undergo proliferation toward the upstream of the proximal nephron along the TBM firmly attached by peritubular myofibroblasts.
It is well known that PTs are frankly damaged in ARF induced by nephrotoxins such as gentamicin, 13 mercury, 14 cisplatinum, 15 and organic compounds like petroleum hydrocarbons. 16 In general, the S3 segment of PT is more severely damaged than the S1 and S2 segments in the majority of nephrotoxin-induced ARF with the exception of gentamicin and petroleum hydrocarbons. 13,16 In our model of UA-induced ARF, PT necrosis initially occurred in the initial part of the S3 segment in the outer OSOM and slight morphological changes were already present throughout the whole S3 segment as early as day 2. Necrotic tubules progressively spread from the corticomedullary junction toward both downstream and upstream of PT, and were maximally distributed almost throughout the whole S3 segment by days 4 to 5. To our knowledge, detailed description of the progression of PT necrosis has not been previously described in nephrotoxin- and ischemia-induced ARF.
In the present study, we provided additional evidence regarding the origin of regenerating cells and the mode of cellular recovery. The initial regenerating tubular cells (BrdU- or vimentin-positive cells) were found at the distal end of the S3 segment as early as day 2. This was confirmed by using markers for nephron segments. The first group of regenerating cells showed partial cellular damage. Subsequently, regenerating cells proliferated toward upstream of proximal nephron in OSOM and almost covered the denuded TBM by day 7. Based on mesenchymal-epithelial cell transdifferentiation during nephrogenesis, 4 it is possible that interstitial multipotent stem cells could trans-differentiate into tubular epithelial cells under pathological conditions. In this study, however, during cellular recovery, electron microscopic examination revealed the lack of invasion of myofibroblasts across the TBM into tubular lumen around the distal ends of S3 segments and even throughout the proximal nephron in OSOM. These findings suggest that the nonlethally injured PT cells themselves at the distal end of the S3 segment may be the main source of cellular recovery. In most nephrotoxin- and ischemia-induced ARF, cellular recovery was reported to originate from surviving cells in the necrotic zone or viable cells adjacent to the necrotic zone. 4,13,17 It is conceivable that isolated surviving cells are responsible for cellular recovery after tubular damage when the degree of the latter was low and many isolated surviving cells were still present in these areas. This seems not to be the case in our model. Only Haagsma et al 18 reported that regeneration commenced at both ends of damaged PT in HgCl2-induced ARF. However, they did not elaborate on the mode of progression of cellular recovery. In the present model, BrdU-positive tubular cells in CO appeared later and in a sporadic and irregular pattern than in OSOM, suggesting that the isolated surviving cells mainly participate in cellular recovery in CO. However, it is difficult to assess this issue because the S1 + S2 segments of PT do not run straightly from the junction of the S3 to S2 segment to the glomerulus. 19 It remains unclear at this stage whether the cells at the distal end of PT are characteristically resistant to UA-insult or are proliferatively potent. Furthermore, the exact stimulus that initiates the proliferative response remains to be determined.
A particularly noteworthy finding in the present study was that the myofibroblasts appeared and surrounded the initial necrotic PT, developed along with the progression of PT necrosis, attaching to the TBM, and formed network throughout the CO and OSOM before acceleration of cellular recovery. The origin of α-SMA-expressing interstitial cells was not clear, but their immediate appearance adjacent to TBM strongly suggests that resident stromal cells located adjacent to the TBM, which initially do not express features of smooth muscle cell differentiation (identified by α-SMA), later differentiated to α-SMA expressing cells. The mechanisms responsible for such phenotypic modulations are unknown, but recent studies suggest that transforming growth factor-β, platelet-derived growth factor, and extracellular matrix could transform fibroblasts to myofibroblasts. 20 In the present model, injured tubular cells might secrete cytokines such as platelet-derived growth factor and transforming growth factor-β, 21,22 resulting in the activation and proliferation of myofibroblasts. However, in the present study, analysis of α-SMA/BrdU double-immunostaining revealed that most myofibroblasts did not undergo cell proliferation actively. Interstitial infiltrating cells are other possible candidates for cytokine production. Diamond et al 23 reported that renal cortical transforming growth factor-β1, derived from infiltrating macrophages, in part, contribute to foster the modulation of fibroblasts to myofibroblasts within the renal cortex after ureteral obstruction in rats. In fact, several studies have reported the presence of infiltrating cells in the interstitium after acute renal injury. 24 In our model, ED 1-positive monocytes/macrophages did infiltrate transiently in the interstitium. Specific association of them with initially necrotic tubules surrounded by myofibroblasts, however, was not evident. In addition, alterations in components of TBM similar to the extracellular matrix were reported in ARF. 25,26 Moreover, back-leak of filtrate through the denuded TBM 27 and/or relatively high stretching force acting on the interstitium through the TBM because of loss of tubular cells and/or tubular obstruction by cell debris, might activate interstitial cells to express α-SMA.
Interestingly, Nagle et al 28 observed that interstitial fibroblasts underwent morphological transformation to smooth muscle-like interstitial cells in a rabbit model of complete ureteral obstruction and demonstrated that under these conditions the kidney may demonstrate increased whole-organ contractility. 29 In the present study, immunoelectron microscopic examination revealed that myofibroblasts with possible stress fibers closely covered the external side of TBM as if they provided contractility and resisted the stretching force. Myofibroblasts have been described in clinical disorders related to injury and repair phenomena, associated with prominent tissue retraction and remodeling. 20 During wound healing, fibroblastic cells modulate to a phenotype characterized by ultrastructural (stress fibers) and biochemical (α-SMA) features typical of smooth muscle cells, indicating that this change is instrumental in activities such as wound contraction. 20 This might also be the case for myofibroblasts during cellular recovery in ARF. Interstitial accumulation of myofibroblasts is one of the best predictive indicators of renal fibrosis in progressive renal disease. 1-3 In the present acute tubular injury model, the majority of peritubular myofibroblasts gradually disappeared after regeneration of PT, suggesting that they might revert to a quiescent form or undergo apoptosis. 30,31
Although no direct evidence for a role of interstitial cells in ARF is provided in the present study, we postulate that peritubular myofibroblasts play a mediating role in cellular recovery in our model because the regenerating PT underwent proliferation toward upstream of PT along the denuded TBM firmly attached by myofibroblasts. In addition to the possible function of supporting the TBM, myofibroblasts might furnish extracellular matrix components to condition PT proliferation, because fibroblasts play an essential role in the synthesis and regulation of extracellular matrix components in wound healing. 20 Moreover, myofibroblasts can provide cytokines as paracrine mitogens, which might promote cellular recovery from ARF. At present, fibroblast growth factors-1 and -7 and hepatocyte growth factor may be possible candidates for cytokines secreted by myofibroblasts in renal interstitium. 32-35 Transient interstitial infiltrating cells 24,32,36 as well as tubular cells 21,22,37-39 are also a possible source of cytokines, which can promote regeneration of the damaged tubules. Indeed, in the present study transient infiltration of interstitial monocytes/macrophages could be found in some association with regenerating tubules.
Regenerative repair of BrdU-positive PT was almost completed by day 7. After day 7, hyperproliferation of PT became prominent and was followed by remodeling of hyperplastic tubules with a resolution of hypercellularity probably through apoptosis, as reported previously. 6,40 This proliferation pattern seemed to be reflected by the findings that the biphasic waves of BrdU activities in OSOM reached peak values at days 5 and 9. However, BrdU-positive staining could be also seen in cells stained positive for THP, a marker for the thick ascending limb, especially in the late phase of this model (data not shown). Moreover, although no visible signs of tubular necrosis could be seen in ISOM, a significant number of BrdU-positive cells were also seen as early as day 3. Thus, BrdU-positive cells probably include loop cells and/or collecting duct cells. Although PT is the main site of renal damage in ARF, recent studies indicate that the distal nephron may also react extensively to ischemic 41,42 and nephrotoxic 13,33 insults, suggesting that the distal nephron might function as part of an adaptive response to the loss of PT function. The significance of BrdU-positive cells in the distal nephron remains to be elucidated. On the other hand, the early changes in vimentin staining in tubules corresponded to those of BrdU, but vimentin stained-cells were noted throughout a long period in PT tubules with or without hyperproliferation at least until day 9, and at day 21, vimentin was still positive in dilated tubules. These findings indicate that vimentin would be a marker for tubular dedifferentiation or injury rather than for regeneration itself as reported previously. 11 Although regenerated tubular cells at day 7 showed a weakly positive staining for PHA-E, a constituent molecule of the brush border and a marker of differentiated apical PT membrane, the majority of PT did not show the final differentiation at least until day 9 with respect to vimentin expression.
In summary, we have demonstrated in the present study that nonlethally injured cells at the distal end of S3 segments of PT are likely to be responsible for the cellular recovery in UA-induced ARF. Based on the serial changes in the distribution of tubular damage and peritubular myofibroblasts, as well as their relationship to cellular recovery, we propose that the transient appearance of peritubular myofibroblasts immediately after PT necrosis plays an important role in promoting the regenerative repair.
Footnotes
Address reprint requests to Yoshihide Fujigaki, M.D., The First Department of Medicine, Hamamatsu University School of Medicine, Handa-cho 3600 431-3192 Hamamatsu, Japan. E-mail: yf0516@hama-med.ac.jp.
References
- 1.Alpers CE, Hudkins KL, Floege J, Johnson RJ: Human renal cortical interstitial cells with some features of smooth muscle cells participate in tubulointerstitial and crescentic glomerular injury. J Am Soc Nephrol 1994, 5:201-209 [DOI] [PubMed] [Google Scholar]
- 2.Hewitson TD, Becker GJ: Interstitial myofibroblasts in IgA glomerulonephritis. Am J Nephrol 1995, 15:111-117 [DOI] [PubMed] [Google Scholar]
- 3.Zhang G, Moorhead PJ, el Nahas AM: Myofibroblasts and the progression of experimental glomerulonephritis. Exp Nephrol 1995, 3:308-318 [PubMed] [Google Scholar]
- 4.Hay ED, Zuk A: Transformations between epithelium and mesenchyme: normal, pathological, and experimentally induced. Am J Kidney Dis 1995, 26:678-690 [DOI] [PubMed] [Google Scholar]
- 5.Toback FG: Regeneration after acute tubular necrosis. Kidney Int 1992, 41:226-246 [DOI] [PubMed] [Google Scholar]
- 6.Sano K, Fujigaki Y, Miyaji T, Ikegaya N, Ohishi K, Yonemura K, Hishida A: Role of apoptosis in uranyl acetate-induced acute renal failure and acquired resistance to uranyl acetate. Kidney Int 2000, 57:1560-1570 [DOI] [PubMed] [Google Scholar]
- 7.Ivanyi B, Olsen TS: Immunohistochemical identification of tubular segments in percutaneous renal biopsies. Histochemistry 1991, 95:351-356 [DOI] [PubMed] [Google Scholar]
- 8.Nielsen S, Smith BL, Christensen EI, Knepper MA, Agre P: CHIP28 water channels are localized in constitutively water-permeable segments of the nephron. J Cell Biol 1993, 120:371-383 [DOI] [PMC free article] [PubMed] [Google Scholar]
- 9.Kitamura H, Yamauchi A, Sugiura T, Matsuoka T, Horio M, Tohyama M, Shimada S, Imai E, Hori M: Inhibition of myo-inositol transport causes acute renal failure with selective medullary injury in the rats. Kidney Int 1998, 53:146-153 [DOI] [PubMed] [Google Scholar]
- 10.Hewitson TD, Wu HL, Becker GJ: Interstitial myofibroblasts in experimental renal infection and scarring. Am J Nephrol 1995, 15:411-417 [DOI] [PubMed] [Google Scholar]
- 11.Gröne HJ, Weber K, Gröne E, Helmchen U, Osborn M: Coexpression of keratin and vimentin in damaged and regenerating tubular epithelia of the kidney. Am J Pathol 1987, 129:1-8 [PMC free article] [PubMed] [Google Scholar]
- 12.Holthöfer H, Miettinen A, Lehto VP, Lehtonen E, Virtanen I: Expression of vimentin and cytokeratin types of intermediate filament proteins in developing and adult human kidneys. Lab Invest 1984, 50:552-559 [PubMed] [Google Scholar]
- 13.Nouwen EJ, Verstrepen WA, Buyssens N, Zhu MQ, De Bore ME: Hyperplasia, hypertrophy, and phenotypic alterations in the distal nephron after acute proximal tubular injury in the rat. Lab Invest 1994, 70:479-493 [PubMed] [Google Scholar]
- 14.Cuppage FE, Cunningham N, Tate A: Nucleic acid synthesis in the regenerating nephron following injury with mercuric chloride. Lab Invest 1969, 21:449-457 [PubMed] [Google Scholar]
- 15.Nonclercq D, Toubeau G, Laurent G, Tulkens PM, Heuson-Stiennon JA: Tissue injury and repair in the rat kidney after exposure to cisplatin or carboplatin. Exp Mol Pathol 1989, 51:123-140 [DOI] [PubMed] [Google Scholar]
- 16.Short BG, Burnett VL, Cox MG, Bus JS, Swenberg JA: Site-specific renal cytotoxicity and cell proliferation in male rats exposed to petroleum hydrocarbons. Lab Invest 1987, 57:564-577 [PubMed] [Google Scholar]
- 17.Peterson DR, Carone FA: Renal regeneration following d-serine induced acute tubular necrosis. Anat Rec 1979, 193:383-388 [DOI] [PubMed] [Google Scholar]
- 18.Haagsma BH, Pound AW: Mercuric chloride-induced tubulonecrosis in the rat kidney: the recovery phase. Br J Exp Pathol 1980, 61:229-241 [PMC free article] [PubMed] [Google Scholar]
- 19.Charles Jennette J, Olson JL, Schwartz MM, Silva FG: Anatomy. Heptinstall’s Pathology of the Kidney. Edited by C Jennette, JL Olson, MM Schwartz, FG Silva. Philadelphia, Lippincott-Raven, 1998, pp 3–66
- 20.Sappino AP, Schürch W, Gabbiani G: Differentiation repertoire of fibroblastic cells: expression of cytoskeletal proteins as marker of phenotypic modulations. Lab Invest 1990, 63:144-161 [PubMed] [Google Scholar]
- 21.Nakagawa T, Sasahara M, Haneda M, Kataoka H, Nakagawa H, Yagi M, Kikkawa R, Hazama F: Role of PDGF B-chain and PDGF receptors in rat tubular regeneration after acute injury. Am J Pathol 1999, 155:1689-1699 [DOI] [PMC free article] [PubMed] [Google Scholar]
- 22.Basile DP, Rovak JM, Martin DR, Hammerman MR: Increased transforming growth factor-beta 1 expression in regenerating rat renal tubules following ischemic injury. Am J Physiol 1996, 270:F500-F509 [DOI] [PubMed] [Google Scholar]
- 23.Diamond JR, van Goor H, Ding G, Engelmyer E: Myofibroblasts in experimental hydronephrosis. Am J Pathol 1995, 146:121-129 [PMC free article] [PubMed] [Google Scholar]
- 24.Ghielli M, Verstrepen WA, Nouwen E, De Broe ME: Regeneration processes in the kidney after acute injury: role of infiltrating cells. Exp Nephrol 1998, 6:502-507 [DOI] [PubMed] [Google Scholar]
- 25.Walker PD: Alterations in renal tubular extracellular matrix components after ischemia-reperfusion injury to the kidney. Lab Invest 1994, 70:339-346 [PubMed] [Google Scholar]
- 26.Basile DP, Martin DR, Hammerman MR: Extracellular matrix-related genes in kidney after ischemic injury: potential role for TGF-β in repair. Am J Physiol 1998, 275:F894-F903 [DOI] [PubMed] [Google Scholar]
- 27.Stein JH, Gottschall J, Osgood RW, Ferris TF: Pathophysiology of a nephrotoxic model of acute renal failure. Kidney Int 1975, 8:27-41 [DOI] [PubMed] [Google Scholar]
- 28.Nagle RB, Kneiser MR, Bulger RE, Benditt EP: Induction of smooth muscle characteristics in renal interstitial fibroblasts during obstructive nephropathy. Lab Invest 1973, 29:422-427 [PubMed] [Google Scholar]
- 29.Nagle RB, Evans LW, Reynolds DG: Contractility of renal cortex following complete ureteral obstruction. Proc Soc Exp Biol Med 1975, 148:611-614 [DOI] [PubMed] [Google Scholar]
- 30.Darby I, Skalli O, Gabbiani G: α-smooth muscle actin is transiently expressed by myofibroblasts during experimental wound healing. Lab Invest 1990, 63:21-29 [PubMed] [Google Scholar]
- 31.Clark RA: Regulation of fibroplasia in cutaneous wound repair. Am J Med Sci 1993, 306:42-48 [DOI] [PubMed] [Google Scholar]
- 32.Ichimura T, Maier JA, Maciag T, Zhang G, Stevens JL: FGF-1 in normal and regenerating kidney: expression in mononuclear, interstitial, and regenerating epithelial cells. Am J Physiol 1995, 269:F653-F662 [DOI] [PubMed] [Google Scholar]
- 33.Ichimura T, Finch PW, Zhang G, Kan M, Stevens JL: Induction of FGF-7 after kidney damage: a possible paracrine mechanism for tubule repair. Am J Physiol 1996, 271:F967-F976 [DOI] [PubMed] [Google Scholar]
- 34.Finch PW, Rubin JS, Miki T, Ron D, Aaronson SA: Human KGF is FGF-related with properties of a paracrine effector of epithelial cell growth. Science 1989, 245:752-755 [DOI] [PubMed] [Google Scholar]
- 35.Igawa T, Matsumoto K, Kanda S, Saito Y, Nakamura T: Hepatocyte growth factor may function as a renotropic factor for regeneration in rats with acute renal injury. Am J Physiol 1993, 265:F61-F69 [DOI] [PubMed] [Google Scholar]
- 36.Verstrepen WA, Nouwen EJ, Yue XS, BeBroe ME: Altered growth factor expression during toxic proximal tubular necrosis and regeneration. Kidney Int 1993, 43:1267-1279 [DOI] [PubMed] [Google Scholar]
- 37.Matejka GL, Jennische E: IGF-I binding and IGF-I mRNA expression in the post-ischemic regenerating rat kidney. Kidney Int 1992, 42:1113-1123 [DOI] [PubMed] [Google Scholar]
- 38.Tsao T, Wang J, Fervenza FC, Vu TH, Jin IH, Hoffman AR, Rabkin R: Renal growth hormone-insulin-like growth factor-I system in acute renal failure. Kidney Int 1995, 47:1658-1668 [DOI] [PubMed] [Google Scholar]
- 39.Homma T, Sakai M, Cheng HF, Yasuda T, Coffey RJ, Jr, Harris RC: Induction of heparin-binding epidermal growth factor-like growth factor mRNA in rat kidney after acute injury. J Clin Invest 1995, 96:1018-1025 [DOI] [PMC free article] [PubMed] [Google Scholar]
- 40.Shimizu A, Yamanaka N: Apoptosis and cell desquamation in repair process of ischemic tubular necrosis. Virchows Arch (Cell Pathol) 1993, 64:171-180 [DOI] [PubMed] [Google Scholar]
- 41.Fernandez-Llama P, Andrews P, Turner R, Saggi S, Dimari J, Kwon TH, Nielsen S, Safirstein R, Knepper MA: Decreased abundance of collecting duct aquaporins in post-ischemic renal failure in rats. J Am Soc Nephrol 1999, 10:1658-1668 [DOI] [PubMed] [Google Scholar]
- 42.Safirstein R, Megyesi J, Saggi SJ, Price PM, Poon M, Rollins BJ, Taubman MB: Expression of cytokine-like genes JE and KC is increased during renal ischemia. Am J Physiol 1991, 261:F1095-F1101 [DOI] [PubMed] [Google Scholar]