

Abstract
A minor component (about 25%) of lymphocytes in Hodgkin’s disease (HD) are CD8+ T cells. It is unclear whether the presence of these cells reflects an antitumor cytotoxic response. The goal of the present study was to investigate clonal composition and the T cell receptor (TCR) β repertoire of the CD8+ T cell population in HD. Single CD8+ cells were micromanipulated from frozen tissue sections of lymph nodes affected by primary HD and subjected to single target amplification of TCRβ gene rearrangements. Sequence analysis of the V region genes revealed the presence of expanded CD8+ T cell clones in all three cases analyzed. Most of these clonal expansions accounted for less than 10% of the CD8+ T cell population. In one case, 30% of the CD8+ T cells belonged to one or two clones. Comparison of V region sequences, however, did not provide evidence that the micromanipulated CD8+ cells were sampled from a population that was selected for particular antigen specificities. No obvious biases in TCR Vβ and Jβ gene segment usage or CDR3 length distribution were found. Similarities of CDR3 amino acid sequences as found in selected CDR3 structures were rare. These results suggest that, like CD4+ T cells, CD8+ T cells may also be recruited into the tumor tissue in an antigen-nonspecific manner.
In classical Hodgkin’s disease (HD), the B-cell-derived tumor cells with characteristic morphology known as Hodgkin-Reed-Sternberg (HRS) cells account for only a small fraction of the cells in the tumor. 1-3 They are surrounded by a polymorphous infiltrate composed mainly of T lymphocytes but also of a variable admixture of histiocytes, eosinophils, and plasma cells. 4,5 Most T cells in HD tumor tissue are CD4+. These cells densely surround HRS cells. The finding that HRS cells secrete the CD4+ T cell attractant thymus and activation-related chemokine (TARC) 6 and the polyclonal nature of the CD4+ T cells rosetting around HRS cells 7,8 have lent support to the view that CD4+ T cells are recruited into the tumor tissue in an antigen-nonspecific fashion. Besides CD4+ T cells, a variable fraction of cells in HD tumor tissue are CD8+ cytotoxic T lymphocytes (CTL) expressing granzyme B and perforin. 9
In 40% of HD cases, HRS cells carry Epstein-Barr virus (EBV). 10,11 EBV+ HD is associated with a higher percentage of CD8+ cells, resulting in a lower CD4/CD8 ratio in these cases. 9 CD8+ cells were found to contribute a mean fraction of 21% of the reactive lymphocytes in EBV− and 34% in EBV+ HD. 9 Surprisingly, a high percentage of activated CD8+ cells in lymph nodes infiltrated with HD has recently been shown to be associated with a poor prognosis. 12
The question whether CTL in lymph nodes infiltrated by HD represent an antitumor cytotoxic immune response or, alternatively, are a nonspecifically attracted bystander population remains unresolved. The present study addresses this issue by analyzing clonal composition and T cell receptor (TCR) repertoire of CD8+ cells in HD-affected lymph nodes from three cases (2 EBV+, 1 EBV−) of primary disease. Single CD8+ cells were micromanipulated from sections of tumor tissue. TCRβ gene rearrangements were amplified from these single cells using mixtures of Vβ-family- and Jβ-specific primers. The gene rearrangements were analyzed with respect to clonal identity, Vβ and Jβ gene segment usage and shared CDR3 amino acid motifs.
Materials and Methods
Tissue Samples
Cervical lymph nodes removed for diagnostic purposes at primary manifestation of HD were analyzed. Clinical and histopathological data are summarized in Table 1 ▶ . EBV status was determined by EBV-encoded RNA in situ hybridization as described. 13
Table 1.
Summary of Clinical and Histopathological Data and Single Cell PCR Results
| Case | HD subtype | Disease stage | CD30 | CD15 | EBER | Number of CD8+ cells micromanipulated | Number of specific PCR products | Functional/ nonfunctional rearrangements | Clonal relationship |
|---|---|---|---|---|---|---|---|---|---|
| 1 | NS | I B | + | − | + | 160 | 45 | 39 /6 | clone 1 3/39 |
| clone 2 2/39 | |||||||||
| clone 3 2/39 | |||||||||
| clone 4 2/39 | |||||||||
| 2 | NS | II A | + | + | − | 173 | 43 | 30 /13 | clone 1 9/30 |
| clone 2 5/30 | |||||||||
| clone 3 2/30 | |||||||||
| clone 4 2/30 | |||||||||
| 3 | MC | II A | + | − | + | 160 | 32 | 25 /7 | clone 1 2/25 |
| clone 2 2/25 | |||||||||
| clone 3 2/25 | |||||||||
| Controls | 32 FACS-sorted T cells | 23 | 18 /5 | 0 | |||||
| 32 B cells | 0 | ||||||||
| 32 buffer samples | 0 | ||||||||
| 32 water samples | 0 |
FACS, fluorescence-activated cell sorter; NS, nodular sclerosis; MC, mixed cellularity. Subtype and stage are according to World Health Organization and Ann Arbor classifications.
Immunostaining and Micromanipulation
Immunostaining of frozen tissue sections was performed as described, 14 using monoclonal antibodies against CD30 (BerH2, Dako, Glostrup, Denmark), CD8 (DK25, Dako), and CD20 (L26, Dako). Alkaline phosphatase was developed using Fast Red TR (Sigma, Deisenhofen, Germany). Single cells were collected by micromanipulation as described 14 and transferred into polymerase chain reaction (PCR) tubes. For each case, two different areas showing tumor infiltration were chosen for micromanipulation.
Amplification of TCR Vβ Gene Rearrangements and Sequence Analysis
Amplification of TCR Vβ gene rearrangements was performed as described. 7 Briefly, micromanipulated cells were incubated with proteinase K. A first round of PCR was carried out in the same tube using a mix of 25 Vβ family- and 7 Jβ-specific primers. A second round of amplification was carried out in 96-well plates adding 1 μl of the first-round reaction to each of 8 reaction mixtures, each containing 2 to 5 of the 25 Vβ primers and a mixture of internal Jβ primers.
PCR products were directly sequenced using the Ready Reaction dRhodamine cycle sequencing kit (Perkin Elmer, Foster City, CA) as recommended by the manufacturer. Sequences of Vβ gene rearrangements were deposited in the European Molecular Biology Laboratory database under accession numbers AJ403708-AJ403865.
Results
Tumor Tissue
In cases 1 and 3, HRS cells were positive for EBV-encoded RNA as determined by in situ hybridization (data not shown). CD8+ cells were markedly more frequent in the EBV+ cases, with case 1 containing the highest numbers. In this case, CD8+ cells were scattered throughout the tumor nodules and were often found close to the HRS cells, sometimes even in direct contact with them (Figure 1A) ▶ . CD8+ cells in case 2 were found mostly at the periphery of the nodules close to and within the fibrotic bands, but rarely if ever close to HRS cells, or in the center of the tumor nodules where most HRS cells resided (Figure 1B) ▶ . The CD8+ cells of case 3 seemed to be scattered randomly over the tissue and were seldom found in close contact with HRS cells.
Figure 1.
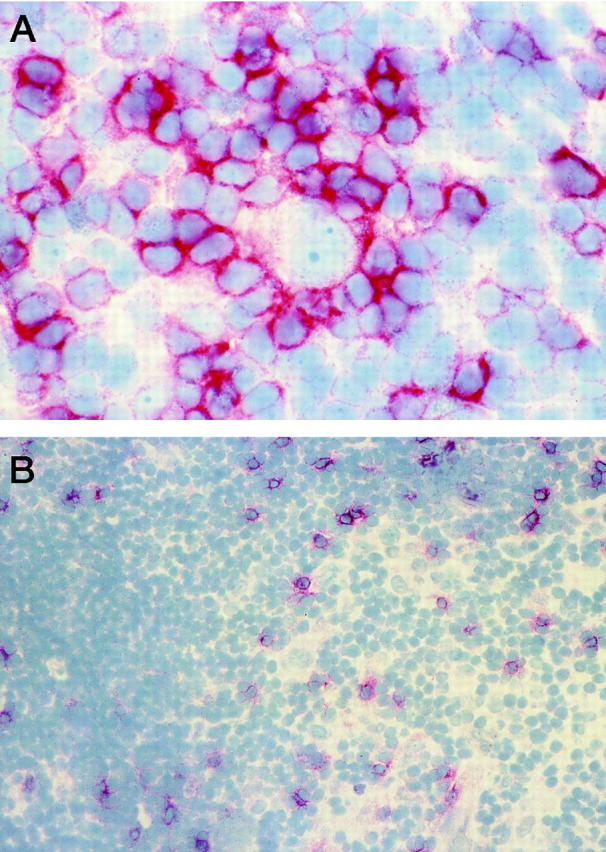
Frozen tissue sections stained with an antibody for CD8. A: CD8+ cells rosetting around HRS cells (case 1; original magnification, ×60). B: Scarce infiltrate of CD8+ cells in case 2 (original magnification, ×20).
Micromanipulation and PCR Analysis of CD8+ T Cells in HD
Areas showing infiltration by HRS cells were identified in CD30-stained sections. Single CD8+ cells from an adjacent section were micromanipulated and transferred into PCR tubes. TCRβ gene rearrangements were amplified from these single cells using mixtures of Vβ-family- and Jβ-specific primers and were directly sequenced. In each of the cases analyzed, single B cells were micromanipulated as negative controls from adjacent sections stained for CD20. Aliquots of the buffer covering the section during the micromanipulation procedure (buffer samples, Table 1 ▶ ) and PCR tubes containing PCR reagents but no cell (water controls, Table 1 ▶ ) served as additional controls. Single CD3+αβ+ T cells from peripheral blood of a healthy donor were flow-cytometrically sorted into PCR tubes and analyzed as a control for the efficiency of single target amplification of TCRβ gene rearrangements.
Table 1 ▶ shows an overview of the single cell PCR results. Twenty-four percent of the micromanipulated T cells yielded a specific PCR product. This PCR efficiency fits with our earlier results. 7 None of the negative control samples, but 23 of 32 (71%) of the sorted single CD3+αβTCR+ T cells, yielded a specific product, demonstrating the high efficiency of single cell PCR. The rearrangements obtained from sorted T cells were all unrelated to each other and to the rearrangements amplified from micromanipulated cells.
Clonal Composition of the CD8+ T Cell Population in HD
In cases 1, 2, and 3, micromanipulated CD8+ T cells yielded 45, 43, and 32 TCR gene rearrangements, respectively, 39, 30, and 25 of which were potentially functional. In each of the three cases, clonal expansions were detected by amplification of identical gene rearrangements from different CD8+ cells. In case 1, four clones were identified with 3 or 2 members in the sample. Among the 43 gene rearrangements in case 2, nine belonged to one clone (clone 1). Five identical nonfunctional (out-of-frame) gene rearrangements may represent either a second clone (clone 2) or, more likely, were amplified from the second allele of the TCR-β locus of clone 1. Two additional clones were represented with two members each. In case 3, three pairs of identical gene rearrangements were detected among the 32 TCR V region sequences obtained in total.
Sequence Comparison of Potentially Functional TCRβ Gene Rearrangements
Rearrangements of functional Vβ gene segments which were rearranged in frame and devoid of stop codons in CDR3, thus potentially functional, might be subject to selection by antigen. Therefore, potentially functional gene rearrangements from CD8+ T cells from HD tissue were compared with each other and with a control collection of 196 potentially functional Vβ gene rearrangements amplified from sorted single T cells from peripheral blood of four healthy donors.
Figures 2 and 3 ▶ ▶ show the distribution of the Vβ and Jβ gene segments used in potentially functional TCRβ gene rearrangements of CD8+ T cells from the three cases of HD and the control T cells. Clonally related sequences were counted only once. A broad spectrum of Vβ gene segments was used by the CD8+ T cells. Given the relatively small number of sequences, no striking overrepresentation of particular Vβ gene families was observed. The usage of Jβ gene segments in the rearrangements from micromanipulated CD8+ T cells was similar to that determined in the control collection and in accordance with published data on Jβ gene segment usage in peripheral blood T cells of healthy individuals. 15,16
Figure 2.

Vβ-gene family usage. Usage of Vβ-gene families of potentially functional Vβ gene rearrangements. Gene rearrangements amplified from single CD8+ T cells in three cases of Hodgkin’s disease were compared to αβ+ T cells of healthy donors (n = 39, 30, 25, and 196, respectively). Clonal rearrangements only counted once.
Figure 3.

Jβ gene segment usage. Usage of Jβ gene segments of potentially functional gene rearrangements. Gene rearrangements amplified from single CD8+ T cells in three cases of Hodgkin’s disease were compared to αβ+ T cells of healthy donors (n = 39, 30, 25, and 196, respectively). Clonal rearrangements only counted once.
Selection of a T cell population for a common antigen specificity may reflect itself in identical or similar CDR3 amino acid sequence motifs in clonally independent T cells. To compare CDR3 sequences of gene rearrangements from CD8+ T cells of each case, deduced amino acid sequences were aligned according to the conserved motifs of the Vβ or the Jβ gene segments flanking CDR3. In particular, those rearrangements were compared which used either the same Vβ or Jβ gene segment or which had a CDR3 of identical length. For comparison, amino acids were grouped into hydrophobic (L, I, F, M, V, A), polar (Q, N, T, S, Y), acidic (D, E), basic (R, K, H), and small nonpolar, predominantly found in turns (G, P). However, no striking similarities or dominant motifs were found except for a pair of unique rearrangements amplified from cells of case 3. These sequences were both BV3S1 - BJ2.2 rearrangements, the CDR3s had the same length and three amino acids encoded by N nucleotides (nucleotides randomly inserted at junctions during gene rearrangement, printed in italics) were identical (CASSLSGRPGQGAAGELFFG; CASSLSGRRDRGRLGELFFG).
Discussion
In support of the concept of immunosurveillance, which postulates a critical role for the immune system in the elimination of tumor cells, 17 clonal expansions of CTL specific for antigens presented by the tumor cells have been detected in various malignancies. 18,19 In contrast to other solid tumors where infiltrating T cells usually are a minor component, T cells account for most of the tumor mass in HD. CD4+ T cells predominate; however, they do not seem to be involved in an antitumor response. 7,8 The relevance of the 10 to 25% of CD8+ T cells, 20 which are usually found interspersed among the CD4+ T cells, remains unknown. These cells might represent a cytotoxic response directed against the HRS cell population. Whether HRS cells are capable of presenting antigenic peptides on MHC class I molecules has been a matter of controversy, 9,21 but recent data support that they are in principle susceptible to lysis by CTL. 22,23
The present study addresses the question whether the composition of the CD8+ T cell population in HD is random or whether clonal expansions and a restricted TCRβ repertoire suggest that these cells are selected for common antigen specificities. Single CD8+ T cells were micromanipulated from frozen sections of biopsy specimens from three cases of primary HD. TCRβ gene rearrangements were amplified from these single cells and their sequences compared for clonal identity.
A total of 45, 43, and 32 TCR gene rearrangements were amplified from CD8+ cells in cases 1, 2, and 3, respectively. Within each of these samples, clonal expansions could be detected. Most of these clones were represented with two members, thus accounting for less than 10% of the CD8+ T cell population. The rearrangements of clones 1 and 2 of case 2 were amplified from nine and five cells, respectively. In total, cells belonging to expanded clones accounted for 42% of the CD8+ T cells analyzed in case 2. Except for the presence of expanded clones, comparison of the gene rearrangements amplified from CD8+ T cells with respect to TCR gene segment usage, CDR3 length and shared CDR3 amino acid motifs provided little if any evidence that the T cells were sampled from a population that was selected for common antigen specificities. Several explanations for this finding are possible.
First, the CD8+ T cell population may in fact be unselected and not engaged in an antitumor response. The HRS cells may secrete CD8 T cell attractants in addition to the helper cell chemotaxis factor TARC, thereby recruiting not only CD4+ but also CD8+ T cells into the tumor tissue in an antigen-nonspecific manner. In this case, the composition of the CD8+ population in the diseased tissue may simply reflect the composition of the peripheral CD8 T cell pool (or the fraction of this pool responsive to the hypothetical attractant). The finding of clonal expansions in all three cases analyzed does not argue against this notion since expanded CD8 T cell clones are frequently encountered even in the peripheral blood of healthy individuals. 24,25
Alternative explanations are that the spectrum of TCRs reactive with hypothetical dominant epitopes presented by HRS cells might be very large or that the number of target epitopes recognized by the CD8+ cells in HD tissue is high. In these situations, similarities of the TCRs may not be detectable in a limited number of sequences.
HRS cells present immunogenic peptides on MHC class I molecules and should, therefore, be susceptible to lysis by CTL specific for, eg, EBV-derived peptides or other tumor antigens. 26 Direct comparison of the CTL repertoire of peripheral blood with that of the tumor infiltrated lymph node and determination of the antigen specificity of CTL clones expanded in situ might elucidate the nature of the CD8+ T cells in HD tissue.
Acknowledgments
We thank Ralf Küppers for helpful dicussion and for critically reading the manuscript, Tilmann Spieker for performing the in situ hybridization, and Christiane Gerhard and Tanja Schaffer for excellent sequencing work.
Footnotes
Address reprint requests to Klaus Willenbrock, Senckenbergisches Institut für Pathologie, Universitätsklinik Frankfurt, Theodor Stern Kai 7, D 60590 Frankfurt am Main, Germany. E-mail: Willenbrock@em.uni-frankfurt.de.
Supported by Deutsche Krebshilfe, Mildred Scheel Stiftung, and Deutsche Forschungsgemeinschaft through SFB 502.
K. W. and A. R. contributed equally to this work.
References
- 1.Küppers R, Rajewsky K, Zhao M, Simons G, Laumann R, Fischer R, Hansmann ML: Hodgkin disease: Hodgkin and Reed-Sternberg cells picked from histological sections show clonal immunoglobulin gene rearrangements and appear to be derived from B cells at various stages of development. Proc Natl Acad Sci USA 1994, 91:10962-10966 [DOI] [PMC free article] [PubMed] [Google Scholar]
- 2.Küppers R, Rajewsky K: The origin of Hodgkin and Reed/Sternberg cells in Hodgkin’s disease. Annu Rev Immunol 1998, 16:471-493 [DOI] [PubMed] [Google Scholar]
- 3.Küppers R, Klein U, Hansmann ML, Rajewsky K: Cellular origin of human B cell lymphomas. N Engl J Med 1999, 341:1520-1529 [DOI] [PubMed] [Google Scholar]
- 4.Lukes R, Butler J, Hicks E: Natural history of Hodgkin’s disease as related to its pathological picture. Cancer 1966, 19:317-344 [Google Scholar]
- 5.Poppema S: The nature of the lymphocytes surrounding Reed-Sternberg cells in nodular lymphocyte predominance and in other types of Hodgkin’s disease. Am J Pathol 1989, 135:351-357 [PMC free article] [PubMed] [Google Scholar]
- 6.van den Berg A, Visser L, Poppema S: High expression of the CC chemokine TARC in Reed-Sternberg cells: a possible explanation for the characteristic T cell infiltrate in Hodgkin’s lymphoma. Am J Pathol 1999, 154:1685-1691 [DOI] [PMC free article] [PubMed] [Google Scholar]
- 7.Roers A, Montesinos-Rongen M, Hansmann ML, Rajewsky K, Küppers R: Amplification of TCRbeta gene rearrangements from micromanipulated single cells: T cells rosetting around Hodgkin and Reed-Sternberg cells in Hodgkin’s disease are polyclonal. Eur J Immunol 1998, 28:2424-2431 [DOI] [PubMed] [Google Scholar]
- 8.Meggetto F, al Saati T, Rubin B, Delsol G: Lack of restricted T-cell receptor beta-chain variable region (V beta) usage of reactive T-lymphocytes in Hodgkin’s disease. Br J Haematol 1994, 86:524–532 [DOI] [PubMed]
- 9.Oudejans JJ, Jiwa NM, Kummer JA, Horstman A, Vos W, Baak JP, Kluin PM, van der Valk P, Walboomers JM, Meijer CJ: Analysis of major histocompatibility complex class I expression on Reed-Sternberg cells in relation to the cytotoxic T-cell response in Epstein-Barr virus-positive and -negative Hodgkin’s disease. Blood 1996, 87:3844-3851 [PubMed] [Google Scholar]
- 10.Herbst H, Dallenbach F, Hummel M, Niedobitek G, Pileri S, Muller-Lantzsch N, Stein H: Epstein-Barr virus latent membrane protein expression in Hodgkin and Reed-Sternberg cells. Proc Natl Acad Sci USA 1991, 88:4766-4770 [DOI] [PMC free article] [PubMed] [Google Scholar]
- 11.Delsol G, Brousset P, Chittal S, Rigal-Huguet F: Correlation of the expression of Epstein-Barr virus latent membrane protein and in situ hybridization with biotinylated BamHI-W probes in Hodgkin’s disease. Am J Pathol 1992, 140:247-253 [PMC free article] [PubMed] [Google Scholar]
- 12.Oudejans JJ, Jiwa NM, Kummer JA, Ossenkoppele GJ, van Heerde P, Baars JW, Kluin PM, Kluin-Nelemans JC, van Diest PJ, Middeldorp JM, Meijer CJ: Activated cytotoxic T cells as prognostic marker in Hodgkin’s disease (see comments). Blood 1997, 89:1376-1382 [PubMed] [Google Scholar]
- 13.Bräuninger A, Küppers R, Spieker T, Siebert R, Strickler JG, Schlegelberger B, Rajewsky K, Hansmann ML: Molecular analysis of single B cells from T-cell-rich B-cell lymphoma shows the derivation of the tumor cells from mutating germinal center B cells and exemplifies means by which immunoglobulin genes are modified in germinal center B cells. Blood 1999, 93:2679-2687 [PubMed] [Google Scholar]
- 14.Küppers R, Zhao M, Hansmann ML, Rajewsky K: Tracing B cell development in human germinal centres by molecular analysis of single cells picked from histological sections. EMBO J 1993, 12:4955-4967 [DOI] [PMC free article] [PubMed] [Google Scholar]
- 15.Doherty PJ, Roifman CM, Pan SH, Cymerman U, Ho SW, Thompson E, Kamel-Reid S, Cohen A: Expression of the human T cell receptor V beta repertoire. Mol Immunol 1991, 28:607-612 [DOI] [PubMed] [Google Scholar]
- 16.Rosenberg WM, Moss PA, Bell JI: Variation in human T cell receptor V beta and J beta repertoire: analysis using anchor polymerase chain reaction. Eur J Immunol 1992, 22:541-549 [DOI] [PubMed] [Google Scholar]
- 17.Burnet FM: The concept of immunological surveillance. Prog Exp Tumor Res 1970, 13:1-27 [DOI] [PubMed] [Google Scholar]
- 18.Mackensen A, Carcelain G, Viel S, Raynal MC, Michalaki H, Triebel F, Bosq J, Hercend T: Direct evidence to support the immunosurveillance concept in a human regressive melanoma. J Clin Invest 1994, 93:1397-1402 [DOI] [PMC free article] [PubMed] [Google Scholar]
- 19.Farace F, Orlanducci F, Dietrich PY, Gaudin C, Angevin E, Courtier MH, Bayle C, Hercend T, Triebel F: T cell repertoire in patients with B chronic lymphocytic leukemia. Evidence for multiple in vivo T cell clonal expansions. J Immunol 1994, 153:4281–4290 [PubMed]
- 20.Poppema S, Bhan AK, Reinherz EL, Posner MR, Schlossman SF: In situ immunologic characterization of cellular constituents in lymph nodes and spleens involved by Hodgkin’s disease. Blood 1982, 59:226-232 [PubMed] [Google Scholar]
- 21.Poppema S, Visser L: Absence of HLA class I expression by Reed-Sternberg Cells. Am J Pathol 1994, 145:37-41 [PMC free article] [PubMed] [Google Scholar]
- 22.Murray PG, Constandinou CM, Crocker J, Young LS, Ambinder RF: Analysis of major histocompatibility complex class I, TAP expression, and LMP2 epitope sequence in Epstein-Barr virus-positive Hodgkin’s disease. Blood 1998, 92:2477-2483 [PubMed] [Google Scholar]
- 23.Lee SP, Constandinou CM, Thomas WA, Croom-Carter D, Blake NW, Murray PG, Crocker J, Rickinson AB: Antigen presenting phenotype of Hodgkin Reed-Sternberg cells: analysis of the HLA class I processing pathway and the effects of interleukin-10 on Epstein-Barr virus-specific cytotoxic T-cell recognition. Blood 1998, 92:1020-1030 [PubMed] [Google Scholar]
- 24.Posnett DN, Sinha R, Kabak S, Russo C: Clonal populations of T cells in normal elderly humans: the T cell equivalent to “benign monoclonal gammapathy” (published erratum appears in J Exp Med 1994, 179:1077). J Exp Med 1994, 179:609-618 [DOI] [PMC free article] [PubMed] [Google Scholar]
- 25.Shen DF, Doukhan L, Kalams S, Delwart E: High-resolution analysis of T-cell receptor beta-chain repertoires using DNA heteroduplex tracking: generally stable, clonal CD8+ expansions in all healthy young adults. J Immunol Methods 1998, 215:113-121 [DOI] [PubMed] [Google Scholar]
- 26.Rickinson AB, Moss DJ: Human cytotoxic T lymphocyte responses to Epstein-Barr virus infection. Annu Rev Immunol 1997, 15:405-431 [DOI] [PubMed] [Google Scholar]