Abstract
RATIONALE and OBJECTIVES
Contrast-enhanced digital mammography and digital breast tomosynthesis are 2 imaging techniques that attempt to increase malignant breast lesion conspicuity. The combination of these into a single technique, contrast-enhanced digital breast tomosynthesis (CE-DBT), could potentially integrate the strengths of both.
The objectives of this study were to assess the clinical feasibility of CE-DBT as an adjunct to digital mammography, and to correlate lesion enhancement characteristics and morphology obtained with CE-DBT to digital mammography, ultrasound, and magnetic resonance (MR).
MATERIALS and METHODS
CE-DBT (GE Senographe 2000D, Milwaukee, WI) was performed as a pilot study in an ongoing NCI-funded grant (P01 CA85484) studying multimodality breast imaging. 13 patients with ACR BI-RADS category 4 or 5 breast lesions underwent imaging with digital mammography, ultrasound, MR, and CE-DBT. CE-DBT was performed at 45-49 kVp with a rhodium target and a 0.27 mm copper (Alfa Aesar, Ward Hill, MA) filter. Pre- and post-injection DBT image sets were acquired in the MLO projection with slight compression. Each image set consists of 9 images acquired over a 50° arc and was obtained with a mean glandular x-ray dose comparable to two conventional mammographic views. Between the pre- and post-contrast DBT image sets, a single bolus of iodinated contrast agent (1 ml/kg at 2 ml/s; Omnipaque-300, Amersham Health Inc., Princeton, NJ) was administered. Images were reconstructed using filtered-backprojection in 1 mm increments, and transmitted to a clinical PACS workstation.
RESULTS
Initial experience suggests that CE-DBT provides morphologic and vascular characteristics of breast lesions qualitatively concordant with that of digital mammography and MR.
CONCLUSION
As an adjunct to digital mammography, CE-DBT may be a potential alternative tool for breast lesion morphologic and vascular characterization.
Keywords: Breast imaging - technical development, Contrast-enhanced digital mammography, Contrast-enhanced digital breast tomosynthesis, Breast MR
INTRODUCTION
Vascular neoangiogenesis has been shown to be essential for breast cancer growth (1). Malignant breast tumor angiogenesis factors stimulate formation of disorganized vessel networks with abnormally increased vessel permeability (1). As a result, the enhancement pattern of breast cancers with vascular contrast agents often differs from that of benign and normal breast tissues. This aspect of breast cancer biology has been most extensively illustrated with gadolinium-enhanced breast magnetic resonance (MR), which when applied clinically provides vascular characterization of breast lesions (2-5).
X-ray techniques combined with contrast agents are also able to demonstrate this feature of breast cancer biology, as has been illustrated with digital subtraction angiography of the breast (6, 7) and contrast-enhanced CT of the breast (8-11). Jong et al (12), Lewin et al (13), and Diekmann et al (14) have demonstrated that enhancement of breast cancers can be detected with contrast-enhanced digital mammography, and that this technique can increase mammographic lesion conspicuity.
Contrast-enhanced digital mammography, however, is a projection technique and the superimposition of nonadjacent breast tissues may unfavorably impact lesion conspicuity even with intravenous contrast enhancement. Digital breast tomosynthesis is a recent innovation in x-ray breast imaging in which sequential tomographic images through the breast can be reconstructed from a limited number of projection images obtained at various angles. This technique attempts to increase lesion conspicuity and highlight lesion morphology by minimizing the superimposition of overlying breast tissue that occurs with 2-dimensional projection mammographic images. A recent preliminary report from an ongoing study by Rafferty et al (15) claimed a 16% increase in sensitivity and an 85% decrease in false positives with digital breast tomosynthesis compared to digital mammography.
The combination of contrast-enhanced digital mammography and digital breast tomosynthesis into a single technique would potentially integrate the benefits of both techniques, thus providing both breast cancer morphology and vascular information. Also, using x-ray techniques in this fashion has the advantage of more direct correlation with conventional mammography for biopsy or pre-operative localization purposes, avoiding the difficulties of intermodality lesion registration and correlation. X-ray techniques are also lower in cost than breast MR and potentially more widely available.
In this report we describe our initial clinical experience with contrast-enhanced digital breast tomosynthesis (CE-DBT) for breast lesion evaluation. We also correlate our results from CE-DBT with those of digital mammography, breast ultrasound (US), and gadolinium-enhanced breast MR.
MATERIALS & METHODS
PATIENT POPULATION
Institutional review board approval was obtained for a pilot project to assess the clinical feasibility of CE-DBT for breast lesion evaluation. The CE-DBT pilot project is part of an ongoing NCI-funded grant (PO1-CA85484) studying multimodality breast imaging (including digital mammography, US, and breast MR). From the population of women with BIRADS® (16) category 4 or 5 breast lesions referred to our institution for further evaluation and who were enrolled in the multimodality breast imaging study, 13 women were recruited for participation in the CE-DBT pilot project between April 2005 and November 2005. Informed patient consent was obtained after the full nature of the procedure had been fully explained, and the study was compliant with HIPAA.
TECHNIQUE
After undergoing breast imaging evaluation (including digital mammography, US, and MR) as part of the parent multimodality breast imaging study, patients were evaluated with CE-DBT. All patients had a tissue diagnosis established (either before or after multimodality imaging, depending on stage of patient work-up at the time of study recruitment). Three breast imagers correlated the tomographic images with the other imaging modalities.
IMAGING SYSTEM
Images were acquired with a commercial FFDM system (Senographe 2000D, General Electric Medical Systems, Milwaukee, WI) modified with IRB-approval and the assistance of the manufacturer to allow CE-DBT. The x-ray gantry was altered to allow the arm supporting the x-ray tube to be rotated while compression was maintained. The x-ray tube arm could be positioned in any one of nine angles determined by fixed mechanical detents. The breast support was replaced with one that lacked a grid; this allowed the x-ray tube to be angled relative to the detector without suffering grid cut-off. Finally, a new filter wheel was installed that allowed selection of a 30 μm thick Mo filter or a 0.27 mm thick Cu (Alfa Aesar, Ward Hill, MA) filter (17).
IMAGE ACQUISITION
Imaging was performed in the medial lateral oblique (MLO) projection with the patient seated. Metallic markers were placed on the breast (on the skin surface tangential to the x-ray beam) to aid in post-processing registration of images. The breast was immobilized with light compression (5-7 dN) for the duration of the examination (compared with typically 8-18 dN of compression for a conventional mammographic view). This compression was maintained between the pre- and post-contrast data sets.
Each tomosynthesis data set consists of 9 images acquired in 6.25° increments over a 50° arc about the fulcrum of the x-ray tube. The fulcrum of the x-ray tube is 20 cm from the detector. The actual x-ray source is 48 cm from the fulcrum in the 0 degree position (18). The x-ray tube was manually positioned at each of the 9 locations. Images were acquired at 49 kV and 100 mAs with a Rh target and the Cu filter. The choice of filter material and thickness, kV and mAs were based on the work of Skarpathiotakis et al. (17) and physical limitations of the x-ray generator and tube. Each exposure was designed not to exceed 5 kJ because at peak tube temperature, the tube cooling rate is 12 kJ/minute. Thus, for each data set, there was a 30 second time interval between acquisition of each projection image. This time interval allowed for manual repositioning of the x-ray tube, tube cooling, and detector recovery (19).
The dose of one image in the 9 image tomosynthesis data set was approximately 20% the dose of a single conventional mammographic view. Breast entrance doses were calculated based on air kerma measured free-in-air. Doses were calculated for 2-8 cm thick breasts, accounting for the inverse square law, without backscatter. Half value layers were measured using Al filters (99.997% pure, Alfa Aesar, Ward Hill, MA). At 49 kVp, the HVL was 3.4 mm Al. Mean glandular doses were calculated as a function of breast thickness and composition using data published by Boone (20). We simulated the input spectrum necessary for this calculation using a validated extrapolation (19), (21). The mean glandular dose was 5.94 mGy for a breast of thickness 5.3 cm (the mean compressed breast thickness of the patients in this series); this is comparable to the dose of two conventional mammographic views.
For this trial, temporal subtraction was used. A pre-contrast tomosynthesis data set was acquired. A single dose of 1 ml/kg bodyweight of Visipaque-320®(320 mg I/ml iodixanol, Amersham, Princeton, NJ), a nonionic iodinated contrast material with an osmolality equal to that of blood, was then immediately injected by hand at a rate of approximately 2 ml/s into the contralateral antecubital vein. The contrast bolus was followed by a 60 ml saline flush. A post-contrast tomosynthesis data set of 9 images was then acquired, with the first post-contrast image acquired 90 seconds after the start of the contrast injection. Acquisition of the post-contrast data set extends for approximately 5 minutes after commencement of contrast injection. The total examination time was approximately 10 minutes.
IMAGE PROCESSING AND RECONSTRUCTION
Nine projection source images (each acquired at one of the nine fixed angles) with 100 μm pixel pitch and a 1920 × 2304 pixel field-of-view were used for tomographic reconstruction. Tomosynthesis images were reconstructed using a custom filtered-backprojection algorithm. Regions of each source image occluded by the collimator were omitted from the reconstruction; thus, the number of source images used to reconstruct any point in the volume of interest (VOI) varies from five to nine. The regions directly adjacent to the collimator were apodized to avoid reconstruction artifacts at the collimator boundaries. The pre- and post-contrast source image sets were separately reconstructed to form pre- and post-contrast tomographic image sets.
For each set of source images, a VOI of 20.5 × 20.5 × T cm3 was reconstructed, where T was equal to the thickness of the breast as measured by the compression device and recorded in the source image DICOM header. Typically, the VOI was reconstructed in planes parallel to the detector in 1 mm increments, although arbitrary plane spacing was supported; and typically, images were reconstructed with an in-plane voxel pitch of 200 μm, although arbitrary voxel pitches were also supported. The plane spacing and voxel pitch were chosen based on previously reported results (22). The choice of VOI and voxel pitch resulted in tomosynthesis images of size 1k × 1k. This facilitated image archival, as the images could be written using the DICOM CT image-object description (IOD), and were thus readily transmitted and stored by our research workstation and departmental PACS.
The pre- and post-contrast tomosynthesis image sets were subtracted in order to optimize image display. A separate tomographic subtracted image set was generated. In some cases, a rigid translation was applied between the pre- and post-contrast source images prior to subtraction in an attempt to compensate for motion of the breast observed during the procedure. The lead skin markers were used to determine the necessary translation. This subtracted tomosynthesis image set had the same dimensions as the pre- and post-contrast image sets. After subtraction, the subtracted images were averaged vertically (i.e., in the direction perpendicular to the detector) using a moving average over 5 slices and then written as a DICOM CT object to the PACS. The pre- and post-contrast, and the subtracted image sets were each written with a different DICOM series unique identifier; this aided review by allowing image cross-referencing.
The images were viewed in “stack-mode” on either a research workstation (Efilm, V1.5.3, Merge Healthcare, Milwaukee, WI) or on a GE Advantage Windows workstation (V3.4, General Electric Medical Systems, Milwaukee, WI). The images were archived on a GE Centricity PACS. The current reconstruction software implementation is written in C++ and runs on a standard PC with dual 64-bit 2.4 GHz Athlon processors. The system is running SuSe Linux 9.1 Professional with a 64-bit kernel (Novell, Waltham, MA). We typically run two reconstructions simultaneously, reconstructing one time point (pre- or post-contrast) on each of the two processors. It takes approximately 3 minutes to reconstruct 80 to 90 images per time point. Thus, we can review the images almost immediately after the completion of the exam.
RESULTS
Eleven of 13 patients with an age range of 38-61 years (mean 49 years) had pathology proven malignancies, 6 of which were invasive ductal carcinoma, 4 of which were DCIS, and 1 of which was invasive lobular carcinoma. One patient (Case 2) with a benign multimodality imaging and pathology result was undergoing evaluation for a category 4 lesion in the left breast in the context of a positive family history of breast cancer. The other patient (Case 9) with benign pathology results was undergoing evaluation for bloody nipple discharge.
Table 1 summarizes the multimodality imaging results for the index lesion of each patient. Suspicious enhancing lesions were demonstrated with CE-DBT in 10 of 11 cases of pathology proven breast cancer. Cases 1 (Figures 1-3), 3, 6, and 13 were status post core biopsy but pre-surgical excision. Case 5 (Figures 4-6), Case 8, Case 10, and Case 11 were newly image diagnosed cancers. Case 4 was recurrent DCIS at a lumpectomy margin, and Case 7 was reported as residual DCIS adjacent to a lumpectomy margin. In case 12, DCIS was also found at a lumpectomy margin, though this was not suspected on MR or CE-DBT. Post-biopsy collections were present in Cases 1, 4, and 7, and CE-DBT distinguished between these collections and residual cancer. Benign findings were demonstrated on CE-DBT in Case 2. No suspicious finding was demonstrated on CE-DBT in Case 9.
Table 1.
Multimodality Imaging and Pathology Results
| CE-DBT | |||||||
|---|---|---|---|---|---|---|---|
| Case # | Side | Digital Mammography |
Ultrasound | MR | Pathology | Pre-contrast DBT | Post-contrast DBT |
| 1 | Left | 9 mm group of calcifications. Status post core biopsy. |
10×12×9 mm hypoechoic mass. |
11 mm enhancing lesion. Adjacent hematoma. |
Infiltrating ductal carcinoma, 1.8 cm. Biopsy site reaction. |
Rounded density adjacent to biopsy clip. |
Enhancing mass adjacent to post- biopsy seroma/hematoma. |
| 2 | Left | Focal asymmetry with 12 mm cluster of heterogeneous calcifications. |
Negative | Negative | Usual ductal hyperplasia without atypia. |
Negative | Negative |
| 3 | Right | 3.2 cm focal asymmetry |
Multiple solid vascular masses. |
3.5 cm area of clumped enhancement |
Invasive ductal carcinoma |
Multiple masses | Segmental, clumped enhancement. |
| 4 | Right | Post-lumpectomy changes. Residual calcifications at margin. |
Post- lumpectomy seroma |
5mm enhancing nodule at edge of seroma. |
DCIS | Seroma. Otherwise negative. |
Clumped enhancement at edge of seroma. |
| 5 | Right | 1.4 cm ill-defined asymmetry |
Irregular solid mass |
1.3 cm enhancing mass |
Infiltrating ductal carcinoma |
Spiculated mass | Enhancing spiculated mass |
| 6 | Left | 2 masses (1.6 cm and 3 cm), index lesion with biopsy clip. |
2 irregular masses |
2 adjacent enhancing masses (combined size of 4.3 cm). |
Invasive ductal carcinoma |
2 adjacent masses | 2 enhancing masses |
| 7 | Right | Post-excisional biopsy seroma |
Post-excisional biopsy seroma |
Clumped enhancement posterior to seroma |
7.5 × 3.6 × 5.0 cm post-biopsy cavity. Residual intraductal carcinoma. |
Post-excisional biopsy seroma |
Enhancement posterior to seroma |
| 8 | Left | Calcifications on film-screen only. DM negative. |
8 mm mass in medial breast |
Small mass with adjacent focus of enhancement in medial breast |
Invasive ductal carcinoma with DCIS |
No calcifications demonstrated |
Small foci of enhancement in central breast |
| 9 - bloody nipple discharge |
Right | Negative | 2 cm mass in central breast. Retroareolar fibroadenoma |
Enhancing 2 cm mass in central breast. Retroareolar fibroadenoma. |
Intraductal papilloma |
No suspicious finding |
No suspicious finding |
| 10 | Left | 7 cm region of pleomorphic calcifications in lateral breast |
Large mass in lateral breast |
Large enhancing mass |
Extensive DCIS | Large mass in upper outer quadrant |
Enhancing irregular mass in upper outer quadrant |
| 11 | Left | 3.6 cm lobular mass in superior breast |
3.6 cm lobular mass |
Enhancing 3.6 cm lobular mass |
Invasive lobular carcinoma |
Lobulated mass in upper breast |
Enhancing lobulated mass in upper breast |
| 12 | Right | Post-biopsy changes. Calcifications in superior and lateral breast |
Post-biopsy changes |
Post-biopsy changes |
DCIS at margins of post-biopsy cavity |
Post-biopsy changes |
Post-biopsy changes |
| 13 | Left | Small mass in upper outer quadrant |
Mass in lateral breast |
10 × 9 mm enhancing mass in lateral breast |
Invasive ductal carcinoma with DCIS |
Biopsy clip | Small focus of faint enhancement adjacent to biopsy clip |
Figure 1.
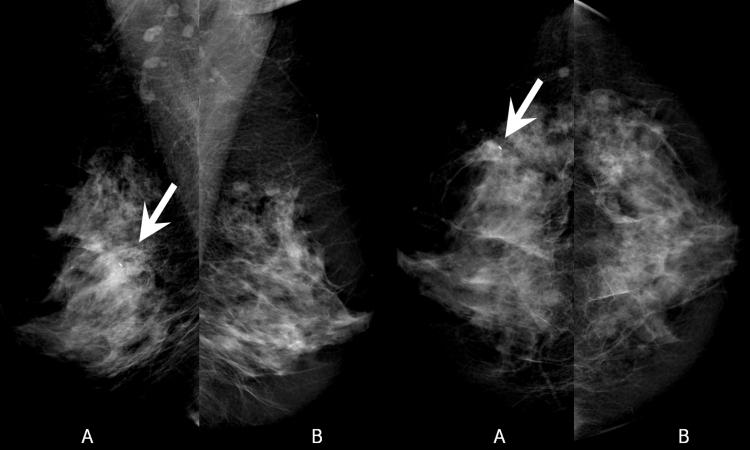
Digital Mammogram (A-left, B-right)
In the left breast, there is a 9 mm cluster of calcifications inferoposterior to a clip from prior core biopsy (arrow). Just anterior to this cluster there is a focal asymmetry related to the recent biopsy. Right breast provided for comparison.
Figure 3.
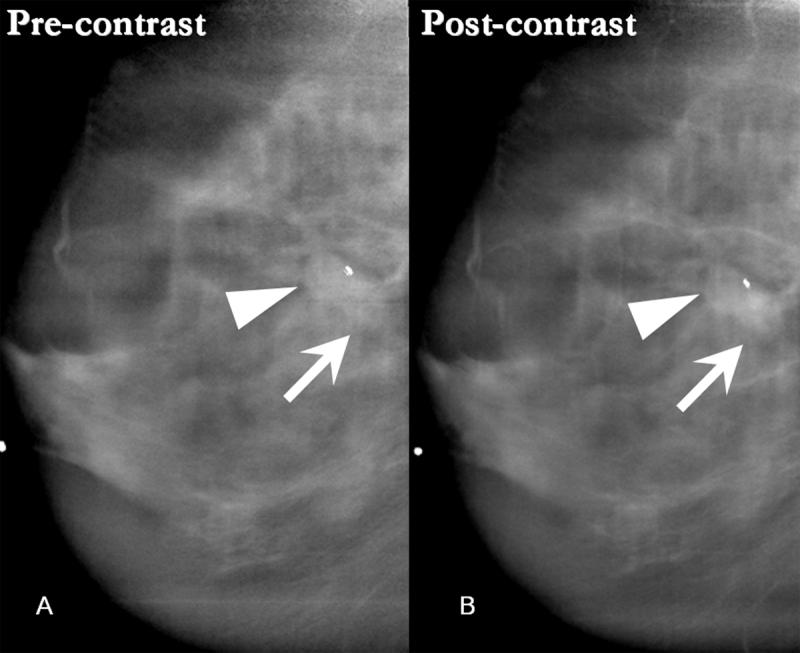
- 3A: Inferoanterior to the biopsy clip, pre-contrast DBT demonstrates a density that is more conspicuous than on the digital mammogram (arrowhead). The cluster of calcifications identified on the digital mammogram is not well demonstrated here due to motion (arrow).
- 3B: Reconstructed post-contrast DBT images display an enhancing mass posterior to and separate from the density seen on pre-contrast images (arrow). This enhancing mass corresponds in location to the cluster of calcifications on mammography. The appearance corresponds to findings on breast MR (Figure 2), which demonstrates an enhancing suspicious mass adjacent to and separate from a non-enhancing post-biopsy hematoma (arrowhead).
Figure 4.
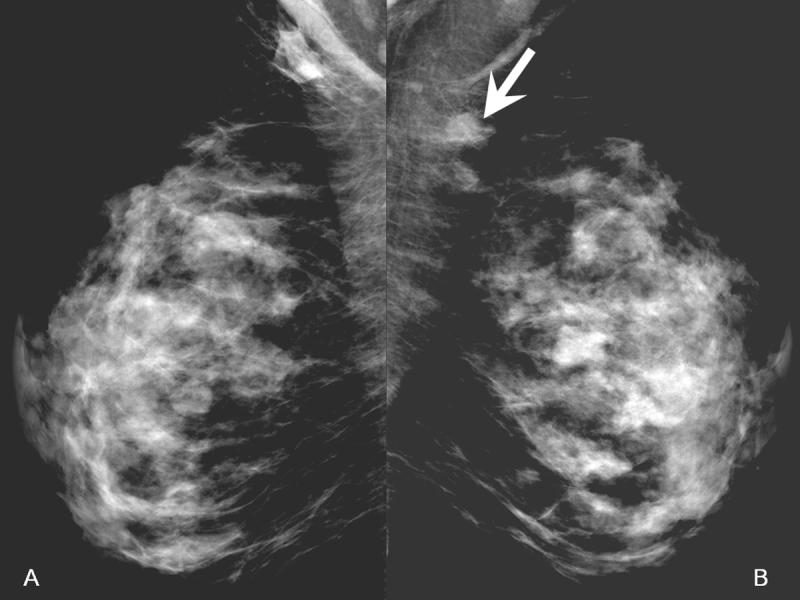
Digital Mammogram (A-left, B-right)
In the right breast, there is a 1.4 cm ill-defined focal asymmetry overlying the pectoralis muscle (arrow). Left breast provided for comparison.
Figure 6.
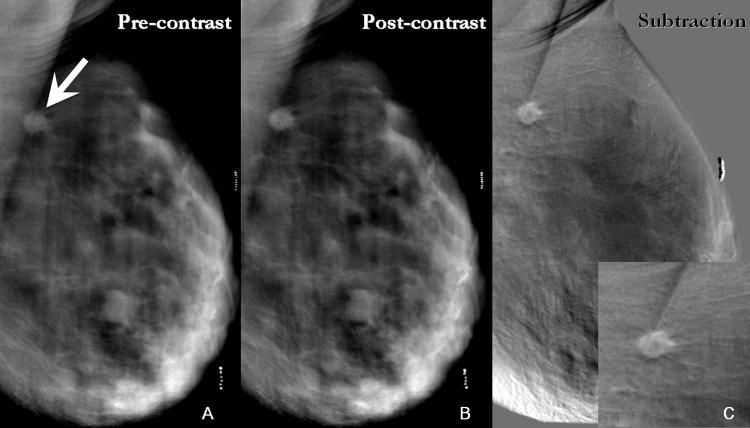
- 6A: Pre-contrast DBT demonstrates a spiculated mass in the upper right breast projecting over the pectoralis muscle and corresponding to the location of the focal asymmetry on the digital mammogram (arrow). The spiculated margins of the mass are more apparent on the reconstructed tomosynthesis images than on the digital mammogram.
- 6B: This spiculated mass displays avid non-ionic contrast enhancement on CE-DBT.
- 6C: Subtracted reconstructed CE-DBT image highlights this enhancing, spiculated mass (zoomed image included). Highly suspicious rim-enhancement is also seen on this subtraction image.
DISCUSSION
SUMMARY
The cases presented above illustrate that CE-DBT can be applied to the evaluation of malignant and benign breast lesions, and provide information in concordance with multimodality imaging evaluation. Table 1 displays multimodality imaging results of each patient's lesion. The pre- and post-contrast tomosynthesis images provide localization of breast lesions in concordance with digital mammography. The pre-contrast tomosynthesis images also demonstrate lesion morphology and border characteristics, often in greater detail than the digital mammography images (Cases 1, 5, 11). The CE-DBT data sets demonstrate vascular characteristics of the breast lesions of interest that are consistent with the vascular information provided by MR (all cases). For example, post-biopsy collections can be distinguished from residual cancers (Cases 1, 4, 7).
Technical advantages to CE-DBT include a relatively favorable radiation dose, with each CE-DBT data set of 9 images obtained at a mean glandular dose comparable to two conventional mammographic views. Also, whereas in conventional mammography compression serves the dual purposes of immobilization and splaying of breast tissue to decrease breast thickness, in CE-DBT compression is for immobilization only. Thus less compressive force can be used, decreasing the possibility of altering breast vascular dynamics during contrast injection.
RATIONALE FOR TECHNICAL PARAMETERS
The MLO view was used in our series as more breast tissue can be visualized in this projection. The adequacy of single projection (MLO) DBT has been preliminarily addressed in a screening population (23). When CE-DBT is applied in a diagnostic fashion as an adjunct to digital mammography (as in this case series), the inclusion of the maximum amount of breast tissue should theoretically maximize the yield for multicentric cancer. However, other views are amenable to this technique.
In this case series, reconstruction of pre-and post-contrast data sets with registration for patient motion (using metallic markers as reference points) was found to be visually optimal for image viewing. Also, displaying subtracted images averaged into 5 mm slices at 1 mm increments was found to reduce the x-ray quantum noise, improving the diagnostic quality.
FUTURE DIRECTIONS FOR TECHNICAL OPTIMIZATION
Despite detailed patient instructions and careful compression technique, even small amounts of motion during image acquisition can affect image reconstruction and subtraction. This artifact may arise from the patient or from motion of the x-ray source that occurs during CE-DBT acquisition. Post-processing motion-correction algorithms were used to address this effect partially; metallic markers were placed on the breast in this study to aid in post-processing registration of images. It was noted that more motion occurs in the inferior aspect of the breast in our early series. The observed motion was complex and rigid registration provided adequate but non-ideal correction. Refining the reconstruction algorithm to minimize motion artifacts and increase visualization of calcifications remains a challenging future task.
Decreasing the acquisition time of both the entire data series and of each individual image are other ways to minimize patient motion. Data series acquisition time can be addressed by developing a motorized system and ensuring fast detector response. In addition, the decreased acquisition time achieved with an automated system will decrease the time of compression, improving patient tolerance. Decreasing individual image acquisition time depends on the generator, x-ray tube, and filtration used.
Altering acquisition time would change the timepoints at which post-contrast images would be obtained; this may have some effect on the observation of enhancement kinetics. Currently, the long post-contrast DBT acquisition time is necessary to allow for manual manipulation of the tube angle as well as for tube and generator heating concerns. While better time resolution might be desirable, this is not thought to be a concern as the time interval used in this case series corresponds to that established by MR for vascular enhancement kinetics (24-28). The timing and number of image acquisitions remains to be optimized. Of note, given the relatively low dose, multiple data sets at multiple timepoints using a dedicated system is possible.
Contrast delivery technique is another factor that may impact the vascular information provided by CE-DBT. In the current series, manual injection was performed. Potential benefits of power injection may include a more consistent and focused contrast bolus, with resultant shorter injection times. Thus if power injection is used, this would alter the timing of post-contrast image acquisition.
Even without optimization of the post-contrast temporal sequence of imaging, qualitative vascular enhancement information was gleaned from CE-DBT (all cases). Subtraction images generated from the reconstructed tomographic images provide localization and morphology of contrast enhancement.
These subtraction images generated from the source projection images hold the potential for quantitative enhancement information. However, quantization of iodine enhancement kinetics is complex. The absolute concentration of iodinated contrast that results in visually perceptible enhancement on subtracted images is actually very dilute, corresponding to less than a 5% increase in x-ray attenuation. The measurement of this small signal difference requires very stable x-ray tube output and detector response. With the equipment used in this case series, the detector is completely exposed to radiation only on the 0° views. As the x-ray tube is positioned at different angles, different regions of the detector remain unexposed to radiation. This may cause inconsistent temporal response from the detector secondary to lag and ghosting, thus impacting quantitative measurements. Also, as scatter in the breast varies as a function of tube angle, inaccuracies in quantitative measurements may occur (19). These remain technical factors to refine.
Finally, future research avenues include applying a dual-energy approach or a combination of dual-energy and temporal approaches to data acquisition.
CLINICAL CONTEXT
Vascular neoangiogenesis is one feature of breast malignancies that has been exploited by gadolinium-enhanced breast MR for breast cancer detection and breast lesion characterization. X-ray techniques (17, 29) and contrast agents can also utilize this property of breast cancers for lesion detection and characterization. Preliminary reports by Jong et al (12), Lewin et al (13), and Diekmann et al (12) describing the use of non-ionic contrast-enhanced digital mammography as an adjunct to conventional mammography have demonstrated that enhancement of breast cancer can be detected using this technique. In addition to increased tissue contrast resolution with digital detectors, digital mammography also provides a platform for post-processing subtraction of images to maximize post-contrast lesion conspicuity.
In the Jong et al (12) study, the temporally based approach also provided some information about lesion enhancement kinetics. However, it is important to note that in that study the breast was held in compression during contrast injection. The authors state that only light compression was used in an attempt to minimize any effect compression may have had on blood flow. However, less compression results in an increased breast thickness, which only exacerbates the obscuring effect of superimposed tissue on projection views. In fact, the authors note that even with contrast enhancement, sensitivity of lesion detection is decreased by superimposition of breast tissue on projection mammographic views, particularly for smaller lesions in denser breasts.
Dual-energy contrast-enhanced digital mammography as described by Lewin et al (13) circumvents the issue of compression altering breast vascular dynamics, because in that study the contrast injection was performed with the breast out of compression. However, post-contrast images were only obtained at one timepoint, and therefore information about lesion enhancement kinetics could not be obtained. Also, limitations from superimposition of breast tissue remain, as projection mammography views were obtained.
Combining DBT, a technique which attempts to increase lesion conspicuity and enhance lesion morphology by minimizing the superimposition of non-adjacent breast tissues, and temporally-based contrast-enhanced digital mammography into a single technique may provide the benefits of both approaches and thus provide breast lesion morphologic and vascular information.
PRACTICAL APPLICATIONS
Though many factors still require optimization, the initial clinical application of CE-DBT appears feasible and to date has provided morphologic and qualitative vascular information concordant with other breast imaging modalities. Used in a diagnostic fashion as an adjunct to mammography, the application of contrast-enhanced digital breast tomosynthesis to breast lesion evaluation may be a potential alternative tool for breast lesion morphologic and vascular characterization.
Figure 2.
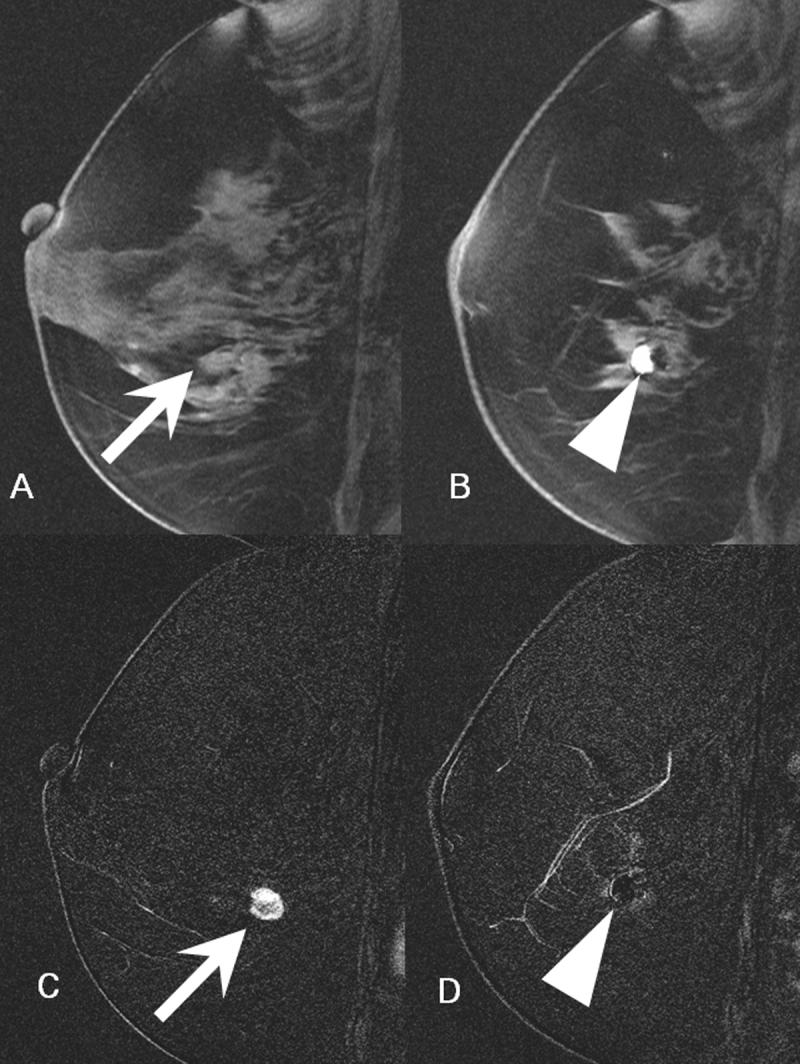
- 2A: In the location of the cluster of calcifications identified on digital mammogram, there is a 1.1 cm mass that is isointense to glandular tissue (arrow).
- 2B: 5 mm laterally, there is an approximately 1 cm ovoid region of high signal focus representing a post-biopsy hematoma (arrowhead). The focal region of low signal intensity posterior to this hematoma represents the artifact from a titanium clip.
- 2C: Subtracted image through the mass seen in figure 2A demonstrates avid enhancement (arrow). There is a suspicious area of nodular rim-enhancement. Pathology demonstrated infiltrating ductal carcinoma.
- 2D. Subtracted image through the area of the post-biopsy hematoma demonstrates no enhancement (arrowhead).
Figure 5.
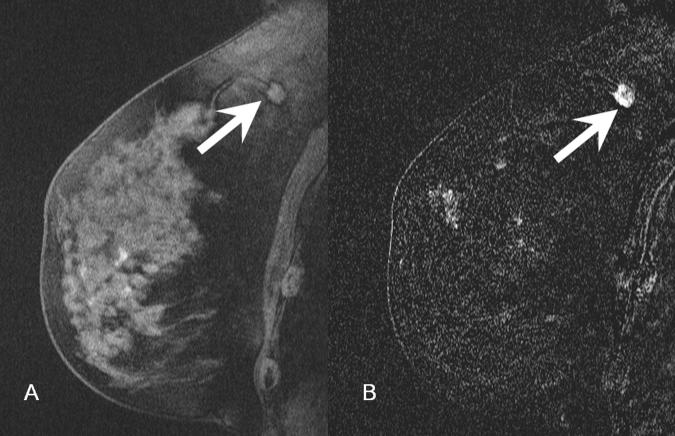
- 5A: Pre-contrast T1-weighted fat suppressed image demonstrates a spiculated mass in the superior right breast (arrow), corresponding to the asymmetry seen on digital mammogram.
- 5B: Post-contrast subtracted image of the mass demonstrates avid enhancement consistent with malignancy (arrow). Pathology demonstrated a 1.2 cm infiltrating ductal carcinoma.
Acknowledgements
General Electric Medical Systems and Mr. Vincent Polkus (technical assistance).
Footnotes
Publisher's Disclaimer: This is a PDF file of an unedited manuscript that has been accepted for publication. As a service to our customers we are providing this early version of the manuscript. The manuscript will undergo copyediting, typesetting, and review of the resulting proof before it is published in its final citable form. Please note that during the production process errors may be discovered which could affect the content, and all legal disclaimers that apply to the journal pertain.
Grant Information:
National Cancer Institute grant PO1-CA85484 RSNA Seed Grant SD0529
REFERENCES
- 1.Weidner N, Semple JP, Welch WR, et al. Tumor angiogenesis and metastasis: correlation in invasive breast carcinoma. New England Journal of Medicine. 1991;324:1–8. doi: 10.1056/NEJM199101033240101. [DOI] [PubMed] [Google Scholar]
- 2.Boetes C, Barentsz JO, Mus RD, et al. MR characterization of suspicious breast lesions with a gadolinium-enhanced TurboFLASH subtraction technique. Radiology. 1994;193:777–781. doi: 10.1148/radiology.193.3.7972823. [DOI] [PubMed] [Google Scholar]
- 3.Kaiser WA, Zeitler E. MR imaging of the breast: fast imaging sequences with and without Gd-DTPA. Preliminary observations. Radiology. 1989;170:681–686. doi: 10.1148/radiology.170.3.2916021. [DOI] [PubMed] [Google Scholar]
- 4.Mussurakis S, Buckley DL, Bowsley S, et al. Dynamic contrast-enhanced magnetic resonance imaging of the breast combined with pharmacokinetic analysis of gadolinium-DTPA uptake in the diagnosis of local recurrence of early stage breast carcinoma. Investigative Radiology. 1995;30:650–662. doi: 10.1097/00004424-199511000-00005. [DOI] [PubMed] [Google Scholar]
- 5.Sardanelli F, Rescinito G, Giordano GD, et al. MR dynamic enhancement of breast lesions: high temporal resolution during the first-minute versus eight-minute study. Journal of Computed Assisted Tomography. 2000;24:724–731. doi: 10.1097/00004728-200009000-00011. [DOI] [PubMed] [Google Scholar]
- 6.Ackerman LV, Watt AC, Shetty P, et al. Breast lesions examined by digital angiography. Work in progress. Radiology. 1985;155:65–68. doi: 10.1148/radiology.155.1.3883425. [DOI] [PubMed] [Google Scholar]
- 7.Watt AC, Ackerman LV, Windham JP, et al. Breast lesions: differential diagnosis using digital subtraction angiography. Radiology. 1986;159:39–42. doi: 10.1148/radiology.159.1.3513251. [DOI] [PubMed] [Google Scholar]
- 8.Chang J, Nesbit DE, Fisher DR, et al. Computed tomographic mammography using a conventional body scanner. Am J Roentgenol. 1982;138:553–558. doi: 10.2214/ajr.138.3.553. [DOI] [PubMed] [Google Scholar]
- 9.Sibala JL, Chang J, Lin F, et al. Computed tomographic mammography. Arch Surg. 1981;116:114–117. doi: 10.1001/archsurg.1981.01380130090020. [DOI] [PubMed] [Google Scholar]
- 10.Lindfors K, Boone J, Nelson T, et al. Initial Clinical Evaluation of Breast Computed Tomography; RSNA 91st Scientific Assembly and Annual Meeting; Chicago. November 27 - December 2, 2005. [Google Scholar]
- 11.Yamamoto A, Fukushima H, Okamura R. Dynamic Helical CT Mammography of Breast Cancer. Radiation Medicine. 2006;24:35–40. doi: 10.1007/BF02489987. [DOI] [PubMed] [Google Scholar]
- 12.Jong RA, Yaffe MJ, Skarpathiotakis M, et al. Contrast-enhanced digital mammography: Initial clinical experience. Radiology. 2003;228:842–850. doi: 10.1148/radiol.2283020961. [DOI] [PubMed] [Google Scholar]
- 13.Lewin JM, Isaacs PK, Vance V, et al. Dual-energy contrast-enhanced digital subtraction mammography: Feasibility. Radiology. 2003;264:261–268. doi: 10.1148/radiol.2291021276. [DOI] [PubMed] [Google Scholar]
- 14.Diekmann F, Diekmann S, Jeunehomme F, et al. Digital mammography using iodine-based contrast media: Initial clinical experience with dynamic contrast medium enhancement. Invest Radiol. 2005;40:397–404. doi: 10.1097/01.rli.0000167421.83203.4e. [DOI] [PubMed] [Google Scholar]
- 15.Rafferty EA. Tomosynthesis: New weapon in breast cancer fight. Decisions in imaging economics. 2004;17 http://www.imagingeconomics.com/library/200404-12.asp (accessed on April 17, 2006)
- 16.American College of Radiology (ACR) ACR Breast Imaging Reporting and Data System, Breast Imaging Atlas. 4th Edition American College of Radiology; Reston, VA: 2003. BI-RADS® - Mammography. [Google Scholar]
- 17.Skarpathiotakis M, Yaffe MJ, Bloomquist AK, et al. Development of contrast digital mammography. Medical Physics. 2002;29:2419–2426. doi: 10.1118/1.1510128. [DOI] [PubMed] [Google Scholar]
- 18.Niklason LT, Christian BT, Niklason LE, et al. Digital tomosynthesis in breast imaging. Radiology. 1997;205:399–406. doi: 10.1148/radiology.205.2.9356620. [DOI] [PubMed] [Google Scholar]
- 19.Carton A-K, Li J, Albert M, Chen S, et al. Quantification for contrast-enhanced digital breast tomosynthesis. In: Flynn MJ, Hsieh J, editors. Medical Imaging 2006: Physics of Medical Imaging. San Diego: 2006. pp. 111–121. [Google Scholar]
- 20.Boone JM. Normalized glandular dose (DgN) coefficients for arbitrary x-ray spectra in mammography: Computer-fit values of Monte Carlo derived data. Medical Physics. 2002;29:869–875. doi: 10.1118/1.1472499. [DOI] [PubMed] [Google Scholar]
- 21.Boone JM, Fewell TR, Jennings RJ. Molybdenum, rhodium, and tungsten anode spectral models using interpolating polynomials with application to mammography. Medical Physics. 1997;24:1863–1874. doi: 10.1118/1.598100. [DOI] [PubMed] [Google Scholar]
- 22.Maidment ADA, Albert M, Thunberg S, et al. In: Evaluation of a Photon-Counting Breast Tomosynthesis Imaging System. Flynn MJ, editor. SPIE; San Diego, CA: 2005. pp. 572–582. (SPIE, Bellingham, WA, 2005) [Google Scholar]
- 23.Rafferty EA, Kopans DB, Wu T, et al. Breast tomosynthesis: Will a single view do?; RSNA 90th Scientific Assembly and Annual Meeting; Chicago. November 28 - December 3, 2004. [Google Scholar]
- 24.Stack JP, Redmond OM, Codd MB, et al. Breast disease: tissue characterization with Gd-DTPA enhancement profiles. Radiology. 1990;174:491–494. doi: 10.1148/radiology.174.2.2296657. [DOI] [PubMed] [Google Scholar]
- 25.Flickinger FW, Allison JD, Sherry RM, et al. Differentiation of benign from malignant breast masses by time-intensity evaluation of contrast enhanced MRI. Magn Reson Imaging. 1993;11:617–620. doi: 10.1016/0730-725x(93)90002-u. [DOI] [PubMed] [Google Scholar]
- 26.Buckley DL, Mussurakis S, Horsman A. Effect of temporal resolution on the diagnostic efficacy of contrast-enhanced MRI in the conservatively treated breast. J Comput Assist Tomogr. 1998;22:47–51. doi: 10.1097/00004728-199801000-00008. [DOI] [PubMed] [Google Scholar]
- 27.Kuhl CK, Mielcareck P, Klaschik S, et al. Dynamic breast MR imaging: are signal intensity time course data useful for differential diagnosis of enhancing lesions? Radiology. 1999;211:101–110. doi: 10.1148/radiology.211.1.r99ap38101. [DOI] [PubMed] [Google Scholar]
- 28.Hylton N. Vascularity assessment of breast lesions with gadolinium-enhanced MR imaging. Magnetic Resonance Imaging Clinics of North America. 2001;9:321–332. [PubMed] [Google Scholar]
- 29.Marx C, Facius M, Muller S, et al. Contrast enhanced digital mammography (CEDM): Phantom experiment and first clinical results. In: Antonuk LE, Yaffe LE, editors. Medical imaging 2002: physics of medical imaging. SPIE; San Diego: 2002. pp. 174–181. [Google Scholar]


