

Abstract
Previously we cloned and mapped a B120 gene to human chromosome 1p35-36.1 where possible suppressor genes for various neuroendocrine tumors including neuroblastoma have been mapped. Very recently, B120 was identified as a truncated form of p270, a putative human counterpart of SWI1. In the present study, expression of the B120 gene product was immunohistochemically investigated in 23 neuroblastomas. We also examined B120 expression in neural stem cells in developing brain and intact adrenal medulla. Four of 23 neuroblastomas strongly expressed B120 gene product in both cytoplasm and nucleus. The other neuroblastomas expressed B120 gene product in the nucleus; however, the intensity of staining was much weaker and equivalent to that in developing human brain stem cells in the subventricular region. B120 gene product was less strongly expressed in intact adrenal medulla. Subsequently, we performed loss of heterozygosity studies on 19 neuroblastomas using the polymorphic markers D1S195 and D1S511 located near the B120 gene. Loss of heterozygosity was observed in three of 19 tumors that abundantly expressed B120 protein. Furthermore, neuroblastoma cells were transfected with B120 expression vector. These transfected neuroblastoma cells adhered to each other and aggregated. Differential display experiments followed by reverse transcriptase-polymerase chain reaction and Northern blot analysis were performed and three molecules with altered expression in B120-transfected neuroblastoma cells were identified. One of three genes seemed to be a proliferation-related and cell cycle-related nucleolar protein, p120, encoding gene. We further characterized the genomic structure of B120. B120 appeared to be encoded by 17 exons in more than 20-kbp genomic DNA. The present findings contribute to understanding of the B120 gene, a truncated form of human SWII1, an approved term for which is SMARCF1, in normal cells and neuroblastomas.
We previously reported a novel human gene designated B120, which was strongly expressed in neural cells, muscles, and thymus. 1 The deduced amino acid sequence of B120 included a novel DNA-binding region, termed ARID (AT-rich interactive domain). We also mapped the B120 gene to 1p35-36.1, 2 in which the putative tumor suppressor gene for neuroendocrine tumors including neuroblastoma is located. 3,4 Caron and colleagues 5 hypothesized that at least two tumor suppressor genes are located within 1p35-36: an imprinted distal 1p36 locus and a nonimprinted 1p35-36.1 locus. Various studies have indicated that these genes are affected in at least one third of primary neuroblastomas. 6 Surprisingly and very interestingly, the human counterpart of SWI1, termed p270, was recently identified and appeared to be partly identical to B120 cDNA. 7 However, B120 differed from p270 at the 5′ and 3′ termini and encoded a truncated form of p270 protein. 1,7 The Nomenclature Committee authorized by the Human Genome Organization recommended that we use the approved symbol SMARCF1 (SWI/SNF-related, matrix associated, actin-dependent regulator of chromatin, subfamily f, member 1) for the human counterpart of SWI1, instead of B120 and p270. The SWI/SNF complex is a 2-mDa multisubunit DNA-dependent ATPase that contributes to the regulation of gene transcription by altering chromatin structure. 8,9 An increasing number of reports have described the important roles played by the SWI/SNF complex in gene regulation, including the cell cycle and tumorigenicity. 10 Versteege and colleagues 11 found that a member of the SWI/SNF chromatin-remodeling complex (hSNF5/INI1) was mutated in aggressive pediatric cancer. Taylor and colleagues 12 also identified familial posterior fossa brain tumors, including primitive neuroectodermal tumors, with germline mutation of the hSNF5 gene. These recent findings led us to examine the expression and role of B120 protein in neuroblastoma.
Materials and Methods
Patients and Tissue Samples
The participants in this study were 23 patients with neuroblastoma who were selected by experienced pathologists and classified by clinical and pathological diagnosis. The main clinical characteristics of the relevant patients are summarized in Table 1 ▶ . Tissues from patients and spontaneously aborted fetuses were routinely formalin-fixed and embedded in paraffin. Normal adrenal glands were surgically resected from patients with renal cancer. In several cases, adrenal glands resected by autopsy were also used. The Committee of Kochi Medical School approved the protocol for this study. Tissues were routinely formalin-fixed and paraffin-embedded.
Table 1.
Stage and Sex of Patients, Semiquantitative Score of B120 Protein Expression, and LOH on the B120 Gene Region Flanked by D1S511 and D1S195 Polymorphic Marker at 1p35-36.1
| Clinical stage, number of cases (male/female) | B120 expression (male/female) | LOH at B120 gene region (male/female)* |
|---|---|---|
| Stage I, 6 cases (3/3) | Weakly, 1 case (0/1) moderately, 4 cases (2/2) markedly, 1 case (1/0) | LOH(−), 5 cases (2/3)LOH(+), 1 case (1/0) |
| II, 5 cases (3/2) | Weakly, 1 case (1/0) moderately, 4 cases (2/2) | LOH(−), 3 cases (2/1) |
| III, 4 cases (1/3) | Moderately, 2 cases (1/1) markedly, 2 cases (0/2) | LOH(−), 2 cases (1/1)LOH(+), 1 case (0/1) |
| IV, 6 cases (3/3) | Weakly, 1 case (0/1) moderately, 4 cases (2/2) markedly, 1 case (1/0) | LOH(−), 4 cases (2/2)LOH(+), 1 case (1/0) |
| IVs, 2 cases (1/1) | Moderately, 2 cases (1/1) | LOH(−), 2 cases (1/1) |
*Four cases were not available for LOH analysis.
Immunohistochemical Staining
Details of the procedures used including the characterization of a monoclonal antibody to B120 protein termed 39-7-7, were previously described. 1 Briefly, we immunized mice with recombinant gene product that was produced in Escherichia coli cells using the T7 polymerase-dependent expression system, as described by Studier and Moffatt. 13 We produced a recombinant protein of ∼600 bp from B120 cDNA in E. coli cells. This recombinant protein, with an approximate molecular weight of 30 kd, corresponded to the C-terminal part of B120 protein. After the third immunization, the splenocytes were fused with P3X63Ag8U.1 cells. After screening, one hybridoma clone was found to produce antibody useful even in the routinely processed formalin-fixed and paraffin-embedded tissue sections. We also used isotype-matched monoclonal antibody to Trichosporon beigelli, a fungus, as a negative control. A previous study revealed that the control monoclonal antibody did not react with various human tissues. 14 The tissue sections were cut, deparaffinized, preincubated with fetal bovine serum, and incubated with 39-7-7 culture supernatant for 1 hour at room temperature. After washing with phosphate-buffered saline (PBS), the sections were stained using a streptavidin-biotin complex peroxidase kit (DAKO LSAB kit; Dakopatts, Tokyo, Japan). The procedures were performed according to the manufacturer’s protocol. Finally, reaction was developed with diaminobenzidine. The tissue sections were counterstained with hematoxylin or methyl green. Based on the number of positively stained neuroblastoma cells, the immunohistochemical staining was semiquantitatively scored as weakly positive (>5 to 20%), moderately positive (>20 to 80%), or markedly positive (>80%).
Cells and Cell Culture
Three neuroblastoma cell lines, IMR-32, TGW, and NH-12, were purchased from the Japan Health Science Research Resources Bank (Osaka, Japan) and cultured in Dulbecco’s modified Eagle’s medium supplemented with 10% heat-inactivated fetal bovine serum (Cell Culture Laboratories, Cleveland, OH) and 50 μg/ml gentamicin (Life Technologies, Grand Island, NY). Previous reports from other laboratories revealed the N-myc amplication in IMR-32 and TGW cells. 15,16
Western Immunoblotting
Immunoblotting was performed essentially according to the method of Towbin and colleagues. 17 The procedure was described in detail previously. Briefly, cultured cells or tissues were homogenized in a lysis buffer (20 mmol/L Tris-HCl, pH 7.4, containing 0.5% Nonidet P-40, 1 mmol/L phenylmethyl sulfonyl fluoride, 5 μg/ml aprotinin). The protein concentration of each lysate was determined and used to load an equal amount of protein per well (5μ g/well) of a sodium dodecyl sulfate (SDS)-polyacrylamide gel. These separated proteins were transferred to Immobilon polyvinylidene difluoride sheets (Millipore Corp., Bedford, MA). The membrane was blocked with PBS and 10% horse serum, incubated with monoclonal antibodies, followed by incubation with goat F(ab′)2 anti-mouse immunoglobulins conjugated with peroxidase (Biosource International, Camarillo, CA). We used isotype-matched monoclonal antibody as a negative control. Finally, the reaction was developed with diaminobenzidine.
Screening and Characterization of Genomic DNA Clones
The screening was performed on a human genomic P1 library obtained from Genome Systems by polymerase chain reaction (PCR) with previously reported primers K1 to K6 1 using an long and accurate (LA) PCR kit (Takara Shuzo, Ohtsu, Japan). PCR conditions were previously reported. 1 Briefly, genomic P1 clones were amplified by an initial denaturation step of 5 minutes at 95°C followed by 30 cycles of two-step PCR (20 seconds at 98°C and 5 minutes at 68°C) in the presence of 1.5 mmol/L of MgCl2. Positive P1 clones were isolated and subcloned into pBluescript SKII (Stratagene, La Jolla, CA). Synthetic oligonucleotides were used to sequence both strands of double-stranded plasmid DNA with an Automated Laser Fluorescent ALF sequencer (Pharmacia LKB Biotechnology AB, Uppsala, Sweden). The sizes of the introns were determined either by sequencing or by long-range PCR using a LA-PCR kit according to the manufacturer’s instructions. We also confirmed genomic DNA structure from healthy volunteers by long-range PCR using synthesized primers.
Radiation Hybrid Mapping
The whole radiation hybrid GeneBridge 4 panel (GB4) was used (Research Genetics, Inc., Huntsville, Alabama). It is composed of 93 human-on-hamster somatic cell lines. 18 We performed PCR with K1 to K6 primers as described above. PCR products were electrophoresed on 1.5% agarose ET-Br gels. The PCR reaction was performed twice. The logarithm odds (LOD) scores were processed with the RHMAPPER program on the Whitehead Institute/MIT center server (URL: http://www-genome.wi.mit.edu/cgi-bin/contig/rhmapper.pl), with a required LOD score for linkage equal to 15. 19
Loss of Heterozygosity (LOH) Analysis
DNA was extracted from both the tumor-rich and tumor-free areas of tissue sections using the Pinpoint Slide DNA Isolation System (Zymo Research, Orange, CA) in accordance with the manufacturer’s protocol. We selected tumor-rich specimens in which the proportion of neuroblastoma cells in the tumor component was estimated to be at least 80%. Extracted DNA was examined for genetic alterations using the polymorphic markers D1S511 and D1S195. Both markers contain (CA)n repeats around the B120 gene locus. D1S511 and D1S195 were amplified with primer sets of 5′-tctaatttttcagcaagtgccacag-3′ (sense) and 5′-cagtgagccaagattgtgccaatgc-3′ (antisense); 5′-taaagaggaaaggtggacggtggg-3′ (sense) and 5′-attcctcttgagcatcaccccagc-3′ (antisense), respectively. For each primer pair, a sense primer only was fluorescently labeled at the 5′ end. Template genomic DNAs (100 ng) were amplified by PCR using a thermal cycler (Takara Co. Ltd., Ohtsu, Japan) in a volume of 50 μl containing 1.5 mmol/L of Mg Cl2, 200 μmol/L of each dNTP, 50 pmol of each primer, and 2.5 U of Taq polymerase (Perkin Elmer, Norwalk, CT). The PCR consisted of 1) initial denaturation and activation of Taq polymerase at 95°C for 2 minutes; 2) 30 cycles of 95°C for 30 seconds, 58°C (D1S195) or 60°C (D1S511) for 45 seconds, and 72°C for 60 seconds. PCR products were run and analyzed using an automated fluorescent DNA sequencer on a 6% polyacrylamide denaturing gel. Allele ratios were calculated as principally described by Cawkwell and colleagues. 20 Because incomplete losses are commonly observed and may reflect either normal cell contamination or tumor heterogeneity, a ratio of ≤0.50 was considered indicative of LOH.
Expression Plasmids and Stable Transfection
The construction and stable transfection of a pCI-neo expression vector containing the B120 cDNA (pCI-neo-B120) was previously reported. 1,2 Briefly, a human B120 full-length cDNA was prepared and transfected into IMR-32, TGW, and NH-12 cells using DOTAP transfection reagent (Boehringer Mannheim GmbH, Mannheim, Germany) in accordance with the manufacture’s protocol. As a negative control, the pCI-neo expression vector alone was introduced into cells in parallel. Permanent B120-transfected and pCI-neo expression vector alone-transfected cell lines were established after G418 selection (Sigma, St. Louis, MO) and maintained with the medium as used for the original cell lines.
Differential Display of mRNA (DDRT-PCR) and Subsequent RT-PCR
Total RNAs were extracted from B120-transfected and control vector alone-transfected IMR-32 neuroblastoma cells. Then RNAs were treated with DNase I for 10 minutes at 37°C. One μg of each RNA was reverse-transcribed with 200 U of Superscript II reverse transcriptase (Life Technologies, Inc.) in the presence of 50 pmol of T12MN primers, where M represents A, C, or G and N is T, A, C, or G, in 20 μl of RT buffer (25 mmol/L Tris, pH 8.3, 37.5 mmol/L KCl, 1.5 mmol/L MgCl2, 10 mmol/L dithiothreitol, 20 μmol/L dNTP). After heat inactivation of the reverse transcriptase at 95°C for 5 minutes, subsequent PCR amplification was performed using one-tenth of the cDNA with 50 pmol of the appropriate T12MN primer in combination with 10 pmol of arbitrary 10-mer primer. The PCR reaction was performed with 2 U of Taq polymerase and 0.075 μl [α-32P]dATP (1,000 Ci/mmol) in 20 μl of PCR buffer (10 mmol/L Tris, pH 8.3, 50 mmol/L KCl, 1.5 mmol/L MgC12, 2 μmol/L dNTP). The cycling parameters were as follows: 94°C for 4 minutes, and then 40 cycles of denaturation (94°C for 30 seconds), annealing (42°C for 2 minutes), and elongation (72°C for 30 seconds), followed by a 72°C elongation step for 7 minutes. The amplified cDNAs were separated on a 6% sequencing gel. Differentially displayed cDNAs were excised from dried sequencing gel, boiled in 100 μl of distilled water for 15 minutes, precipitated with ethanol, and suspended in 10 μl of water. After re-amplification by PCR with the identical primer set, amplified PCR products were subcloned into pGEM-T Easy vector (Promega Corporation, Madison, WI). Finally, the PCR products in pGEM-T easy plasmid were transfected into JM109, and sequenced. We detected three partial DNAs with increased expression in B120-transfected cells. To determine whether these genes were more strongly expressed in B120-transfected neuroblastoma cells than in control cells, we performed reverse transcriptase (RT)-PCR. Total cellular RNA was prepared from cells using RNA-zol B (Biotex Laboratory, Houston, TX). We used 1 μg of each total RNA as substrate for cDNA synthesis with the RT-PCR kit (Life Technologies, Gaithersburg, MD). The cDNA synthesis and following PCR was performed according to the manufacture’s instructions. RT-PCR detection of mRNAs of p120, B120ind1, and B120ind2 was performed using the newly synthesized primer sets as follows below: 5′-cggaccaatacccttgaaaacccgacgc-3′ and 5′-cgctcagcattggcgtcattggcaag-3′ for p120 gene. 5′-cat-gagttcatgaaaagatattaggg-3′ and 5′-gagctgagggctagccag-ggagg-3′ for B120ind1. 5′-ccctgacagcctgtactgctgggtccag- 3′ and 5′-ggcaataccgggtaacctattaggcc-3′ for B120ind2. We also used G3PDH primers, 5′-tccaccaccctgttgctgta-3′ and 5′-accacagtccatgccatcac-3′.
Northern Blot Analysis
Multiple-tissue Northern blots (Clontech, Palo Alto, CA) were screened with an ∼1-kb cDNA fragment spanning the 3′ terminus of the coding sequence for B120 (nucleotides 3-kb to 4-kb). The probe was radiolabeled with [α-32P]dCTP by random-primed labeling kits (Boehringer Mannheim). Membranes were washed in 2× standard saline citrate (SSC)/0.1% SDS at 55°C, and then with 0.1× SSC/0.1% SDS at 55°C. We also examined p120 gene expression in B120-transfected neuroblastoma cells by Northern blot. Briefly, 20 μg of total RNA from TGW neuroblastoma cells transfected with pCI-neo-B120 or pCI-neo alone were loaded onto a denatured agarose gel. A PCR-amplified p120 cDNA that covered the coding region was radiolabeled and used as a probe. Membranes were washed in 2× SSC/0.1% SDS at 55°C, and then with 0.1× SSC/0.1% SDS at 60°C.
Results
Immunohistochemical Staining
We immunostained tissues from patients with neuroblastoma, intact adrenal gland, and human developing brain. Neuroprogenitor cells in fetal germinal zone at 17 and 18 weeks demonstrated staining by anti-B120 monoclonal antibody (Figure 1A) ▶ .
Figure 1.

Immunohistochemical staining with 39-7-7 antibody, which was generated and specifically reacted with a the C-terminal part of B120 protein, in human developing brain (A) and intact adrenal medulla (B). Immunohistochemical staining of developing precentral gyrus of cerebrum at 17 weeks, the neuroprogenitor cells in the germinal zone at subventricular area (sub) was stained by 39-7-7. Migrating neural cells in the intermediate layer (int) were not stained by 39-7-7 antibody. The pericytoplasmic region in pheochromocytes in intact adrenal gland medulla was also stained, but not as strongly by 39-7-7 antibody. Original magnifications: ×100 (A), ×400 (B).
Neural cells migrating to the cortex in the intermediate zone were not significantly stained by anti-B120 antibody. In normal adrenal gland medulla, staining was less strongly observed (Figure 1B) ▶ . Although these normal cells were composed of heterogenetic clones, the semiquantitative score was equivalent to weakly positive for all normal tissues examined. In contrast to these normal counterparts, four of 23 neuroblastomas tested exhibited intense staining (scored as markedly positive) in both nucleus and cytoplasm by anti-B120 antibody (Figure 2A) ▶ ; however, no significant reactivity was observed with control isotype-matched monoclonal antibody (Figure 2B) ▶ . The staining intensities of 16 and three specimens tested were semiquantitatively scored as, respectively, moderate (>20 to 80%) and weak (>5 to ∼20) positive. Staining in these 19 cases was restricted to the nucleus, as shown in Figure 2C ▶ . The staining results were not related to patient’s age and sex. The results are also summarized in Table 1 ▶ .
Figure 2.
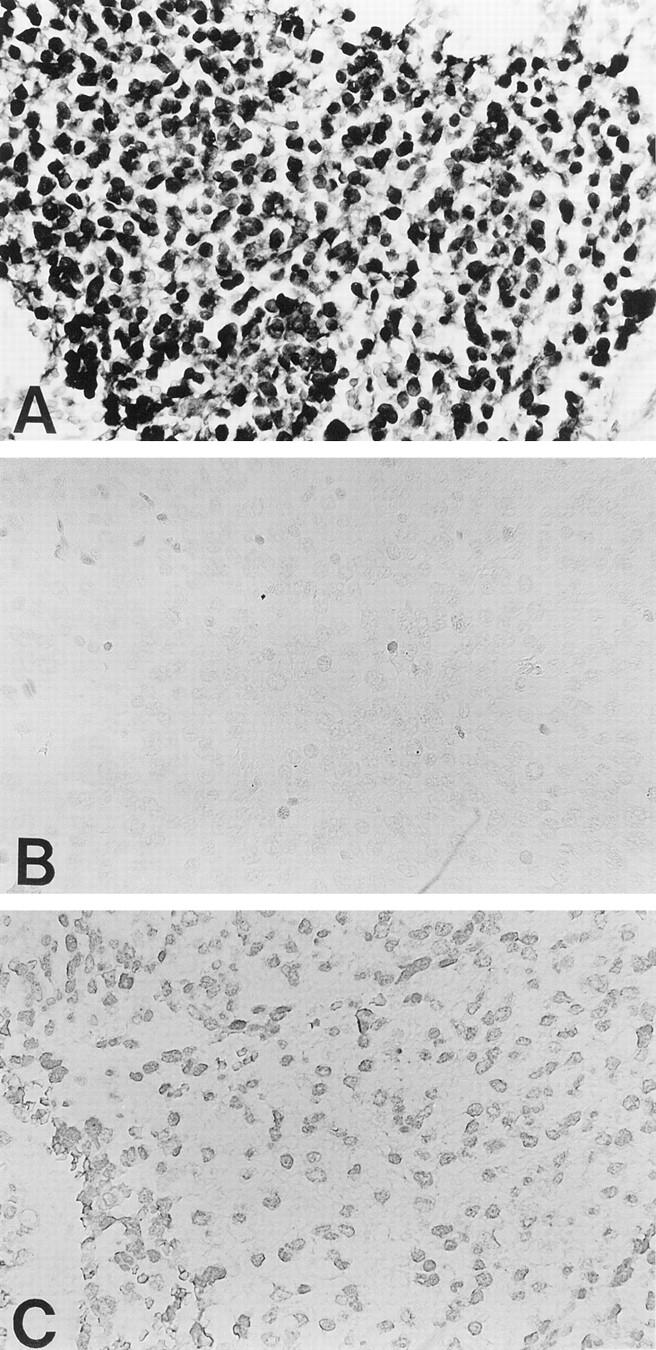
Neuroblastoma cells were strongly stained by 39-7-7 (A) but not with control isotype-matched monoclonal antibody (B). Not only the nucleus of neuroblastoma cells but also the cytoplasm were strongly stained by 39-7-7 (A). Representative moderately positive staining of neuroblastomas with 39-7-7 antibody (C). Original magnifications, ×400.
Western Immunoblotting
We also performed immunoblotting to determine whether neuroblastoma cells expressed the B120 molecule. A single band with a molecular weight of ∼120 kd was observed in the Nonidet P-40 soluble fraction of IMR-32 neuroblastoma cells as demonstrated in Figure 3 ▶ (lane D). As expected, a similar but stronger band was observed for B120-transfected IMR-32 cells (lane B). However, no significant reactivity was observed in Nonidet P-40-extracted human developing brain at 17 or 18 weeks with the 39-7-7 antibody (lanes A and C, respectively). No significant band was observed with control isotype-matched antibody in IMR-32 cells (lane E).
Figure 3.

Western blot analysis of the 0.5% solubilized fraction of IMR-32 neuroblastoma cells and fetal brain with 39-7-7 antibody and control antibody. A: Fetal-developing brain extracts at 17 weeks. B: B120-transfected IMR-32 cells. C: Fetal-developing brain extracts at 18 weeks. D and E: IMR-32 cells. Lanes A, B, C, and D were reacted with 39-7-7. Lane E was reacted with control antibody. A single band with an approximate molecular weight of 120 kd was detected in the IMR-32 neuroblastoma cells with 39-7-7 antibody (lane D). In contrast, no band was observed with isotype-matched control antibody (lane E). A single strong band with an approximate molecular weight of 120 kd was also detected in B120-transfected IMR-32 cells with 39-7-7 antibody (lane B). No significant band was observed in fetal developing brain extracts at 17 and 18 weeks (lanes A and C, respectively).
Radiation Hybrid Mapping
The B120 gene was previously localized by a fluorescence in situ hybridization study to 1p35-p36.1. To determine more precisely the position of the B120 gene, we performed radiation hybrid mapping. The B120 gene was localized at 1.71 cR from WI-9232 on chromosome 1p. It is flanked by the polymorphic markers D1S511 and D1S195, corresponding to a 8-cM interval.
LOH Analysis
Four of 23 samples were not analyzed in this study. Two cases were not informative and two other cases could not be investigated for inadequacy of extracted DNA. LOH at both D1S511 and D1S195 regions was detected in three B120-overexpressed neuroblastoma specimens (Figure 4) ▶ . In contrast, LOH at neither the D1S511 nor the D1S195 region was found in 14 neuroblastomas in which the staining score was moderately to weakly positive and staining signals with anti-B120 antibody were restricted to the nucleus. LOH was not detected at one of two markers in the other two non-B120 overexpressed neuroblastomas; however, another marker was not informative by homozygous. We considered these two neuroblastomas as LOH (−) in this study. These results were also summarized in Table 1 ▶ .
Figure 4.

Representative examples of a clonal deletion of D1S511 and D1S195 region in a B120-overexpressing neuroblastoma (broken lines). For comparison, the genotypes derived from tumor-free areas of an identical patient are superimposed (solid lines).
Determination of B120 Genomic Structure
Three P1 DNA fragments were characterized by screening. One of the three was found to have the full-length genomic structure of B120 by PCR with the 5′- or 3′-terminal region. The other two were found to have a shorter genomic structure. Comparison with the B120 cDNA confirmed the sequence and showed that the B120 gene contains 17 exons (GenBank accession numbers: AB024059-75), as illustrated in Figure 5 ▶ . The DNA sequence of the intron-exon boundaries of the B120 gene is shown in Table 2 ▶ . We also confirmed the B120 genomic structure using genomic DNA obtained from healthy volunteers with primers for intron-exon junctions.
Figure 5.

Structure of B120 gene. The DNA sequences of the intron-exon boundaries are demonstrated in Table 1 ▶ .
Table 2.
DNA Sequence of the Intron-Exon Boundaries of B120 Gene
| (Exon 1) tatacacagcag-gtagatggtgattgt------tttcctttcacacag-attcctccttatgga |
| (Exon 2) cctccaccgcag-gtaagatatccctgc-----tttttcttgttgtag-gagctatctcaagat |
| (Exon 3) tccagcttgcct-gtgagtatttctgca-----atatatatgttctag-gatctatctggttca |
| (Exon 4) tgcagtgccag-gtaccctcaagtgct-----ttgtctggagcag-gcaaccagatgcca |
| (Exon 5) ccaagatcgag-gtgagagcctgggt-----acccacaaatag-gttatatgcagagga |
| (Exon 6) tggcccacaag-gtcagtatactaccc-----ctcccctcccag-gtggctaccccaggc |
| (Exon 7) tccaaaacag-gtaaggcctgggaag-----catcttcttccttag-gccgccaggctacc |
| (Exon 8) aattctgcag-gtaagtgctagtcat-----ttttctcttttacag-ggatggcagccagcc |
| (Exon 9) aaatccaag-gtagtgatttttgtc-----tgaaccttccag-aaatccagttcttctac |
| (Exon 10) attgactcag-gtgagtgggcgcct-----ttggttatacag-gtcaacaagaacaaaa |
| (Exon 11) cctctcctg-gtaaggatggggtca-----tctgtccacag-cgggatcaggatctatg |
| (Exon 12) ggcatgag-gtaaggccaagagca-----ttcactctggag-caggagcaattcagttg |
| (Exon 13) gaggaaag-gtgactgatctgatt-----ttctacgctcag-ctccagggagtgatccct |
| (Exon 14) agagtgag-gtaagcatgacccca-----aattttgtttag-gacggagcctggaatagg |
| (Exon 15) cagcaacg-gtgagtaaagcctgg-----cctcctatag-acatgattcctatgg caatc |
| (Exon 16) caacagcag-gtgaggagggtagct-----ctctgccttag-aattacaagcggccaatgg |
| Exon 17 |
Transfection of B120 with expression vector into neuroblastoma cell lines TGW, IMR-32, and NH-12 cells were successfully transfected with pCI-neo-B120 after G418 selection. Control pCI-neo alone-transfected cells exhibited no morphological changes (Figure 6A) ▶ . B120-transfected cells adhered to each other and formed small clusters, as demonstrated in Figure 6B ▶ . At the time of passage, these B120-transfected cells were separated from each other using trypsin; however, ∼6 hours later, cells were again adherent to each other and forming small clusters. Twenty-four hours after trypsinization, small clusters of B120-transfected cells were further adhering to other clusters to form larger clusters. These clusters were not completely round or oval and were spike-shaped on their surfaces.
Figure 6.
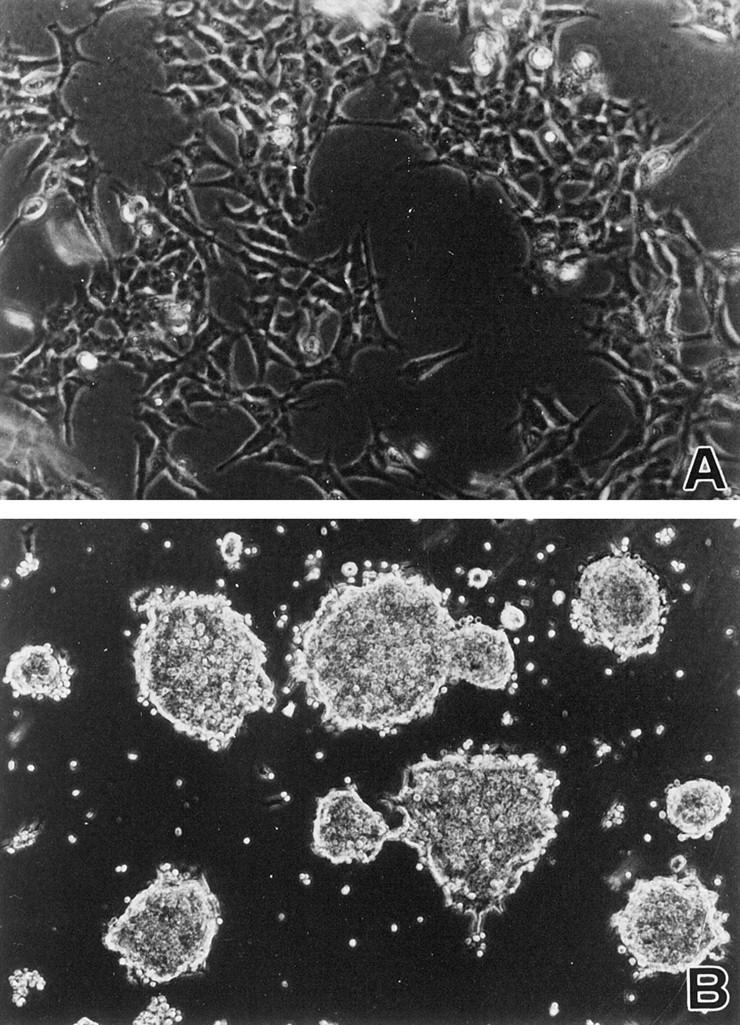
Transfection of B120 cDNA with expression vector into IMR-32 neuroblastoma cells. B120-transfected IMR-32 neuroblastoma cells adhered to each other and formed small clusters (B). In contrast, no significant change was observed in control plasmid alone-transfected IMR-32 cells (A).
Differential Display of mRNA (DDRT-PCR), Subsequent RT-PCR, and Northern Blot Analysis
We detected several bands indicating overexpression of the respective genes in B120-transfected IMR-32 cells. Interestingly, we found no significant bands representing differentially down-regulated after ectopic B120 expression. Finally, three representative partial cDNAs were sequenced. A BLAST homology search revealed that one of the three is identical to a previously reported p120 nucleolar protein encoding cDNA. The other two appeared to be novel genes, and were temporarily designated B120ind1 and B120ind2 (GenBank accession numbers. AB032363 and AB032364, respectively). Very recently, B120ind1 and B120ind2 were found apparently to be a part of Homo sapiens clones RP11-56A1 and chromosome 5 clone CTB-11I22 (GenBank accession numbers: AC007482 and AC011376), respectively. Both RP11-56A1 and CTB-11I22 clones were sequenced by the Human Genome Project without any functional study. Primer sets were synthesized as described in Materials and Methods to detect each mRNA in transfected or original cells. RT-PCR demonstrated that these three genes were expressed more strongly in B120-transfected TGW cells than in the original cells (Figures 7 and 8) ▶ ▶ . In our experimental conditions, we detected B120ind1 and B120ind2 bands in B120-transfected cells after, respectively, 30 and 20 cycles. However, even after 30 cycles we detected no bands with B120ind1 and B120ind2 primer sets from control pCI-neo alone-transfected cells (Figure 8) ▶ . The difference in p120 gene expression between the original and B120-transfected cells was relatively small (Figure 7) ▶ . We detected p120 bands after 15 cycles and 25 cycles in B120-transfected and control cells, respectively. Northern blot analysis also confirmed that B120-transfected TGW cells expressed much more p120 than pCI-neo-alone transfected cells.
Figure 7.

RT-PCR and Northern blot of B120-transfected TGW neuroblastoma cells. Top: The plasmid alone-transfected TGW cells were applied to RT-PCR (lane 1, 10× cycles; lane 2, 15× cycles; lane 3, ×25 cycles of PCR after RT reaction) with p120 or G3PDH primer sets. B120-transfected cells were also examined by RT-PCR (lane 4, 10× cycles; lane 5, 15× cycles; lane 6, 25× cycles of PCR after RT reaction). Overexpression of p120 in B120-transfected TGW cells was demonstrated by RT-PCR. Note the even intensity of internal control bands of G3PDH in both B120-transfected and plasmid alone-transfected TGW cells. Bottom: Northern blot analysis of plasmid alone-transfected and B120-transfected TGW cells (lanes 1 and 2, respectively). Northern blot analysis also demonstrated the overexpression of p120 gene in B120-transfected cells. Note the even intensity of G3PDH band in lanes 1 and 2.
Figure 8.
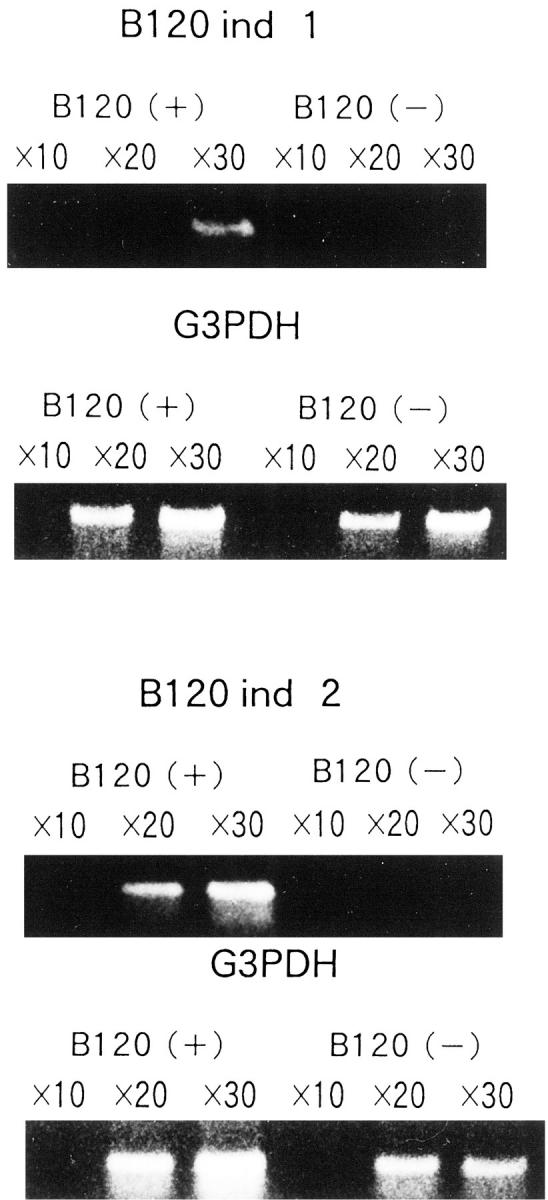
RT-PCR analysis of B120-transfected TGW neuroblastoma cells to examine the overexpression of B120ind1 and B120ind2. Overexpression of B120ind1 and B120ind2 genes in B120-transfected TGW cells. 10×, 20×, and 30× indicate PCR cycles followed by RT reaction. Note the even intensity of internal control bands of G3PDH in both B120-transfected and plasmid alone-transfected TGW cells.
mRNA Expression in Various Human Tissues
The results are demonstrated in Figure 9 ▶ . A RNA species migrating at ∼8.0 kbp was detected in almost all tissues examined. In addition, we observed other bands at ∼5 kbp and 4 kbp in human brain. This 5-kb RNA band was also detected in spleen, thymus, prostate, and colon.
Figure 9.

Northern blot analysis of B120 mRNA in various tissues. A: Heart (lane 1), brain (lane 2), placenta (lane 3), lung (lane 4), liver (lane 5), skeletal muscle (lane 6), kidney (lane 7), and pancreas (lane 8). B: Spleen (lane 1), thymus (lane 2), prostate (lane 3), testis (lane 4), ovary (lane 5), small intestine (lane 6), colon (lane 7), and peripheral blood lymphocytes (lane 8). Each lane contained ∼2 μg of poly A+ RNA. Blots were probed with an ∼1-kb cDNA corresponding to the 3′ terminus of the B120 mRNA.
Discussion
B120 was first recognized in a search for genes containing multiple CAG repeats. 1 The B120 gene was subsequently localized to 1p35-36.1, 2 in which a putative tumor suppressor gene for neuroendocrine tumors including neuroblastomas is located. 4 We previously transfected C3H/10T1/2 fibroblastic cells with B120 expression vector and observed abundant cytoplasmic lipid deposits and a tiny nucleolus. 3 It seemed unlikely that B120 protein was directly involved in lipid metabolism, because the deduced amino acid sequence for B120 exhibited no significant homology with previously identified enzymes involved in lipid metabolism. We speculated that the B120 molecule might act as a transcriptional factor and increase or induce the expression of other genes involved in lipid metabolism and organization of the tiny nucleolus. 2 Notably, B120-transfected fibroblastic cells did not aggregate with each other, as did B120-transfected neuroblastoma cells in the present study. The abundant lipid deposits found in B120-transfected fibroblastic cells were not observed in B120-transfected neuroblastoma cells.
Very recently, Dallas and colleagues 7 identified human SWI/SNF complex protein p270. Surprisingly p270, a putative human counterpart of SWI1, had an identical portion of B120 cDNA product. The Human Gene Nomenclature Committee recommended an approved symbol SMARCF1 (SWI/SNF-related, matrix-associated, actin-dependent regulator of chromatin, subfamily f, member 1) for the human counterpart of SWI1. The SWI/SNF complex plays fundamental roles in the regulation of gene expression during cell growth, the cell cycle, and development in various organs. 21 Moreover, Versteege and colleagues 11 found that a member of the SWI/SNF chromatin remodeling complex, the hSNF encoding gene, was mutated in aggressive pediatric malignant rhabdoid tumors. Very recently, Taylor and colleagues 12 also found germline mutation of the hSNF gene in a family afflicted over multiple generations with posterior fossa tumors of infancy, including the central nervous system (a subset of primitive neuroectodermal tumors).
In the present study, we observed abundant expression of the B120 gene product in neuroblastomas which exhibited LOH in the B120 gene region flanked by D1S511 and D1S195 polymorphic marker containing a (CA)n repeat (Figures 2 and 4) ▶ ▶ . Both the cytoplasm and nucleus demonstrated strong positive reaction with anti-B120 monoclonal antibody in these cases, as demonstrated in Figure 2A ▶ . We also detected staining in fetal neural stem cells in the germinal zone; however, the staining intensity of normal neuroprogenitor cells was equal to those semiquantitatively scored as weakly positive and staining was restricted to the nucleus (Figure 1) ▶ . Interestingly, positive signals of B120 staining in non-B120-overexpressing neuroblastomas was also restricted to the nucleus and much weaker than that in B-120-overexpressing neuroblastomas (Figure 2C) ▶ . LOH of the B120 gene region, ie, D1S511 and/or D1S195, was not found in the non-B120-overexpressing neuroblastomas tested.
Although we could not directly unravel the B120 gene alteration in B-120 overexpressing neuroblastomas, we speculated the mutated B120 protein accumulated in the cytoplasm and nucleus. Because several exons of the B120 gene were not amplified from paraffin-embedded tissues, further study using freshly isolated materials might clarify whether and how the B120 mutation occurred in neuroblastomas. We also examined the sequences of all 17 exons of B120 (Figure 5) ▶ in IMR-32, TGW, and NH-12 neuroblastoma cells; however, no mutation was detected in these cells (data not shown). Ectopic B120-transfected IMR-32, TGW, and NH-12 neuroblastoma cells adhered to each other and formed clusters, as described above (Figure 6B) ▶ . We further identified three genes expressed in the B120-transfected neuroblastoma cells (Figures 7 and 8) ▶ ▶ . One of three appeared to be identical to human p120 gene. The other two genes were novel and designated as B120ind1 and B120ind2 (B120-induced gene 1 and 2, respectively). p120 was first identified as proliferation-related nucleolar protein, which is detectable early in the G1 phase of the cell cycle and peaks early in the S phase. 22 Most human malignant tumors contain much higher levels of protein p120 than normal resting cells. 22 Although the function of p120 is still unclear, yeast Nop2p, which has substantial homology with human p120, is a nucleolar protein that plays an essential role in the maintenance of nucleolar structure. 23 We have been unable to determine the entire sequence of the other two genes, B120ind1 and B120ind2. As demonstrated in Figure 8 ▶ , both B120ind1 and B120ind2 were induced in B120-transfected neuroblastoma cells. Thus, ectopic B120 protein expression in neuroblastoma cells increased or induced the expression of other molecules including p120 nucleolar proliferation-related antigen and affected the morphology of these neuroblastoma cells. Interestingly, we detected no significant bands indicating down-regulation in B120-transfected neuroblastoma cells. Consistent with this observation, the Drosophila osa (also termed eyelid) protein, which has strong homology with p270 and is a component of the Drosophila counterpart of SWI/SNF, seemed to promote the activation of specific genes. 24
The monoclonal antibody to B120 protein used in this study was previously generated by immunizing mice with the C-terminal portion of B120 molecule. The C-terminus of B120 cDNA product has amino acids different from those of p270, the human homologue of SWI1 (SMARCF1). We re-examined mRNA expression of B120 gene in various human organs by Northern blotting, as demonstrated in Figure 9 ▶ .
In the present study, we used a cDNA probe including the 3′ terminus, which is different from that of p270. Several mRNA products were observed in human brain. The 8.0-kb RNA band observed may correspond to previously identified p270 mRNA. 1,7 However, we observed the additional bands in brain, placenta, and lymphoid tissues. B120 cDNA contained ∼4.5 kb and may be responsible for the 5-kb band. We also detected a 5-kbp band in human spleen, thymus, and peripheral lymphocytes (Figure 9B) ▶ . As demonstrated in Figure 3, a ▶ single band of 120 kd was detected in both original and B120-transfected neuroblastoma cells. Notably, the extraction buffer used in this study, 0.5% Nonidet P-40, did not solubilize cell nuclei. Therefore, it may not be surprising that we detected no significant band in the fetal developing brain. As demonstrated in Figure 1, A and B ▶ , immunohistochemical staining with anti-B120 antibody was restricted to the nucleus of subventricular neuroprogenitor cells. Based on the above findings, we concluded that B120 is a natural truncated form of p270, the human homologue of SWI1 (SMARCF1). Very recently, we constructed a pEGFP (eukaryotic green fluorescent protein)-B120 vector to synthesize recombinant EGFP-B120 protein and found that fluorescent signal was not always confined to the nucleus but could also be found in the cytoplasm of several tumor cell lines (data not shown).
Our findings together with previous data suggested the hypothesis that the putative mutation of B120 gene in neuroblastomas, which represented LOH in the B120 gene region, might contribute to the long turnover of B120 gene product. It is also likely that aberrant B120 expression may induce expression of other proliferation-related genes in neuroblastoma cells. Because we found no mutation in the 17 exons of B120 in IMR-32, TGW, and NH-12 neuroblastoma cells, B120 may be not directly linked to initial tumorigenesis of neuroblastomas. However, it is possible that neuroblastomas with genomic instability undergo an unbalanced loss of B120 gene during progression. Interestingly, a recent completed retrospective study of uniformly treated Children’s Cancer Group patients indicated that 1p LOH may identify patients with low- or intermediate-risk features who are more likely to suffer disease relapse. 25 Investigation of a large number of cases is needed to determine whether and how B120 is involved in the tumorigenesis or biological behavior of neuroblastomas. The promoter region of B120 gene should also be determined. (Primer sets to amplify each of the 17 exons including intron-borderline are now available from us by direct request.)
Acknowledgments
We thank Dr. Hiroyuki Kato (Laboratory of Biochemistry and Molecular Biology, The Rockefeller University, NY) for valuable discussion.
Footnotes
Address reprint requests to Tamotsu Takeuchi, M.D., Department of Pathology, Kochi Medical School, Okochou, Nankoku, Kochi 783-8505, Japan. E-mail: takeutit@med.kochi-ms.ac.jp.
Supported by grants from the Ministries of Education of Japan and the Medical Research Fund of Kochi Medical School; and by grants from the Académie Nationale de Médecine and, subsequently, the Association Française Contre les Myopathies (to S. N.).
References
- 1.Takeuchi T, Chen B, Qiu Y, Sonobe H, Ohtsuki Y: Molecular cloning and expression of a novel human cDNA containing CAG repeats. Gene 1997, 204:71-77 [DOI] [PubMed] [Google Scholar]
- 2.Takeuchi T, Furihata M, Heng HH, Sonobe H, Ohtsuki Y: Chromosomal mapping and expression of the human B120 gene. Gene 1998, 213:189-193 [DOI] [PubMed] [Google Scholar]
- 3.Jensen SJ, Sulman EP, Maris JM, Matise TC, Vojita PJ, Barrett JC, Brodeur GM, White PS: An integrated transcript map of human chromosome 1p35–p36. Genomics 1997, 42:126-136 [DOI] [PubMed] [Google Scholar]
- 4.Schwab M, Praml C, Amler L: Genomic instability in 1p and human malignancies. Genes Chromosom Cancer 1996, 16:211-229 [DOI] [PubMed] [Google Scholar]
- 5.Caron H, Peter M, van Sluis P, Speleman F, de Kraker J, Laureys G, Michon J, Brugieres L, Voute PA, Westerveld A: Evidence for two tumour suppressor loci on chromosomal bands 1p35-36 involved in neuroblastoma: one probably imprinted, another associated with N-myc amplification. Hum Mol Genet 1995, 4:535-539 [DOI] [PubMed] [Google Scholar]
- 6.Maris JM, Matthay KK: Molecular biology of neuroblastoma. J Clin Oncol 1999, 17:2264-2279 [DOI] [PubMed] [Google Scholar]
- 7.Dallas PB, Pacchione S, Wilsker D, Bowrin V, Kobayashi R, Moran E: The human SWI-SNF complex protein p270 is an ARID family member with non-sequence-specific DNA binding activity. Mol Cell Biol 2000, 20:3137-3146 [DOI] [PMC free article] [PubMed] [Google Scholar]
- 8.Cairns BR: Chromatin remodeling machines: similar motors, ulterior motives. Trends Biochem Sci 1998, 23:20-25 [DOI] [PubMed] [Google Scholar]
- 9.Pugh BF: Mechanisms of transcription complex assembly. Curr Opin Cell Biol 1996, 8:303-311 [DOI] [PubMed] [Google Scholar]
- 10.Sevenet N, Lellouch-Tubiana A, Schofield D, Hoang-Xuan K, Gessler M, Birnbaum D, Jeanpierre C, Jouvet A, Delattre O: Spectrum of hSNF5/INI1 somatic mutations in human cancer and genotype-phenotype correlations. Hum Mol Genet 1999, 8:2359-2368 [DOI] [PubMed] [Google Scholar]
- 11.Versteege I, Sevenet N, Lange J, Rousseau-Merck MF, Ambros P, Handgretinger R, Aurias A, Delattre O: Truncating mutations of hSNF5/INI1 in aggressive paediatric cancer. Nature 1998, 394:203-206 [DOI] [PubMed] [Google Scholar]
- 12.Taylor MD, Gokgoz N, Andrulis IL, Mainprize TG, Drake JM, Rutka JT: Familial posterior fossa brain tumors of infancy secondary to germline mutation of the hSNF5 gene. Am J Hum Genet 2000, 66:1403-1406 [DOI] [PMC free article] [PubMed] [Google Scholar]
- 13.Studier FW, Moffatt BA: Use of bacteriophage T7 RNA polymerase to direct selective high-level expression of cloned genes. J Mol Biol 1986, 189:113-130 [DOI] [PubMed] [Google Scholar]
- 14.Takeuchi T, Kobayashi M, Moriki T, Miyoshi I: Application of a monoclonal antibody for the detection of Trichosporon beigelii in paraffin-embedded tissue sections. J Pathol 1988, 156:23-27 [DOI] [PubMed] [Google Scholar]
- 15.Shiloh Y, Shipley J, Brodeur GM, Bruns G, Korf B, Donlon T, Schreck RR, Seeger R, Sakai K, Latt SA: Differential amplification, assembly, and relocation of multiple DNA sequences in human neuroblastomas and neuroblastoma cell lines. Proc Natl Acad Sci USA 1985, 82:3761-3765 [DOI] [PMC free article] [PubMed] [Google Scholar]
- 16.Kato H, Okamura K, Kurosawa Y, Kishikawa T, Hashimoto K: Characterization of DNA rearrangements of N-myc gene amplification in three neuroblastoma cell lines by pulsed-field gel electrophoresis. FEBS Lett 1989, 250:529-535 [DOI] [PubMed] [Google Scholar]
- 17.Towbin H, Staehelin T, Gordon J: Electrophoretic transfer of proteins from polyacrylamide gels to nitrocellulose sheets: procedure and some applications. Proc Natl Acad Sci USA 1979, 76:4350-4354 [DOI] [PMC free article] [PubMed] [Google Scholar]
- 18.Gyapay G, Schmitt K, Fizames C, Jones H, Vega-Czarny N, Spillett D, Muselet D, Prud’Homme, J-F, Dib C, Auffray C, Morissette J, Weissenbach J, Goodfellow PN: A radiation hybrid map of the human genome. Hum Mol Genet 1996, 5:339–346 [DOI] [PubMed]
- 19.Slonim D, Kruglyak L, Stein L, Lander E: Building human genome maps with radiation hybrids. J Comput Biol 1997, 4:487-504 [DOI] [PubMed] [Google Scholar]
- 20.Cawkwell L, Bell SM, Lewis FA, Dixon MF, Taylor GR, Quirke P: Rapid detection of allele loss in colorectal tumours using microsatellites and fluorescent DNA technology. Br J Cancer 1993, 67:1262-1267 [DOI] [PMC free article] [PubMed] [Google Scholar]
- 21.Muchardt C, Yaniv M: The mammalian SWI/SNF complex and the control of cell growth. Semin Cell Dev Biol 1999, 10:189-195 [DOI] [PubMed] [Google Scholar]
- 22.Ochs RL, Reilly MT, Freeman JW, Busch H: Intranucleolar localization of human proliferating cell nucleolar antigen p120. Cancer Res 1988, 15:6523-6529 [PubMed] [Google Scholar]
- 23.de Beus E, Brockenbrough JS, Hong B, Aris JP: Yeast NOP2 encodes an essential nucleolar protein with homology to a human proliferation marker. J Cell Biol 1994, 127:1799-1813 [DOI] [PMC free article] [PubMed] [Google Scholar]
- 24.Collins RT, Furukawa T, Tanese N, Treisman JE: Osa associates with the Brahma chromatin remodeling complex and promotes the activation of some target genes. EMBO J 1999, 18:7029-7040 [DOI] [PMC free article] [PubMed] [Google Scholar]
- 25.Maris JM, Weiss MJ, Guo C, Gerbing RB, Stram DO, White PS, Hogarty MD, Sulman EP, Thompson PM, Lukens JN, Matthay KK, Seeger RC, Brodeur GM: Loss of heterozygosity at 1p36 independently predicts for disease progression but not decreased overall survival probability in neuroblastoma patients: a Children’s Cancer Group study. J Clin Oncol 2000, 18:1888-1899 [DOI] [PubMed] [Google Scholar]