

Abstract
An acidic extracellular pH is a fundamental property of the malignant phenotype. In von Hippel-Lindau (VHL)-defective tumors the cell surface transmembrane carbonic anhydrase (CA) CA9 and CA12 genes are overexpressed because of the absence of pVHL. We hypothesized that these enzymes might be involved in maintaining the extracellular acidic pH in tumors, thereby providing a conducive environment for tumor growth and spread. Using Northern blot analysis and immunostaining with specific antibodies we analyzed the expression of CA9 and CA12 genes and their products in a large sample of cancer cell lines, fresh and archival tumor specimens, and normal human tissues. Expression was also analyzed in cultured cells under hypoxic conditions. Expression of CA IX and CA XII in normal adult tissues was detected only in highly specialized cells and for most tissues their expression did not overlap. Analysis of RNA samples isolated from 87 cancer cell lines and 18 tumors revealed high-to-moderate levels of expression of CA9 and CA12 in multiple cancers. Immunohistochemistry revealed high-to-moderate expression of these enzymes in various normal tissues and multiple common epithelial tumor types. The immunostaining was seen predominantly on the cell surface membrane. The expression of both genes was markedly induced under hypoxic conditions in tumors and cultured tumor cells. We conclude that the cell surface trans-membrane carbonic anhydrases CA IX and CA XII are overexpressed in many tumors suggesting that this is a common feature of cancer cells that may be required for tumor progression. These enzymes may contribute to the tumor microenvironment by maintaining extracellular acidic pH and helping cancer cells grow and metastasize. Our studies show an important causal link between hypoxia, extracellular acidification, and induction or enhanced expression of these enzymes in human tumors.
The development of solid human tumors may be approximated by a two-stage model. In stage one, the malignant cells grow into small tumors, which then stop growing because of an inadequate supply of oxygen (hypoxia). In stage two, hypoxia triggers a drastic change in gene expression, followed by clonal selection within the tumor cell population for cells with increased adaptation to hypoxia. 1 This leads to angiogenesis 2 and a fundamental switch in energy metabolism, replacing respiration with glycolysis. 3-5 These changes further lead to a new compromised microenvironment within and around the tumor mass, characterized by low oxygen tension, high hydrostatic pressure, and an acidic extracellular pH (pHe). 6,7 The hypoxia-inducible transcription factor (HIF1) controls the expression of several dozen target genes, including those involved in energy metabolism (glucose transporters, glycolytic enzymes), angiogenesis [vascular endothelial growth factor (VEGF) and VEGFR-1], and surface transmembrane carbonic anhydrases (CAs). 1,2,8-11 HIF1 is considered to be a master regulator gene that integrates pathways regulating physiological responses to acute and chronic hypoxia. 1,11-15 pVHL is an integral part of a novel multiprotein ubiquitin ligase complex, termed VBC (VHL/Elongin B/Elongin C), that recruits important cellular proteins for rapid degradation by the ubiquitin-proteasome proteolysis system. 16,17 The most plausible candidate targets for this proteolytic degradation include HIF1-α and HIF2-α. 8,16-18 Both HIF-α subunits are pVHL-binding proteins that are targeted by pVHL, presumably via the VBC complex, for degradation in normoxic but not hypoxic conditions. 8 Therefore, pVHL is responsible for control of the hypoxia-driven changes in gene expression in tumors, thereby initiating and augmenting the second stage of tumor development. In VHL-defective tumors, curiously enough, the two fundamental stages of tumor development occur either simultaneously or in reverse, first triggering the hypoxia-cellular response, followed by proliferation of transformed cells, consistent with the angiogenic phenotype of tumors seen in the VHL syndrome. Previously, we discovered that in VHL patients the CA9 and CA12 genes are overexpressed in tumors because of the absence of pVHL, and argued that these CA enzymes might be involved in sensing and maintaining the acidic tumor microenvironment. 10 We have now extended these observations by analyzing the expression of CA IX and CA XII in a large sample of cancer cell lines and fresh or archival tumor specimens. Here we show that either one or both genes are overexpressed in many tumor types, suggesting that this is a common feature of cancer cells, consistent with the fundamental role of VHL in tumor development. We believe that overexpression of these enzymes contributes to the acidic tumor microenvironment and helps the cancer cells to grow and metastasize.
Materials and Methods
Cancer Cell Line RNA Collection
We used 45 mRNA samples isolated from cancer cell lines provided by the Developmental Therapeutics Program, Frederick Cancer Research and Development Center, National Cancer Institute. Additional mRNA samples from central nervous system (CNS) tumor cell lines U105MG, U251MG, U373MG, and G4; leukemia cell lines U937 and HL60; the renal cell carcinoma cell line UM-RC-29; and the monocyte cell line THP-1 were kindly provided by Dr. Teizo Yoshimura (NCI-Frederick, Frederick, MD). Non-small cell carcinoma (H1373, H1264, H1693, H1944, H838, H1299, H157, H1466, H460, H727, and H28), small-cell carcinoma cell lines (H1184, H2081, H2227, H1086, H841, H69, H1820, H660, H1769, H446, H1238, H748, and H2552), cancer cell lines SCC-35, MCF-7-adr, SQ-20B, 510-HPV-18, and Scid (5020) were kindly provided by Dr. Bruce Johnson (NCI, Bethesda, MD). The human glioblastoma cell line, U87, was purchased from ATCC (Manassas, VA). RNA samples from other cancer cell lines were available on the Clontech MTN blot no. 7757-1, and samples from normal tissues on MTE Array no. 7775--1 blot (Clontech, Palo Alto, CA).
Molecular Techniques
Total RNA and mRNA isolation from cell lines and tumor tissues was done using commercially available kits (Invitrogen, Carlsbad, CA; Life Technologies, Inc., Grand Island, New York). Electrophoresis in formaldehyde gels and Northern blot analysis were performed according to published procedures. 10,19 Quantification of Northern hybridization signals was done as described previously 10 or using a VE-1000 Video Camera System (Dage-MTI, Inc., Michigan City, IN) and NIH Image Version 1.6.1 software.
Tissue Specimens
The normal adult tissues from all organ sites and the corresponding benign and/or malignant neoplastic tissues were obtained from routine pathology specimens at St. Joseph Hospital (Orange, CA). These organs include the brain (cerebrum, cerebellum, ventricle, pons, pituitary gland), eyes, nose, throat, upper and lower respiratory system, heart, upper and lower gastrointestinal system (esophagus, stomach, small and large intestine), pancreas, liver, biliary system including gallbladder, female and male urogenital system (kidney, ureter, bladder, testicle, cervix, uterus, fallopian tube, ovary), adrenal gland, thyroid, parathyroid, salivary gland, spleen, bone, muscle, cartilage, skin, and the body cavity. All tissue samples were processed within 6 hours of surgical resection and fixed in 10% neutral-buffered formalin or snap-frozen. The formalin-fixed tissues were paraffin-embedded, sectioned, and stained with hematoxylin and eosin (H&E) for light microscopic examination.
Immunohistochemical Studies
The mouse monoclonal antibody (MN75) used to detect the MN/CA IX protein and the rabbit polyclonal antibody to CA XII protein have been described previously. 20,21 Immunohistochemical staining of tissue sections with anti-CA IX and anti-CA XII antibodies was done using a peroxidase technique with microwave pretreatment, as described previously. 22 Known positive and negative tissue specimens were included in each run. For CA IX immunostaining, the primary antibody was used at a 1:10,000 dilution and the CA XII at a 1:500 dilution. The immunohistochemical results were semiquantitative based on the percentage of the positive cells seen in a total field of a single section. The pattern of staining was scored as diffuse when ≥40% of the cells stained and focal when <40% of the cells stained. A negative score was given to tissue sections that had no evidence of specific immunostaining.
pH Determination, Glucose Uptake, and Hypoxia Conditions in Cell Culture
Renal clear-cell carcinoma cell line 786-0 and its derivative, expressing the wtVHL transgene, were described earlier. 10 They were grown to confluence in Dulbecco’s modified Eagle’s medium (cat. no. 11965-084; Life Technologies, Inc.) with 10% bovine fetal serum (Sigma, St. Louis, MO). Three independent experiments on pH and glucose measurements in the media were done using a Hanna Instruments microcomputer pH meter (model HI931000) and Infinity Glucose Reagent (Sigma Diagnostics, cat. no. 18-20). U87 cell culture and maintenance of hypoxia were performed as previously described. 19
Results
Northern Blot Analysis of CA9 and CA12 in Normal/Tumor Tissues, and Tumor Cell Lines
Using MTE array blots containing 68 different mRNAs from a variety of normal adult tissues, we observed that the CA12 gene was highly expressed in kidney, colon and rectum, esophagus, brain, and the pancreas, whereas the mammary gland, bladder, uterus, trachea, and aorta showed low levels of expression. In the brain, only the corpus striatum [caudate nucleus (E2) and putamen (H2)] produced strong hybridization signals with the CA12 probe (Figure 1) ▶ . Moderate expression of CA9 was observed in a limited number of tissues that included stomach and, to an even lesser extent, heart, liver, pancreas, and salivary gland (Figure 1) ▶ . These data were consistent with hybridization results obtained with the MTN blots. In addition, low signals were also observed in brain and placenta (data not shown). We detected no significant differences in the distribution of CA12 expression in a variety of fetal tissues compared to normal adult tissues (Figure 1 ▶ , column 11; and data not shown). In the case of CA9, however, fetal lung and muscle demonstrated high levels of expression whereas adult lung and muscle were negative (data not shown).
Figure 1.
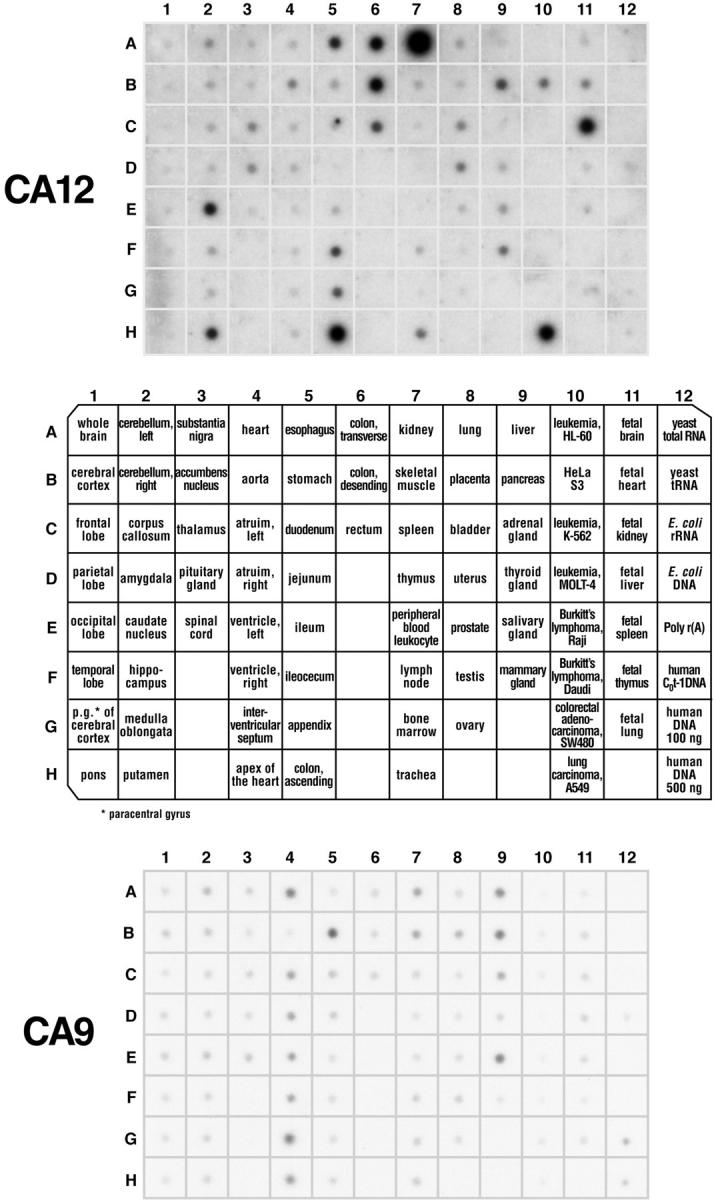
Transcription analysis of CA9/CA12 genes in normal tissues. Two identical membranes (No. 7775-1, Multiple tissue expression array; Clontech) contained human poly-A+ RNA samples extracted from 68 different normal tissues, eight cancer cell lines, and control samples of DNA and RNA. CA12 mRNA is expressed predominantly in the kidney (A7) and colon (H5), whereas CA9 is expressed mainly in the stomach (B5), liver (A9), pancreas (B9), salivary gland (E9), and heart (A4).
Northern blot analyses of mRNAs obtained from a large number of cancer cell lines and freshly excised tumors are summarized in Table 1 ▶ and Table 2 ▶ , and an example of a Northern blot is given in Figure 2 ▶ . Among 87 RNA samples, representing tumors of the head and neck, lung, kidney, cervix, ovary, prostate, breast, colon, skin, and several leukemias, 50 (57%) expressed either one or both genes at variable intensity, whereas 37 were negative (Table 1 ▶ and Figure 2 ▶ ). Non-small cell lung cancer, colon and renal cell carcinoma cell lines, and tumors of the CNS showed the highest proportion of specimens expressing CA9 or CA12 (68, 78, 89, and 78%, respectively). Fourteen of the 18 tumors (78%) of the CNS and spinal cord showed expression of the genes (Table 2) ▶ . Among these tumors 11 expressed both genes and three expressed either CA9 or CA12. It was previously shown and extensively documented in this study that expression of CA IX protein may serve as a diagnostic biomarker for clear cell renal cell carcinoma 22-24 and colorectal tumors, 25,26 whereas CA XII has been identified as a biomarker for non-small-cell lung cancer (10; US patent no. 5,589,579).
Table 1.
Expression of CA9/CA12 mRNA in Human Cancer Cell Lines
| Tumor type | CA12-positive | CA9-positive | CA9/CA12-negative |
|---|---|---|---|
| Head and Neck | not done | SCC-35(2), SQ-20B(2) | |
| Lung non-small cell carcinoma | NCI-H1264(1), NCI-J460(3), NCI-H1944(1), NCI-H157(1), NCI-H28(1), A549(10), EKVX(1), HOP62(1), HOP92(2) | NCI-H1373(1), NCI-H1264(1), NCIH1466(1), NCI-H460(1), NCI-H727(2) | NCI-H1693, NCI-H838, NCI-H1299, NCI-H226, NCI-H23, NCI-H522 |
| Lung small cell carcinoma | NCI-H2081(1), NCI-H69(1), NCI-H1769(1) | NCI-H1184, NCI-H2227, NCI-H1086, NCI-H660, NCI-H1820, NCI-H841, NCI-H446, NCI-H1238, NCI-H748, NCI-H2552 | |
| Renal clear cell carcinoma | UM-RC-6(3), UM-RC-29(2*), 786-0 (2), ACHN(1), RXF-393(3), TK-10(1) | 786-0 (3), A498(1), RXF-393(2) | CAKI-1 (VHL†), UO-31 |
| CNS tumors | U105MG(1), U373MG(2), G4(2), SF-295(1), SF-539(2), SNB75(2) | U105MG(2), U373MG(3), U251MG(2), G4(1), SF-539(1), SNB19(2), SNB75(2) | SF-268 |
| Leukemia | MOLT-4(1), K-562(1*), SR(3) | K-562(1) | HL60, U937, CCRF-CEM, Burkitt’s lymphoma Raji |
| Colon tumors | HT29(2), KM12(1) | COLO 205(2), HCC-2998(1), HCT-15(3), HT29(3), KM12(1), SW480(1) | HCT-116 |
| Cervix tumors | HeLa S3(2) | HeLa S3(2) | |
| Mammary tumors | T 47D(2) | MDA-N, MDA-MB-435, MDA-MB-231, MCF-7, NCI/ADR-RES, HS 578T | |
| Ovary tumors | OVCAR-5 (1), SK-OV-3 (2) | SK-OV-3 (1) | OVCAR-3, OVCAR-4, OVCAR-8 |
| Prostate tumors | PC-3(1) | PC-3(1) | DU-145 |
| Melanoma | MALME-3M (1) | LOX IMVI, M14, SK-MEL-2 |
Expression intensity in arbitrary units (in parentheses).
*In these cell lines truncated mRNA was observed.
VHL†, this cell line expresses active pVHL.
Table 2.
CA9/CA12 mRNA Expression in CNS and Spinal Cord Tumors, Based on Northern Blot Analysis
| Sample number | Tumor diagnosis | VHL status | CA12 expression* | CA9 expression* |
|---|---|---|---|---|
| 1 | Meningioma | wt | — | 1 |
| 2 | Anaplastic astrocytoma | wt | — | — |
| 3 | Meningioma | wt | 1 | 2 |
| 4 | Meningioma | wt | 1 | 2 |
| 5 | Glioblastoma | wt | 4 | 10 |
| 6 | Glioblastoma | wt | — | — |
| 7 | Glioblastoma | wt | — | — |
| 8 | Astrocytoma | wt | 1 | 4 |
| 9 | Glioblastoma | wt | 2 | — |
| 10 | Cerebellar hemangioblastoma | wt | — | — |
| 11 | Meningioma | wt | 1 | — |
| 12 | Hemangioblastoma | mut | 2 | 2 |
| 13 | Cerebellar hemangioblastoma (VHL-) | mut | 6 | 4 |
| 14 | Cerebellar hemangioblastoma (VHL-) | mut | 6 | 3 |
| 15 | Spinal hemangioblastoma (VHL-) | mut | 2 | 1 |
| 16 | Spinal hemangioblastoma (VHL-) | mut | 3 | 4 |
| 17 | Cerebellar hemangioblastoma (VHL-) | mut | 5 | 4 |
| 18 | Hemangioblastoma (VHL-) | mut | 5 | 6 |
*Intensity of expression is shown in arbitrary units and based on β-actin calibration.
Figure 2.

Activation of CA9 and CA12 transcription in cell lines derived from CNS and lung tumors. A typical Northern blot analysis of mRNA samples isolated from cultured cells is shown. Both probes were used together in the same hybridization experiment. Loading was monitored by staining the membranes with methylene blue 10 and hybridization with an actin probe. The data extracted from different membranes are summarized in Table 1 ▶ .
CA IX/CA XII Expression in Normal Adult Human Tissues Analyzed by Immunohistochemistry
High levels of CA IX expression were consistently observed in the basal cells in and near the infundibulum and medulla of the hair follicle, mesothelial cells, and coelomic epithelium of the body cavities. In the visceral organs, high levels of CA IX expression in the epithelium were identified but limited to rete ovarii, rete testis, ductular efferens, bile ducts, pancreatic ducts, and gallbladder. In the gastrointestinal tract, diffuse CA IX immunoreactivity was observed in the gastric mucosa, ductal cells of Brunner’s glands, and crypt cells of the duodenum, jejunum, and, to a lesser degree, in the terminal ileum and appendix. In the peripheral and central nervous systems, CA IX expression was limited to the ventricular lining cells and the choroid plexus. Interestingly, mesodermal cells of the amniotic/chorionic plate of the placenta and cartilaginous tissues from joint spaces also showed variable degrees of CA IX protein expression.
CA XII was variably expressed in mesothelial cells and the coelomic epithelium of the body cavity. In general, high levels of CA XII expression were found in certain tissues that were CA IX-negative. These tissues were the distal convoluted tubules and the intercalated cells of the collecting duct of the kidney, sweat glands of the skin, the epithelium of the breast, some of the proliferative endometrial glands, and seminal vesicles. Low levels of CA XII expression were also found focally in ductal cells and mucous cells of the salivary glands and submucosal glands of the upper respiratory system, epithelial cells of Schneider’s membrane of the nose, and acinar cells of the pancreas. Limited numbers of positive epithelial cells were also found in the prostate, vas deferens, and transitional mucosa of the renal pelvis. In the gastrointestinal tract, CA XII expression was observed, but was limited to the surface glands of the large intestine only. Very weak immunoreactivity of CA XII was also found in the gastric glands. In the peripheral and central nervous system, the CA XII immunoreactivity was restricted to the posterior lobe of the pituitary glands, remnant of Rathke’s pouch, the choroid plexus and limited numbers of ganglion cells in the cortex. In the placenta, limited numbers of syncytiotrophoblasts were immunoreactive. The only normal tissues co-expressing CA IX and CA XII were mesothelial cells, ductular efferens, and, to a lesser degree, the choroid plexus and gastric glands. A summary of the distribution of expression in normal tissues is given in Table 3 ▶ , and selected normal tissues with high expression of CA IX and/or CA XII are illustrated in Figure 3 ▶ .
Table 3.
The Distribution of CA IX and CA XII Protein Expression in Normal Adult Human Tissues
| CA IX | CA XII | |
|---|---|---|
| Lining cells of body cavity | ||
| Mesothelial cells (serous membrane) | Diffuse | Focal |
| Coelomic epithelium (surface of the ovary) | Diffuse | Focal |
| Reactive mesothelial cells | Diffuse | Diffuse |
| Underling stellate stromal cells | Focal | Focal |
| Oral cavity/upper respiratory system | ||
| Ductal and mucous cells of submucosal glands | Negative | Focal |
| Ductal cells of salivary glands | Focal | Focal |
| Mucous cells of salivary glands | Negative | Focal |
| Epithelial cells of Schneider’s membrane | Negative | Focal |
| Reactive reserve cells of respiratory epithelium | Rare | Rare |
| Lower respiratory system | ||
| Reactive reserve cells of respiratory epithelium | Rare | Rare |
| Gastrointestinal system | ||
| Gastric pits | Focal | Negative |
| Gastric fundus/pyloric glands | Diffuse | Focal |
| Ductal cells of the Brunner’s glands of the duodenum | Diffuse | Negative |
| Crypt cells of duodenum, small intestine, appendix | Diffuse/Focal | Negative |
| Crypt cells of large intestine | Rare | Negative |
| Surface glandular cells of large intestine | Negative | Focal |
| Pancreas | ||
| Ductal cells | Focal | Negative |
| Acinar cells | Negative | Focal |
| Gallbladder/biliary tract | Diffuse | Negative |
| Genito-urinary system | ||
| Kidney | ||
| Distal convoluted ducts | Negative | Diffuse |
| Intercalated cells of the collecting duct | Negative | Diffuse |
| Renal pelvis | ||
| Transitional cells | Negative | Focal |
| Prostate gland | ||
| Ducts and glands | Negative | Rare |
| Seminal vesicles | Negative | Focal |
| Testis | ||
| Ductular efferens | Diffuse | Diffuse |
| Rete testis | Diffuse | Negative |
| Uterine cervix | ||
| Basal cells of squamous mucosa | Negative | Focal |
| Reactive Reserve cells of the glands | Rare | Rare |
| Uterine endometrial glands | ||
| Proliferative phase | Negative | Focal |
| Secretory phase | Negative | Negative |
| Ovary | ||
| Surface coelomic epithelium | Diffuse | Focal |
| Rete ovarii | Diffuse | Negative |
| Breast | ||
| Lobular and ductal units | Negative | Focal |
| Skin | ||
| Basal cells of epidermis | Negative | Focal |
| Basal cells of hair follicle | Diffuse | Negative |
| Sweat glands | Negative | Diffuse |
| Skeletal system | ||
| Cartilaginous tissues near joint spaces | Focal | Negative |
| Skeletal muscle | Focal | Negative |
| Central nervous system | ||
| Neuron of the cerebellum and cerebrum | Negative | Rare |
| Choroid plexus | Diffuse | Diffuse |
| Lining cells of the ventricle | Focal | Negative |
| Posterior lobe of pituitary gland | Negative | Diffuse |
| Remnant of Rathke’s pouch | Negative | Diffuse |
| Placenta | ||
| Mesodermal cells of amniotic/chorionic plate | Focal | Negative |
| Syncytiotrophoblasts | Negative | Focal |
All normal adult human tissues were examined. Those not listed in the table were negative for both CA IX and CA XII protein expression.
Diffuse, ≥40% of cells within a field stain positively.
Focal, <40% of cells within a field stain positively.
Rare, <5% of cells within a field stain positively.
Figure 3.
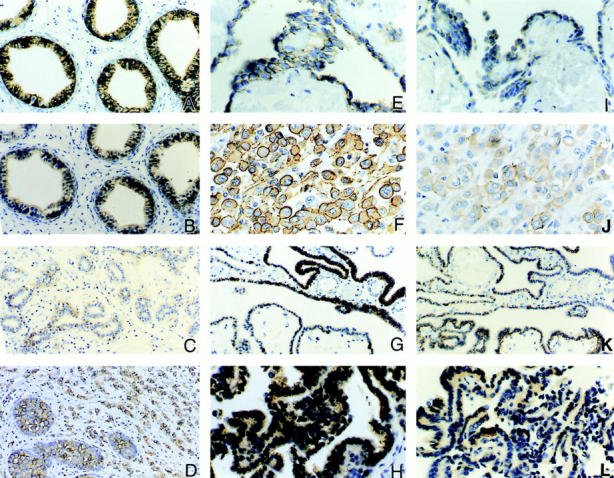
Examples of diffuse immunostaining of CA IX and CA XII proteins in normal and neoplastic tissues. Immunostaining for CA IX is illustrated in A, E, F, G, and H. Immunostaining for CA XII is illustrated in B, C, D, I, J, K, and L. In normal adult tissues, diffuse plasma membrane immunostaining for both CA IX and CA XII is seen in the ductular efferens (A and B), mesothelial cells of the body cavity (E and I), and the choroid plexus of brain ventricles (G and K). Variable degrees of expression of CA XII but not CA IX are also observed in the epithelium of the breast (C). Persistent expression of CA IX and CA XII proteins is also seen in tumors derived from the normal tissues that express these proteins. For example, a lobular-type breast carcinoma expressing CA XII is shown in D, mesotheliomas of the pleura in F and J, and choroid plexus papillomas in H and L. Original magnifications, ×200 (A, B, G, and K) and ×400 (D–F, H–J, and L).
CA IX/CA XII Expression in Different Tumors Analyzed by Immunohistochemistry
We surveyed a large number of benign and malignant human tissues by immunostaining with specific antibodies. The results are summarized in Table 4 ▶ and Figures 3 to 5 ▶ ▶ ▶ . With a few exceptions, a wide variety of tumors examined showed plasma membrane, or both plasma membrane and cytoplasmic immunoreactivity for CA IX and CA XII. The frequency of co-expression, the distribution of staining (focal or diffuse), and the intensity of staining varied considerably even within a single tumor type. For example, CA IX protein was expressed in 99% of cervical carcinomas tested (n = 77), and 68% of these tumors showed diffuse and strong staining, whereas CA XII was expressed in only 33% of cases tested (n = 24) and the positive staining was focal and weak. When a comparison of the distribution of CA IX and CA XII expression in normal tissues (Table 3) ▶ and the corresponding neoplastic tissues (Table 4) ▶ was made, the expression of CA IX and CA XII could be grouped into two categories as follows.
Table 4.
Expression of CA IX/CA XII in Benign and Malignant Human Tumors
| No. of cases studied Total no. (positive rate in %) | Degree of staining % of cases with diffuse staining | No. of cases with coexpression (no./total cases tested) | |||
|---|---|---|---|---|---|
| CA IX | CA XII | CA IX | CA XIII | CA IX and CA XII | |
| Cervix | |||||
| Carcinoma (Ca) | 77 (99) | 24 (33) | 68 | 0 | 8 /24 |
| Squamous cell Ca | 54 (100) | 14 (25) | 74 | 0 | 4 /14 |
| Adenocarcinoma | 15 (93) | 8 (50) | 80 | 0 | 4 /8 |
| Cervical intraepithelial Neoplasia (CIN I–III) | 129 (91) | 6 (50) | 80 | 0 | 3 /6 |
| Adenocarcinoma in-situ | 20 (100) | 4 (75) | 90 | 0 | 3 /4 |
| Uterine corpus | |||||
| Endometrial Ca | 27 (89) | 12 (67) | 30 | 50 | 8 /12 |
| Endometrial hyperplasia | 7 (100) | 3 (100) | 14 | 67 | 3 /3 |
| Ovary | |||||
| Epithelial Ca of all types | 41 (37) | 16 (44) | 67 | 0 | 6 /16 |
| Cystadenoma of LMP | 10 (100) | 6 (100) | 67 | 0 | 6 /6 |
| Sex-Cord Tumor | 5 (40) | 3 (0) | 0 | 0 | 0 /0 |
| Germ cell tumor | 10 (40) | 6 (50*) | 0 | 0 | 2 /6 |
| Breast | |||||
| Ductal Carcinoma | 31 (26) | 22 (55) | 50 | 67 | 4 /22 |
| Lobular Carcinoma | 7 (14) | 7 (86) | 100 | 83 | 1 /7 |
| Kidney/urinary tract | |||||
| Renal cell carcinoma | 57 (89) | 29 (100) | 86 | 76 | 25 /29 |
| Clear cell/papillary | 49 (100) | 23 (100) | 90 | 78 | 23 /23 |
| Chromophobe cell | 4 (0) | 4 (100) | 0 | 100 | 0 /4 |
| Collecting duct | 4 (100) | 2 (100) | 0 | 0 | 2 /2 |
| Oncocytoma/adenoma | |||||
| Usual type | 5 (0) | 5 (0) | 0 | 0 | 0 /5 |
| Oncocytic cell | 4 (0) | 4 (75) | 0 | 100 | 0 /4 |
| Renal cysts | 7 (0) | 3 (100) | 0 | 100 | 0 /3 |
| Wilm’s tumor | 4 (75) | 3 (0) | 0 | 0 | 0 /3 |
| Transitional cell Ca | 42 (91) | 14 (86*) | 32 | 0 | 12 /14 |
| Prostate | |||||
| Adenocarcinoma | 19 (0) | 5 (80*) | 0 | 0 | 0 /5 |
| Gastrointestinal | |||||
| Carcinoma | |||||
| Stomach/duodenum | 15 (100) | 6 (0) | 0 | 0 | 0 /6 |
| Colon | 43 (100) | 20 (11) | 47 | 50 | 2 /20 |
| Adenoma of colon | 22 (91) | 14 (100) | 10 | 93 | 14 /14 |
| Liver | |||||
| Hepatoma/hepatoblastoma | 6 (50) | 6 (0) | 0 | 0 | 0 /6 |
| Pancreas/gallbladder | |||||
| Adenocarcinoma | 6 (100) | 6 (50*) | 30 | 0 | 3 /6 |
| Lung | |||||
| Non-small cell carcinoma | 29 (72) | 9 (11) | 31 | 100 | 1 /9 |
| Small cell carcinoma | 15 (73) | 6 (0) | 40 | 0 | 0 /6 |
| Head and neck | |||||
| Squamous cell Ca | 12 (92) | 4 (50) | 71 | 100 | 2 /4 |
| Salivary gland | |||||
| Pleomorphic adenoma | 6 (100) | 3 (100*) | 0 | 0 | 3 /3 |
| Salivary gland | |||||
| Papillary and follicular Ca | 11 (14*) | 11 (27*) | 0 | 0 | 1 /11 |
| Tumors with secretory granules | |||||
| PNET (central/peripheral) | 7 (86) | 4 (0) | 43 | 0 | 0 /4 |
| Pheochromocytoma | 2 (0) | 2 (0) | 0 | 0 | 0 /2 |
| Paraganglioma | 2 (0) | 2 (0) | 0 | 0 | 0 /2 |
| Neuroblastoma | 4 (0) | 4 (0) | 0 | 0 | 0 /4 |
| Carcinoid/islet cell tumor | 6 (0) | 6 (0) | 0 | 0 | 0 /6 |
| Central nervous system | |||||
| Glioma | |||||
| Low grade (grade I–II) | 6 (0) | 6 (80) | 0 | 0 | 0 /6 |
| Anaplastic/Glioblastoma | 5 (100) | 5 (40) | 20 | 0 | 2 /5 |
| Oligodendroglioma | 3 (0) | 1 (100) | 0 | 0 | 0 /1 |
| Meningioma | 5 (100) | 4 (0) | 0 | 0 | 0 /4 |
| Choroid plexus tumor | 3 (67) | 3 (67) | 0 | 0 | 2 /3 |
| Ependymoma | 6 (100) | 2 (50) | 33 | 0 | 1 /2 |
| Hemangioblastoma | 3 (100) | 3 (0) | 100 | 0 | 0 /3 |
| Body cavity | |||||
| Mesothelioma | 8 (100) | 6 (33) | 100 | 50 | 2 /6 |
| Skin | |||||
| Squamous/Basal cell Ca | 10 (100) | 7 (71*) | 50 | 0 | 5 /7 |
| Melanoma | 18 (0) | 5 (0) | 0 | 0 | 0 /5 |
Diffuse, ≥40% of the cells in the section show positive staining; PNET, Primitive neuroectodermal tumor; LMP, Low malignant potential.
*The immunostaining seen in these tumors is very weak.
Figure 4.
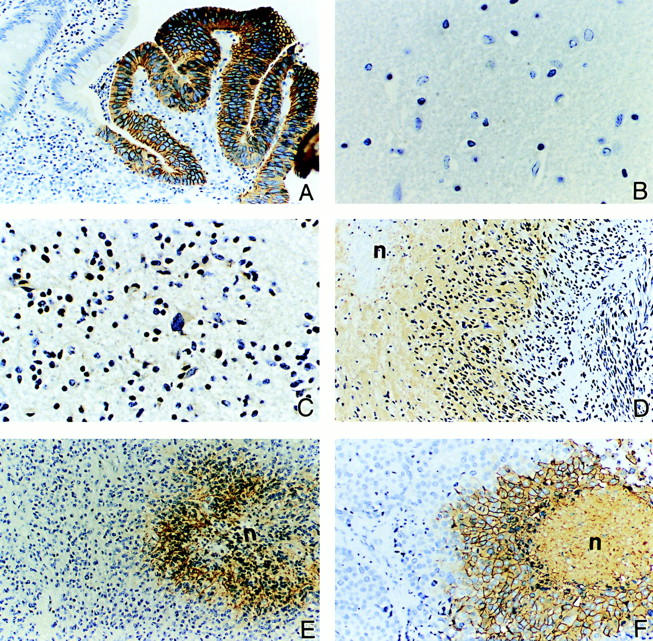
Examples of ectopic expression of CA IX and CA XII proteins in various tumors, including regions of necrosis/hypoxia. The glandular cells of the colon are normally CA IX-negative but diffuse immunoreactivity is seen in colon carcinoma (A). The normal glial tissues of the brain show no expression of either CA IX or CA XII protein (B). However, variable degrees of positive staining for CA XII are seen in low-grade glioma (C). In contrast, high levels of CA IX protein expression are observed in glioblastoma multiforme (D) and anaplastic ependymoma (E). Expression of the CA IX protein is seen in necrotic/hypoxic regions of the tumors. This induced expression associated with necrotic/hypoxic regions is also seen in high-grade ductal breast carcinoma (F). The symbol n = area of necrosis. Original magnifications, ×200 (A, D–F) and ×400 (B and C).
Figure 5.

Immunostaining of normal kidney and renal cell tumors for CA IX/CA XII expression. The normal kidney is negative for CA IX (A) whereas CA XII is expressed in the distal convoluted tubules (arrow) and intercalated cells of the collecting ducts (arrowhead) (B). Co-expression of CA IX and CA XII is seen in renal cell carcinomas of the clear cell type (CA IX = C; CA XII = D). However, chromophobe cell carcinomas (E) and oncocytomas (G) do not express CA IX whereas they exhibit diffuse expression of CA XII (F and H, respectively). Original magnifications, ×200 (A and B) and ×400 (C–H).
Persistent Co-Expression of CA IX/CA XII Proteins in Normal Tissues and the Corresponding Neoplastic Tissues
Examples of co-expression of CA IX/CA XII in normal and neoplastic tissues are mesothelium/mesotheliomas and choroid plexus/choroid plexus tumors (Figure 3, E– L) ▶ . Expression of CA XII was seen in ductal breast epithelium and ductal breast carcinoma (Figure 3, C and D) ▶ , and expression of CA IX was observed in the biliary duct and carcinomas derived from the epithelium of the biliary tract (data not shown).
Ectopic Expression of CA IX/CA XII
In general, most tumors ectopically expressed these proteins. The ectopic or enhanced expression may have clinical implications, especially in areas of tumor diagnosis and tumor immunotherapy, when applied to specific organ sites. The best examples were the expression of CA IX/CA XII proteins in gliomas (Figure 4, C–E) ▶ , and CA IX in cervical intraepithelial neoplasia and carcinomas, 22 and in renal cell carcinomas. 23 In all of these tumors CA IX immunoreactivity was not seen in the corresponding normal or reactive tissues, whereas diffuse immunoreactivity was present in the tumors.
Association of CA IX/CA XII Expression with Tumor Type and Degree of Differentiation
Within a given organ, in particular breast, kidney, and brain, CA IX and CA XII expression was closely related to a specific cell type and a given degree of differentiation. High levels of CA XII expression were primarily observed in low-grade ductal carcinoma and lobular carcinoma of the breast, and low-grade glioma of the brain (Figure 3D ▶ and Figure 4C ▶ ). In contrast, strong CA IX immunoreactivity was limited to high-grade glioma, including glioblastoma multiforme (Figure 4, D and E) ▶ and high-grade ductal breast carcinoma with necrosis (Figure 4F) ▶ .
Expression of CA IX and CA XII Are Diagnostic for Renal Cell Carcinomas
CA IX is not expressed in normal adult kidney (Figure 5A) ▶ , whereas CA XII is expressed in the distal convoluted tubules and the intercalated cells of the collecting duct (Figure 5B) ▶ . We had originally shown that ectopic CA IX protein expression is diagnostic for renal cell clear-cell carcinomas (Figure 5C) ▶ . 23 We now show that CA XII is also expressed in these tumors (Figure 5D) ▶ . Furthermore, CA XII is also expressed in chromophobe cell carcinomas (Figure 5F) ▶ and oncocytic tumors (Figure 5H) ▶ , whereas CA IX is not expressed in either type of tumor (Figure 5, E and G) ▶ . Co-expression of CA IX and CA XII is also seen in papillary type tumors and collecting duct carcinomas (data not shown). Thus, the combination of CA IX and CA XII immunostaining essentially diagnoses all forms of renal cell cancers.
Induced or Enhanced Expression of CA IX and CA XII in Association with Hypoxia
We observed a strong association between induced or enhanced expression of CA IX and CA XII proteins and tumor necrosis and hypoxia. High levels of CA IX protein were expressed by those neoplastic cells located in and adjacent to the necrotic foci, irrespective of whether the tumor cells in the absence of necrosis were CA IX immunoreactive or not. A similar phenomenon was also observed in cells expressing CA XII in areas adjacent to necrosis, but was less predictable compared to CA IX expression. The most predominant examples were induced expression of CA IX protein in hypoxic/necrotic regions of melanoma, and enhanced expression in necrotic/hypoxic regions of meningiomas, glioblastoma multiforme, anaplastic ependymoma, and comedo type of breast carcinomas. The latter three tumors are shown in Figure 4; D, E, and F ▶ . CA IX was predominantly expressed in the areas of necrosis and hypoxia. The tumor cells that were more distal to the necrotic/hypoxic areas showed little or no immunoreactivity.
Effect of Hypoxia on CA 9 and CA12 mRNA Expression in a Glioblastoma Cell Line
To directly examine the effect of hypoxia on the expression of CA9 and CA12 mRNA we analyzed an established glioblastoma cell line, U87, expressing a normal VHL message (M Merrill and M Proescholdt, unpublished observations). The cells were grown under normoxic conditions and then maintained under hypoxic conditions for 6 and 12 hours as previously described. 19 Northern blot hybridization (Figure 6) ▶ revealed that 6 hours of hypoxia resulted in approximately fourfold and 1.6-fold up-regulation of CA9 and CA12 expression, respectively, while 12 hours of hypoxia induced expression of both genes ∼11-fold to 13-fold, compared to control.
Figure 6.

Up-regulation of CA IX/CA XII expression by hypoxia in the glioblastoma cell line, U87. Levels of transcripts under normoxic (N) and hypoxic (H) conditions at different time points were assessed by Northern blot analysis with total RNA samples. After 6 hours of hypoxia an ∼4- and 1.6-fold increase in CA IX and CA XII mRNA expression, respectively, was observed. Twelve hours of hypoxia caused ∼13- and 11-fold up-regulation of CA IX and CA XII, respectively.
Media Acidification in Confluent Renal Carcinoma 786-0 Cells
We next investigated the correlation of CA9 and CA12 mRNA expression with the dynamics of extracellular pH changes under cell culture conditions. Acidification of the bicarbonate-buffered media at the late confluent stage was much more pronounced in 786-0 cells (lacking wtVHL), as compared to the same cell line expressing wtVHL transgenes (ΔpHe, ∼0.4). Thus, the increased acidification clearly correlates with the up-regulation of the CA9 and CA12 mRNA expression (Figure 7) ▶ . Elevated uptake of glucose at this stage in the 786-0 cells (15% increase compared to the wtVHL expressing 786-0, data not shown) suggests that altered glucose uptake and metabolism may be responsible, at least partially, for the media acidification.
Figure 7.

Up-regulation of CA9 and CA12 mRNA expression correlates with media acidification. 786-0 cells were harvested at different stages of the growth curve and levels of CA9 and CA12 transcripts were assessed by Northern hybridization. In parallel, glucose consumption (not shown) and changes in media pH were monitored. The onset of confluent stage (day 2) is indicated by an arrow. Enhanced acidification of the media by the VHL-deficient cell line 786-0 is pronounced at the late confluent stage (day 7, boxed) and is paralleled by up-regulation in CA9 and CA12 mRNA expression.
Discussion
This study demonstrates, for the first time, high levels of expression of cell-surface CAs (CA IX/CA XII) in a large sample of cancer cell lines, fresh and archived tumor tissues. This was shown by Northern blot hybridization with mRNAs and immunohistochemistry of tissue/tumor sections with specific antibodies. Most common tumors originating from many different sites expressed either both genes or one of them. For many tumors there was no detectable expression in corresponding normal adult tissues (Tables 3 and 4) ▶ ▶ , indicating tumor-specific activation of these genes. Other investigators, in less extensive screenings, have reported expression of CA IX or CA XII in some common tumors. 27,28 To our knowledge this is the first extensive comparative analysis of the combined expression of these genes and proteins. Cumulatively, the data presented here and published before by us 10,22,23 and others 21,27,28 firmly establish high expression of CA9/CA12 genes in a large number of common human malignancies, suggesting an important role for them in tumor development.
Tumor growth involves complex interactions between cells and their unique microenvironment, that is characterized by low acidic pHe and altered hydrostatic and oxygen pressures. 6,7 Tight control of pH homeostasis in tumors is achieved by using proton extrusion mechanisms that include plasma membrane proton pumps, 29,30 proton channels/proton wires, 31 sodium/proton exchangers, 32 and monocarboxylic acid transporters. 33 Some mechanisms involved in proton extrusion and maintenance of pH homeostasis in and around tumor cells are depicted in Figure 8 ▶ . The extremely efficient cell surface CAs 34,35 may play an important role in controlling the levels of protons and bicarbonate in the immediate vicinity of the tumor cells by sensing pH and tipping the proton balance across the cell membrane. The hypothetical pH sensing function(s) of CA enzymes may be associated with histidine residues in their catalytic center outside the cells as well as with internal histidines in the cytoplasmic domains. The fact that CA IX and CA XII proteins are localized normally on differentiated cells specialized in acid/base homeostasis (ie, intercalated cells and collecting ducts of the kidney, gastrointestinal gland cells, and so forth), supports the proposed role for them in maintaining extracellular acidity in tumors.
Figure 8.
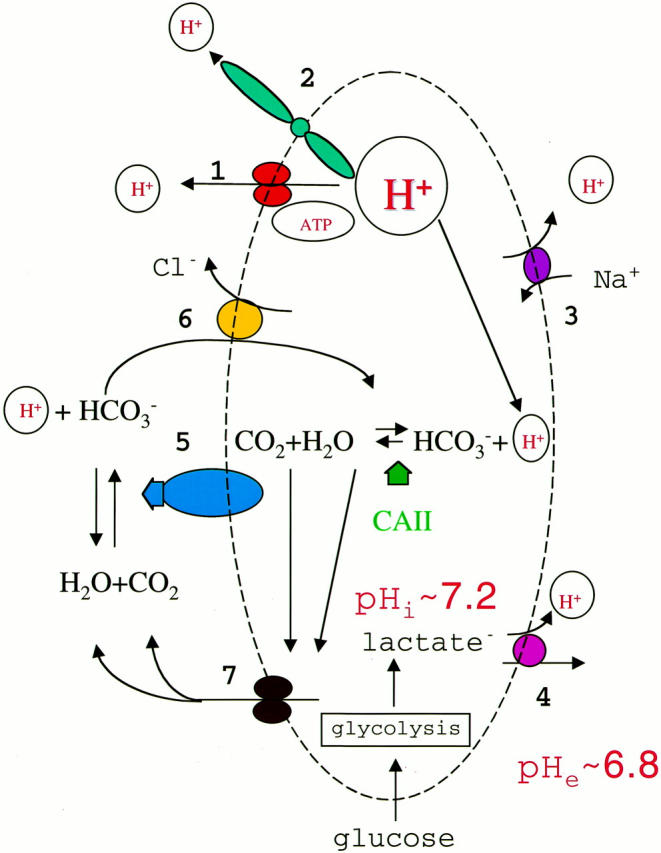
Molecular mechanisms of proton extrusion/secretion from cancer cells. To maintain intracellular neutrality excessive protons are extruded from the cancer cell by several protein machines, including plasma membrane proton pump (H+-ATPase, no. 1), proton channels (no. 2), sodium/proton exchangers (no. 3), and monocarboxylate carriers (no. 4). CA IV, CA IX, or CA XII (no. 5) may produce bicarbonate ions outside the cell that are transported inside by bicarbonate/chloride exchangers (no. 6) and used by the cytosolic CA II to titrate protons. Buffering protons facilitates proton secretion and protects the cell from intracellular acidification. Water and carbon dioxide then are transported out through aquaporins (no. 7) and used by cell-surface CAs to produce bicarbonate.
Expression of the CA9/CA12 genes are negatively controlled by pVHL, presumably via proteasomal degradation of HIF, and up-regulated in tumors associated with VHL disease, 10 which include a variety of benign cysts and malignant tumors. 36 However, in most common tumors, the VHL gene is intact, implying that mechanisms other than mutational inactivation of the VHL gene must operate in cancer cells to activate overexpression of these enzymes. We have shown in this study (Figure 6) ▶ that glioblastoma cells expressing a normal VHL message when maintained for 12 hours under hypoxic conditions overexpress the CA9/CA12 genes, indicating a role for hypoxia in this induction. It is established that in hypoxic cells the proteolytic function of pVHL is abrogated, resulting in the overexpression of the HIF1-α protein and other VHL target genes. 8,18 The transcriptional trans-activator HIF1 controls the expression of several dozen target genes including those involved in energy metabolism (glucose transporters, glycolytic enzymes) and angiogenesis (VEGF and its receptors), and is considered a master regulator gene that orchestrates physiological responses to acute and chronic hypoxia. 1,12-14 Thus, loss of pVHL function(s) results in the stabilization of HIF and transactivation of its target genes. Therefore, presence or absence of the VHL protein seems to be responsible for fundamental metabolic changes in tumor cells. The ultimate consequences of these changes in gene expression in the absence of a functional VHL protein (because of mutation, epigenetic silencing, or localized hypoxic conditions) are compromised tumor microenvironment, a powerful, albeit faulty, disorganized process of angiogenesis, increased glycolysis, and induction of expression of transmembrane CA. The frequent, widespread overexpression of the CA9/CA12 genes in human tumors has several important implications in the clinical setting.
Implications for Tumor Growth and Spread
On the basis of the above considerations, it would seem that tumor microenvironmental acidity could play a predominant promoting role in tumor growth and metastasis and also could underlie resistance to radiotherapy, chemotherapy, and other nonsurgical treatments. 6,7 The extracellular matrix metalloproteinases, which are activated by acidic pH, are involved in remodeling stromal and tumor cell surface proteins, thereby promoting tumor cell motility, and contributing to tumor growth and metastasis. 37 However, synthesis of matrix metalloproteinases may have opposite effects on tumor angiogenesis, promoting extracellular matrix degradation and new blood vessel formation on the one hand 37 and, on the other, blocking angiogenesis by producing angiostatin, a cleavage product of plasminogen. 2 Most tumors have been shown to exhibit high vascular permeability and high interstitial fluid pressure. 6,7 These may result from activation, as a consequence of the acidic tumor microenvironment, of trans-membrane water channel proteins (aquaporins) that are widely distributed in tumors. 38 Aquaporins are known to play a major role in trans-cellular and trans-epithelial water movements in many normal tissues. 39,40 The expression of CA IX/CA XII in cystic tumors is an indication that their activity in promoting acidity might facilitate the activity of aquaporins expressed on tumor and endothelial cells, leading to high interstitial fluid pressure and high vascular permeability in tumors. 6,7
Implications for Diagnosis
The fact that CA IX/CA XII are expressed in many tumor types may lead one to conclude that they have limited utility in cancer diagnosis. However, for selected cancers, they may prove to be powerful diagnostic biomarkers. We have already shown the utility of CA IX as a biomarker for cervical dysplasia and carcinoma. 22,41 Furthermore, we have recently shown its utility in identifying those patients who receive a Pap smear diagnosis of “atypical glandular cells of undetermined significance” and harbor a significant lesion in their cervix. 42 We and others have also shown that expression of CA IX is an excellent diagnostic biomarker for renal cell carcinoma. 23,24,43 The studies described here, in which we show that CA XII is expressed in chromophobe tumors, whereas CA IX is not (Figure 5) ▶ , suggests that the combined detection of CA IX and CA XII expression will identify all renal cell carcinomas. This also has important implications for therapy. 44-47 Other investigators have identified the expression of CA IX in esophageal 48 and lung carcinomas 49 Finally, our studies here also suggest that CA XII and/or CA IX may have utility in diagnosis of brain tumors.
Implications for Tumor Treatment
The CA IX/CA XII enzymes ectopically expressed on the surface of cancer cells provide an excellent target for tumor treatment modalities, including development of highly specific humanized antibodies, antibodies armed with toxins, 46 and specific inhibitors of these enzymes. 50-52 Antibodies to CA IX have also been developed in Europe and are being successfully used to treat renal cancer. 43,47 Dr. Neal Bunder is developing humanized antibodies at the Memorial Sloan-Kettering Cancer Center (personal communication). In addition, antibodies to CA XII were recently patented for treatment of lung cancer (US patent no. 5,589,579). On the other hand, highly specific inhibitors of CA IX/CA XII enzymes tailored to their catalytic centers, could be also used to treat cancer and should be developed. Two of us (AW and WS), with others, 50 have shown that acetazolamide, a potent inhibitor of CAs, suppressed invasion of renal cancer cells in vitro. It took Professor T. Maren and the Merck Company 20 years to develop such inhibitors for topical treatment of glaucoma. 51,52 Establishing the crystal structures of CA IX and CA XII should take less time and will result in designing more effective specific drugs to manipulate tumor pH, and possibly provide a mechanism for inhibiting tumor growth and tumor spread.
Acknowledgments
We thank Bruce Johnson, Teizo Yoshimura, and Dominic Scudiero for providing RNA and cell lines and Ning Ru for assistance with the immunostaining.
Footnotes
Address reprint requests to Dr. Sergey Ivanov, Science Application International Corp., Frederick Laboratory of Immunology, Bldg. 560, NCI-FCRDC, P. O. Box B, Frederick, MD 21702. E-mail: ivanov@ncifcrf.gov.
Supported in part by National Cancer Institute, National Institutes of Health, contract no. NO1-CO-56000 and CA19401 from the National Cancer Institute.
S. I. and S.-Y. L contributed equally to this work.
References
- 1.Semenza GL: Hypoxia, clonal selection, and the role of HIF-1 in tumor progression. Crit Rev Biochem Mol Biol 2000, 35:71-103 [DOI] [PubMed] [Google Scholar]
- 2.Hanahan D, Folkman J: Patterns and emerging mechanisms of the angiogenic switch during tumorigenesis. Cell 1996, 86:353-364 [DOI] [PubMed] [Google Scholar]
- 3.Warburg O: The Metabolism of Tumours. 1930. Constable, London
- 4.Dang CV, Semenza GL: Oncogenic alterations of metabolism. Trends Biochem Sci 1999, 24:68-72 [DOI] [PubMed] [Google Scholar]
- 5.Stubbs M, McSheehy PM, Griffiths JR, Bashford CL: Causes and consequences of tumour acidity and implications for treatment. Mol Med Today 2000, 6:15-19 [DOI] [PubMed] [Google Scholar]
- 6.Helmlinger G, Yuan F, Dellian M, Jain RK: Interstitial pH and pO2 gradients in solid tumors in vivo: high-resolution measurements reveal a lack of correlation. Nat Med 1997, 2:177-182 [DOI] [PubMed] [Google Scholar]
- 7.Jain RK: Transport of molecules, particles, and cells in solid tumors. Annu Rev Biomed Engineer 1999, 1:241-263 [DOI] [PubMed] [Google Scholar]
- 8.Maxwell PH, Wiesener MS, Chang GW, Clifford SC, Vaux EC, Cockman ME, Wykoff CC, Pugh CW, Maher ER, Ratcliffe PJ: The tumour suppressor protein VHL targets hypoxia-inducible factors for oxygen-dependent proteolysis. Nature 1999, 399:271-275 [DOI] [PubMed] [Google Scholar]
- 9.Gnarra JR, Zhou S, Merrill MJ, Wagner JR, Krumm A, Papavassiliou E, Oldfield EH, Klausner RD, Linehan WM: Post-transcriptional regulation of vascular endothelial growth factor mRNA by the product of the VHL tumor suppressor gene. Proc Natl Acad Sci USA 1996, 93:10589-10594 [DOI] [PMC free article] [PubMed] [Google Scholar]
- 10.Ivanov SV, Kuzmin I, Wei MH, Pack S, Geil L, Johnson BE, Stanbridge EJ, Lerman MI: Down-regulation of transmembrane carbonic anhydrases in renal cell carcinoma cell lines by wild-type von Hippel-Lindau transgenes. Proc Natl Acad Sci USA 1998, 95:12596-12601 [DOI] [PMC free article] [PubMed] [Google Scholar]
- 11.Ohh M, Kaelin WG, Jr: The von Hippel-Lindau tumour suppressor protein: new perspectives. Mol Med Today 1999, 6:257-263 [DOI] [PubMed] [Google Scholar]
- 12.Semenza GL: Regulation of mammalian O2 homeostasis by hypoxia-inducible factor 1. Annu Rev Cell Dev Biol 1999, 15:551-578 [DOI] [PubMed] [Google Scholar]
- 13.Bunn HF, Poyton RO: Oxygen sensing and molecular adaptation to hypoxia. Physiol Rev 1996, 76:839-885 [DOI] [PubMed] [Google Scholar]
- 14.Gleadle JM, Ratcliffe PJ: Hypoxia and the regulation of gene expression. Mol Med Today 1998, 3:122-129 [DOI] [PubMed] [Google Scholar]
- 15.Kaelin WG, Jr, Maher ER: The VHL tumour-suppressor gene paradigm. Trends Genet 1998, 10:423-426 [DOI] [PubMed] [Google Scholar]
- 16.Tyers M, Willems AR: One ring to rule a superfamily of E3 ubiquitin ligases. Science 1999, 284:408-414 [DOI] [PubMed] [Google Scholar]
- 17.Tyers M, Rottapel R: VHL: a very hip ligase. Proc Natl Acad Sci USA 1999, 96:12230-12232 [DOI] [PMC free article] [PubMed] [Google Scholar]
- 18.Iwai K, Yamanaka K, Kamura T, Minato N, Conaway RC, Conaway JW, Klausner RD, Pause A: Identification of the von Hippel-lindau tumor-suppressor protein as part of an active E3 ubiquitin ligase complex. Proc Natl Acad Sci USA 1999, 96:12436-12441 [DOI] [PMC free article] [PubMed] [Google Scholar]
- 19.Heiss JD, Papavassiliou E, Merrill MJ, Nieman L, Knightly JJ, Walbridge S, Edwards NA, Oldfield EH: Mechanism of dexamethasone suppression of brain tumor-associated vascular permeability in rats. Involvement of the glucocorticoid receptor and vascular permeability factor. J Clin Invest 1996, 98:1400-1408 [DOI] [PMC free article] [PubMed] [Google Scholar]
- 20.Zavada J, Zavadova Z, Pastorekova S, Ciampor F, Pastorek J, Zelnik V: Expression of MaTu-MN protein in human tumor cultures and in clinical specimens. Int J Cancer 1993, 54:268-274 [DOI] [PubMed] [Google Scholar]
- 21.Karhumaa P, Parkkila S, Tureci O, Waheed A, Grubb JH, Shah G, Parkkila A, Kaunisto K, Tapanainen J, Sly WS, Rajaniemi H: Identification of carbonic anhydrase XII as the membrane isozyme expressed in the normal human endometrial epithelium. Mol Hum Reprod 2000, 6:68-74 [DOI] [PubMed] [Google Scholar]
- 22.Liao SY, Brewer C, Zavada J, Pastorek J, Pastorekova S, Manetta A, Berman ML, DiSaia PJ, Stanbridge EJ: Identification of the MN antigen as a diagnostic biomarker of cervical intraepithelial neoplasia and cervical carcinoma. Am J Pathol 1994, 145:598-609 [PMC free article] [PubMed] [Google Scholar]
- 23.Liao SY, Aurelio ON, Jan K, Zavada J, Stanbridge EJ: Identification of the MN/CA9 protein as a reliable diagnostic biomarker of clear cell carcinoma of the kidney. Cancer Res 1997, 57:2827-2831 [PubMed] [Google Scholar]
- 24.McKiernan JM, Buttyan R, Bander NH, Stifelman MD, Katz AE, Chen MW, Olsson CA, Sawczuk IS: Expression of the tumor-associated gene MN: a potential biomarker for human renal cell carcinoma. Cancer Res 1997, 57:2362-2365 [PubMed] [Google Scholar]
- 25.Saarnio J, Parkkila S, Parkkila AK, Haukipuro K, Pastorekova S, Pastorek J, Kairaluoma MI, Karttunen TJ: Immunohistochemical study of colorectal tumors for expression of a novel transmembrane carbonic anhydrase, MN/CA IX, with potential value as a marker of cell proliferation. Am J Pathol 1998, 53:279-285 [DOI] [PMC free article] [PubMed] [Google Scholar]
- 26.Saarnio J, Parkkila S, Parkkila AK, Waheed A, Casey MC, Zhou XY, Pastorekova S, Pastorek J, Karttunen T, Haukipuro K, Kairaluoma MI, Sly WS: Immunohistochemistry of carbonic anhydrase isozyme IX (MN/CA IX) in human gut reveals polarized expression in the epithelial cells with the highest proliferative capacity. J Histochem Cytochem 1998, 46:497-504 [DOI] [PubMed] [Google Scholar]
- 27.Kivela A, Parkkila S, Saarnio J, Karttunen TJ, Kivela J, Parkkila AK, Waheed A, Sly WS, Grubb JH, Shah G, Tureci O, Rajaniemi H: Expression of a novel transmembrane carbonic anhydrase isozyme XII in normal human gut and colorectal tumors. Am J Pathol 2000, 156:577-584 [DOI] [PMC free article] [PubMed] [Google Scholar]
- 28.Tureci O, Sahin U, Vollmar E, Siemer S, Gottert E, Seitz G, Parkkila AK, Shah GN, Grubb JH, Pfreundschuh M, Sly WS: Human carbonic anhydrase XII: cDNA cloning, expression, and chromosomal localization of a carbonic anhydrase gene that is overexpressed in some renal cell cancers. Proc Natl Acad Sci USA 1998, 95:7608-7613 [DOI] [PMC free article] [PubMed] [Google Scholar]
- 29.Wilkens S, Vasilyeva E, Forgac M: Structure of the vacuolar ATPase by electron microscopy. J Biol Chem 1999, 274:31804-31810 [DOI] [PubMed] [Google Scholar]
- 30.Wieczorek H, Grber G, Harvey WR, Huss M, Merzendorfer H, Zeiske W: Structure and regulation of insect plasma membrane H+-ATPase. J Exp Biol 2000, 203:127-135 [DOI] [PubMed] [Google Scholar]
- 31.DeCoursey TE, Cherny VV: An electrophysiological comparison of voltage-gated proton channels, other ion channels, and other proton channels. Isr J Chem 1999, 39:409-418 [Google Scholar]
- 32.Wakabayashi S, Shigekawa M, Pouyssegur J: Molecular physiology of vertebrate Na+/H+-exchangers. Physiol Rev 1997, 77:51-74 [DOI] [PubMed] [Google Scholar]
- 33.Halestrap AP, Price NT: The proton-linked monocarboxylate transporter (MCT) family: structure, function and regulation. Biochem J 1999, 343:281-299 [PMC free article] [PubMed] [Google Scholar]
- 34.Sly WS, Hu PY: Human carbonic anhydrases and carbonic anhydrase deficiencies. Annu Rev Biochem 1995, 64:375-401 [DOI] [PubMed] [Google Scholar]
- 35.Baird TT, Jr, Waheed A, Okuyama T, Sly WS, Fierke CA: Catalysis and inhibition of human carbonic anhydrase IV. Biochemistry 1997, 36:2669-2678 [DOI] [PubMed] [Google Scholar]
- 36.Zbar B, Lerman M: Inherited carcinomas of the kidney. Adv Cancer Res 1998, 75:163-201 [DOI] [PubMed] [Google Scholar]
- 37.McCawley LJ, Matrisian LM: Matrix metalloproteinases: multifunctional contributors to tumor progression. Mol Med Today 2000, 6:149-156 [DOI] [PubMed] [Google Scholar]
- 38.Hashizume H, Baluk P, Morikawa S, McLean JW, Thurston G, Roberge S, Jain RK, McDonald DM: Openings between defective endothelial cells explain tumor vessel leakiness. Am J Pathol 2000, 156:1363-1380 [DOI] [PMC free article] [PubMed] [Google Scholar]
- 39.Engel A, Fujiyoshi Y, Agre P: The importance of aquaporin water channel protein structures. EMBO J 2000, 19:800-806 [DOI] [PMC free article] [PubMed] [Google Scholar]
- 40.Verkman AS, Matthay MA, Song Y: Aquaporin water channels and lung physiology. Am J Physiol Lung Cell Mol Physiol 2000, 78:L867-L879 [DOI] [PubMed] [Google Scholar]
- 41.Liao SY, Stanbridge EJ: Expression of the MN antigen in cervical Papanicolaou smears is an early diagnostic biomarker of cervical dysplasia. Cancer Epidemiol Biomarkers Prev 1996, 5:549-557 [PubMed] [Google Scholar]
- 42.Liao SY, Stanbridge EJ: Expression of MN/CA9 protein in Papanicolaou smears containing atypical glandular cells of undetermined significance is a diagnostic biomarker of cervical dysplasia and neoplasia. Cancer 2000, 88:1108-1121 [DOI] [PubMed] [Google Scholar]
- 43.Oosterwijk DJ, Ruiter PJ, Pauwels EKJ, Jonas U, Zwartenduk J, Warnaar O: Monoclonal antibody G 250 recognizes a determinant present in renal cell carcinoma and absent from normal kidney. Int J Cancer 1986, 38:489-494 [DOI] [PubMed] [Google Scholar]
- 44.Uemura H, Nakagawa Y, Yoshida K, Saga S, Yoshikawa K, Hirao Y, Oosterwijk E: MN/CA IX/G250 as a potential target for immunotherapy of renal cell carcinomas. Br J Cancer 1999, 81:741-746 [DOI] [PMC free article] [PubMed] [Google Scholar]
- 45.Divgi CR, Bander NH, Scott AM, O’Donoghue JA, Sgouros G, Welt S, Finn RD, Morrissey F, Capitelli P, Williams JM, Deland D, Nakhre A, Oosterwijk E, Gulec S, Graham MC, Larson SM, Old LJ: Phase I/II radioimmunotherapy trial with iodine-131-labeled monoclonal antibody G250 in metastatic renal cell carcinoma. Clin Cancer Res 1998, 4:2729-2739 [PubMed] [Google Scholar]
- 46.Frankel AE, Kreitman RJ, Sausville EA: Targeted toxins. Clin Cancer Res 2000, 6:326-344 [PubMed] [Google Scholar]
- 47.Steffens MG, Boerman OC, de Mulder PH, Oyen WJ, Buijs WC, Witjes JA, van den Broek WJ, Oosterwijk-Wakka JC, Debruyne FM, Corstens FH, Oosterwijk E: Phase I radioimmunotherapy of metastatic renal cell carcinoma with 131I-labeled chimeric monoclonal antibody G250. Clin Cancer Res 1999, 10(Suppl):S3268-S3274 [PubMed] [Google Scholar]
- 48.Turner JR, Odze RD, Crum CP, Resnick MB: MN antigen expression in normal, preneoplastic, and neoplastic esophagus: a clinicopathological study of a new cancer-associated biomarker. Hum Pathol 1997, 28:740-744 [DOI] [PubMed] [Google Scholar]
- 49.Vermylen P, Roufosse C, Burny A, Verhest A, Bossehaerts T, Pastorekova S, Ninane V, Sculier JP: Carbonic anhydrase IX antigen differentiates between preneoplastic and malignant lesions in non-small cell lung carcinomas. Eur Respir J 1999, 14:806-811 [DOI] [PubMed] [Google Scholar]
- 50.Parkkila S, Rajaniemi H, Parkkila AK, Kivela J, Waheed A, Pastorekova S, Pastorek J, Sly WS: Carbonic anhydrase inhibitor suppresses invasion of renal cancer cells in vitro. Proc Natl Acad Sci USA 2000, 97:2220-2224 [DOI] [PMC free article] [PubMed] [Google Scholar]
- 51.Maren TH: The development of topical carbonic anhydrase inhibitors. J Glaucoma 1995, 4:49-62 [PubMed] [Google Scholar]
- 52.Maren TH: Sulfonamides and secretion of aqueous humor. J Exp Zool 1997, 490:279-287 [PubMed] [Google Scholar]