

Abstract
C-reactive protein (CRP) and complement are hypothesized to be major mediators of inflammation in atherosclerotic plaques. We used the reverse transcriptase-polymerase chain reaction technique to detect the mRNAs for CRP and the classical complement components C1 to C9 in both normal arterial and plaque tissue, establishing that they can be endogenously generated by arteries. When the CRP mRNA levels of plaque tissue, normal artery, and liver were compared in the same cases, plaque levels were 10.2-fold higher than normal artery and 7.2-fold higher than liver. By Western blotting, we showed that the protein levels of CRP and complement proteins were also up-regulated in plaque tissue and that there was full activation of the classical complement pathway. By in situ hybridization, we detected intense signals for CRP and C4 mRNAs in smooth muscle-like cells and macrophages in the thickened intima of plaques. By immunohistochemistry we showed co-localization of CRP and the membrane attack complex of complement. We also detected up-regulation in plaque tissue of the mRNAs for the macrophage markers CD11b and HLA-DR, as well as their protein products. We showed by immunohistochemistry macrophage infiltration of plaque tissue. Because CRP is a complement activator, and activated complement attacks cells in plaque tissue, these data provide evidence of a self-sustaining autotoxic mechanism operating within the plaques as a precursor to thrombotic events.
From middle age onward, heart attack and stroke are the leading causes of disability and death. Atherosclerotic plaques are the precursor lesions of these events. The evolution of plaques is a complex process. 1,2 Many inflammatory molecules have been identified in association with plaque material, including activated complement proteins. 3,4 This has led to the theory that chronic inflammation contributes to atherosclerotic pathogenesis. 1,3,4 A prominent hypothesis is that complement activation and inflammation in plaques follows infections from such possible sources as herpesvirus, cytomegalovirus, or Chlamydia pneumoniae. 5-8 Alternatively, it has been suggested that antibody-independent mechanisms activate complement with subsequent inflammation. C-reactive protein (CRP), an acute phase protein, is prominently associated with atherosclerotic lesions. 9,10 CRP has been noted to be an in vitro 11 and in vivo 12 activator of complement. It co-localizes with the membrane attack complex (MAC) in early atherosclerotic lesions of human coronary arteries. 13 It has been proposed that CRP is deposited on cells exposed to the sublytic effects of the MAC, and that it may, in turn, further activate complement. 13
The principal source of CRP and complement components has always been assumed to be liver. Up-regulation of CRP after tissue injuries such as acute myocardial infarcts 14-17 has been attributed to induction of CRP in hepatocytes by inflammatory cytokines such as interleukin (IL)-6. 18 CRP and the complement proteins are, however, ancient host-defense proteins whose phylogenetic origins can be traced back at least as far as the horseshoe crab. 19,20 Therefore it would be anticipated that many tissues of the body would preserve their ability to generate these proteins as part of their innate immune defenses. Several types of cells have now been shown to produce complement proteins. We have recently shown that, in addition to complement proteins, the pentraxins CRP and amyloid P are generated in brain by neurons. 21 The mRNAs for the pentraxins 21 and the complement proteins 22 are sharply up-regulated in the Alzheimer’s disease brain. In this article we show that arterial tissue itself produces CRP as well as complement proteins and that both the mRNAs and proteins are substantially up-regulated in atherosclerotic plaques. By in situ hybridization and immunohistochemistry, we show that the major producers are both smooth muscle-like cells in the swollen intima and macrophages. CRP is the most significantly up-regulated of all of these components, supporting the concept that CRP may be an endogenous activator of complement in atheromatous tissue. 13
We also demonstrate the up-regulation in atherosclerotic plaques of two markers of tissue macrophages: the complement receptor CD11b and the MHC class II glycoprotein HLA-DR. These correlate with the infiltration of macrophages into the atheromata. Taken together, these data imply that a self-sustaining, localized inflammatory process is a major feature of atherosclerosis. They suggest that early anti-inflammatory therapy may be appropriate to arrest progression of the disease.
Materials and Methods
For analysis of relative mRNA levels, atherosclerotic plaque tissue and nearby normal arterial tissue were examined from 10 postmortem cases. Samples from the heart, liver, spleen, and kidney were also available. It was possible to carry out comparative mRNA analysis of plaque tissue, normal artery, and liver in each case, reducing the chances of such confounding factors as agonal causes of death, postmortem delay, and other pathologies. Table 1 ▶ lists the age, sex, postmortem delay, cause of death, and tissues sampled for each of the cases. Tissue was obtained from the pathology service of the University of British Columbia Hospital under conditions approved by the University Human Ethics Committee.
Table 1.
Tissues Used and the Age, Sex, Postmortem Delay, and Cause of Death of Cases
| Case | Age | Sex | PMD (hours) | Cause of death | Tissues taken | |||||
|---|---|---|---|---|---|---|---|---|---|---|
| Plaque | N. Artery* | Liver | Heart | Spleen | Kidney | |||||
| 1 | 71 | F | 72 | Leukemia | + | + | + | |||
| 2 | 91 | M | 96 | Cancer | + | + | + | + | + | |
| 3 | 66 | M | 67 | Cancer | +† | + | + | + | + | + |
| 4 | 82 | M | 22 | Dementia | + | + | + | + | + | + |
| 5 | 80 | F | 48 | Atherosclerosis | + | + | + | + | + | + |
| 6 | 90 | F | 49 | Hypertension | + | + | + | + | + | + |
| 7 | 69 | F | 34 | Cardiac failure | + | + | + | + | + | |
| 8 | 88 | M | 96 | Dementia | + | + | + | + | + | + |
| 9 | 78 | M | 7 | Pulmonary | + | + | + | + | + | + |
| 10 | 74 | M | 19 | Dementia | + | + | + | + | + | + |
*Normal artery; both plaque and normal tissue was taken from the aorta unless otherwise specified.
†Plaque tissue was obtained from both cerebral artery and aorta; normal arterial tissue from aorta.
The methods used for total RNA extraction, mRNA quantification by reverse transcriptase-polymerase chain reaction (RT-PCR), and protein analysis by Western blotting have previously been described in detail. 22,23,24 After extracting total RNA from ∼500 mg of each tissue sample, aliquots were subjected to single-strand cDNA synthesis. To establish reliable parameters for determining comparative mRNA levels using the RT-PCR technique, the method of Nakayama and colleagues 25 was followed. Graded amounts of cDNA, and varying cycles of amplification, were used to determine for each cDNA the range in which the logarithm of reaction product intensity was linear to the amplification cycle number. All amplification experiments were run in parallel with the cDNA of the housekeeping gene cyclophilin. Cyclophilin was chosen as the internal standard because of the consistency of its level from tissue to tissue and its postmortem stability. A linear relationship was found between the logarithm of PCR product intensity and cycle number for cyclophilin between 20 and 29 cycles, for CRP between 29 and 35 cycles, for all complement components between 25 and 37 cycles, and for CD11b and HLA-DR between 29 and 35 cycles. The anticipated plateaus were reached beyond these cycle numbers. In each case, cDNA was added in a range corresponding to 0.01 to 2 μg of total RNA. The product intensity was found to be proportional to the amount of cDNA added. In all experiments, the presence of possible contaminants was checked by control reactions in which amplification was performed up to 35 cycles on samples in which either reverse transcriptase or template cDNA was omitted from the RT-PCR reaction mixture. No PCR product was obtained under these conditions. After completion of preliminary experiments, standard conditions were followed in which cDNA (1 μl) corresponding to 0.1 μg total RNA was added, and the cyclophilin product amplified for 27 cycles, the complement components and CRP for 35 cycles, and both CD11b and HLA-DR for 30 cycles. Each PCR reaction product was electrophoresed through a 6% polyacrylamide gel, the product visualized by incubation with ethidium bromide, and the intensity of the bands imaged using a GDS 7600 image analyzer (Ultra Violet Products, Uplands, CA). The relative intensities of the bands were expressed as optical density units.
The primers for complement proteins and cyclophilin were those previously described. 22,24 Table 2 ▶ lists the primers for CRP, CD11b, and HLA-DR, the GenBank accession numbers, the product length, the restriction enzyme used for digestion analysis, and the digestion fragments obtained.
Table 2.
Primers Used for CRP, CD11b, and HLA-DR, Restriction Endonuclease Used, Sizes of Product and Fragments and GenBank Accession Number
| Gene | Primers (5′ to 3′) | PCR Product (bp) | Restriction endonuclease | Digestion fragments (bp) | GenBank accession no. |
|---|---|---|---|---|---|
| CRP | Forward TCGTATGCCACCAAGAGACAAGACA | 440 | HaeIII | 378, 62 | M11725 |
| Reverse AACACTTCGCCTTGCACTTCATACT | |||||
| CD11b | Forward CCAGGTGAATAACTT | 407 | HhaI | 276, 131 | J03925 |
| Reverse TGACATTAGCGTTGG | |||||
| HLA-DR | Forward TGAGTGTCATTTCTTCAA | 240 | PstI | 200, 40 | AF142444 |
| Reverse CGCTGCACTGTGAAGCTCTC |
For Western blots, the soluble fractions of tissues homogenized in extraction buffer were diluted in sodium dodecyl sulfate buffer and boiled for 3 minutes. Samples containing 20 μg of protein were electrophoresed on 7.5% polyacrylamide minigels and the proteins transferred onto polyvinylidene difluoride membranes. 22,24 A 3% polyacrylamide gel was used for the MAC because of its high molecular weight. Separation was performed for 11 hours at 25 V in the cold, and the transfer to membranes conducted at 50 V for 11 hours, again in the cold.
Membranes were blocked in 5% skim milk for 2 hours. The immunoblots were then treated for 2 hours at room temperature with a primary antibody, followed by treatment for 1 hour with an appropriate secondary antibody labeled with horseradish peroxidase. Immunoreactivity was visualized by incubation with Supersignal CL-HRP chemiluminescent substrate (Pierce Chemical Co., Rockford, IL). The antibodies used for detection of the complement proteins were as previously described. 22 Sheep anti-CRP (1:1,000 dilution) was obtained from Wako, mouse anti-HLA-DR1: 100 from DAKO (Carpinteria, CA), and mouse anti-CD11b (1:100) from Serotec (Raleigh, NC).
C4 and CRP cRNA probes were prepared starting with the RT-PCR products. The 256-bp C4 cDNA fragment was subcloned into the pGEM-T Easy plasmid vector (Promega, Madison, WI). The product was linearized with SpeI and NcoI (NEB) to produce sense and antisense DNA templates, respectively. The C4 cRNA probes were synthesized at 37°C for 3 hours in a mixture composed of 1 μg of linearized template DNA; 2 μl of ATP, CTP, GTP, and digoxigenin (DIG)-labeled UTP; 2 μl of transcription buffer; and 20 U RNase inhibitor with 20 U T7 RNA polymerase for the sense strand or 20 U SP6 RNA polymerase for the antisense strand (DIG RNA labeling kit SP6/T7; Roche, Laval, PQ, Canada). The 440-bp CRP cDNA fragment was similarly treated to produce sense and antisense CRP cRNA probes.
After labeling, the C4 and CRP cRNA probes were treated with 10 U of RNase-free DNase I for 45 minutes at 37°C, ethanol-precipitated, and resuspended in diethyl pyrocarbonate-treated distilled water containing 20 U of RNase inhibitor. The transcripts were analyzed on agarose gels after ethidium bromide staining, and the yields were estimated densitometrically by comparison with a control RNA of known concentration. Immunohistochemical detection of DIG-labeled RNAs on nylon membranes (Hybond-N+; Amersham, Buckinghamshire, UK) revealed equivalent labeling efficiency between sense and antisense cRNAs.
In situ hybridization was performed on paraformaldehyde-fixed, paraffin-embedded blocks of tissue. Seven-micron sections were mounted on silane-coated slides, deparaffinized with xylene, and rehydrated in a graded series of ethanol solutions (100%, 95%, 90%, 85%, 80%, and 70% in diethyl pyrocarbonate-treated distilled water) for 5 minutes at each step and treated with 2 μg/ml of proteinase K (Sigma, Oakville, ON) at 37°C for 1 hour. They were further fixed for 1 hour in 4% paraformaldehyde at 4°C, followed by treatment with 0.25% acetic anhydride in 0.1 mol/L of triethanolamine (pH 8.0). The sections were washed with phosphate-buffered saline before dehydration in a graded series of ethanol as described above for 30 seconds at each step.
The sections were prehybridized for 2 hours at 50°C in a hybridization mixture (50% deionized formamide, 10 mmol/L Tris, pH 7.4, 200 μg/ml yeast tRNA, 1× Denhardt’s solution, 10% dextran sulfate, 600 mmol/L NaCl, 0.25% sodium dodecyl sulfate, and 1 mmol/L ethylenediaminetetraacetic acid). The probes (30 ng/ml) were added to the hybridization mixture, which was heated at 80°C for 10 minutes and cooled before addition to the tissue sections.
Hybridization was performed for 16 hours at 50°C in a humidified chamber. Test sections were hybridized with the antisense cRNA probes, and controls were probed with the sense cRNA probes. After hybridization, the sections were washed twice with 50% deionized formamide in 2× standard saline citrate at 55°C for 30 minutes, followed by incubation with 20 μg/ml RNase A (Sigma Chemical Co., St. Louis, MO) for 30 minutes at 37°C. After washing in 2× standard saline citrate for 20 minutes and then in 0.2× standard saline citrate for 20 minutes twice at 55°C, the sections were incubated in a blocking buffer containing 1.5% blocking reagent (DIG nucleic acid detection kit; Roche), 100 mmol/L Tris, pH 7.5, and 150 mmol/L NaCl overnight at 4°C. Alkaline phosphatase-conjugated anti-DIG antibody (Roche) diluted 1:1,000 in blocking buffer was incubated with sections overnight at 4°C. Before detection of alkaline phosphatase/DIG-labeled RNAs, sections were prewashed in 100 mmol/L Tris, pH 9.5, 100 mmol/L NaCl, and 50 mmol/L MgCl2, and then incubated for 0.5 to 5 hours in the dark at 4°C in color substrates (nitro blue tetrazolium salt and 5-bromo-4-chloro-3-indolyl-phosphate toluidine salt in dimethylformamide) diluted in the prewash buffer as described by the manufacturer. Once the desired color intensity was attained, the color reaction was stopped by washing the sections in 10 mmol/L Tris/1 mmol/L ethylenediaminetetraacetic acid, pH 8.0. The slides were photographed.
Histochemistry and immunohistochemistry were performed on paraffin-embedded, formalin-fixed tissue. Gomori trichrome staining was performed on 7-μm sections mounted on glass slides as previously described. 24 Immunohistochemistry for high molecular weight caldesmon using monoclonal antibody (mAb) clone h-CD (1:400, DAKO) was done on slide-mounted 7-μm sections by automated immunostaining (Ventana Immunostainer, Tucson, AZ) after microwave retrieval of the antigen. Slides were counterstained with hematoxylin.
Immunohistochemistry for HLA-DR and C5b-9 was performed as previously described in detail. 22-24 Paraffin sections were cut at 18-μm thickness, deparaffinized, and immunostained as free floating sections. HLA-DR was identified using the mAb CR3/43 (1:1000, DAKO) 26 and sC5b-9 using a Quidel (San Diego, CA) mAb (1:1000).
Immunostaining for CRP was performed using a rabbit polyclonal antibody (1:20,000; DAKO). Sections were first pretreated with 100% formic acid for 3 minutes and then treated by standard procedures. 22-24
The data were analyzed by analysis of variance followed by Student’s t-test. The data were also analyzed by the matched-pair method, comparing in each case plaque tissue, normal artery, and liver. A correction was made in each instance for multiple comparisons using the Holm’s step-down procedure. 27 Data were analyzed without correction and also after normalization to the cyclophilin value for the tissue obtained in a parallel amplification. Because of the very small variation in cyclophilin values, the statistical significances were identical. Regression analysis was used to determine whether there was any correlation of the CRP or C4 mRNA level with postmortem delay.
Results
Single bands of the predicted base-pair size were obtained for all of the PCR products on ethidium bromide-stained electrophoretic gels. Their structures were confirmed by digestion with endonucleases having specific cut sites within the amplified product. Fragments of the correct size and number were obtained as specified in Table 2 ▶ for CRP, CD11b, and HLA-DR and as previously published 22 for the complement components, C1q to C9.
Figure 1 ▶ shows Polaroid photographs of ethidium bromide-stained gels demonstrating RT-PCR products for CRP, CD11b, HLA-DR, and the complement proteins C1q to C9. Figure 1A ▶ shows that CRP mRNA is produced in heart, liver, kidney, spleen, and normal artery. There is intense up-regulation in atheromatous plaque material. Similar results are found for the mRNAs of CD11b (Figure ▶ 1B) and HLA-DR (Figure 1C) ▶ . Polaroid photographs of gels for the mRNAs of C1q through C9 are shown only for normal artery and atheromatous plaque material because we have previously reported on the detection of C1q to C9 mRNAs in heart, liver, spleen, and kidney. 22-24 Notice the more intense bands for all of the complement mRNAs in atherosclerotic plaque material compared with normal artery.
Figure 1.
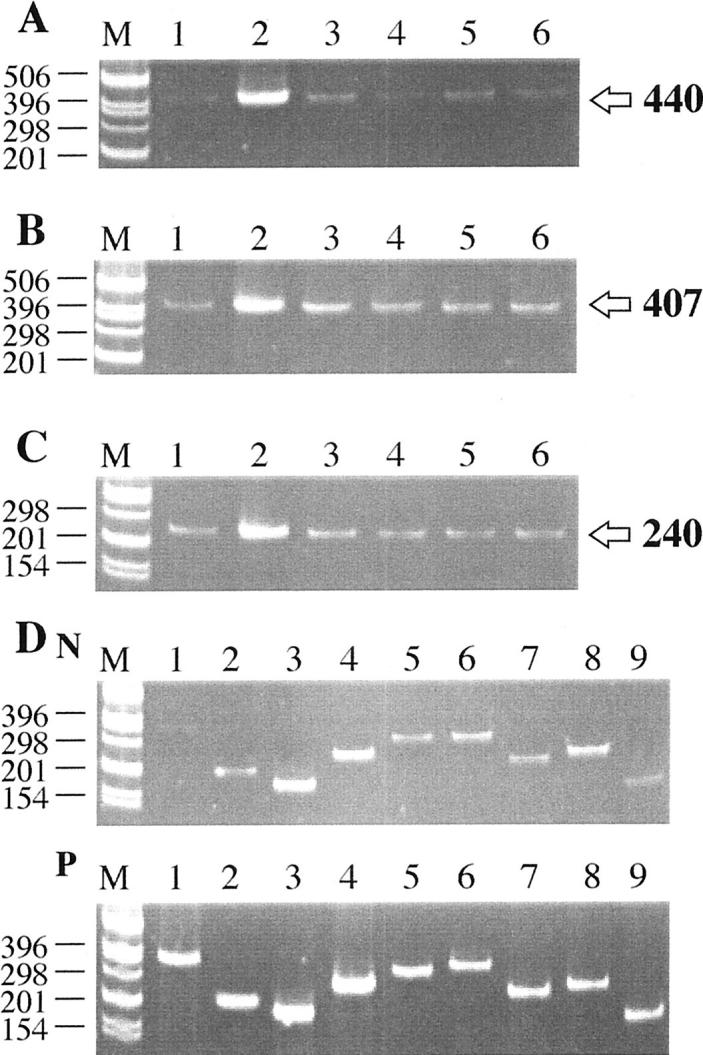
Representative Polaroid photographs showing ethidium bromide-stained gels of RT-PCR products. A: CRP; B: CD11b; C: HLA-DR; D: complement components. In each Polaroid photograph, size markers are in lane M, with the sizes themselves being indicated on the left. Arrows on the right point to the size of PCR products. A, B, and C: Lane 1, normal artery; lane 2, plaque tissue; lane 3, liver; lane 4, heart; lane 5, kidney; lane 6, spleen. Notice in A that faint bands are obtained in all normal tissues, with an extremely intense band being obtained for plaque tissue (lane 2). In B, notice somewhat stronger bands for CD11b in all tissues, again with an intense band for atherosclerotic plaque tissue (lane 2). In C, notice a similar appearance of bands in all normal tissues, again with an intense band for HLA-DR in plaque tissue (lane 2). D: lane 1, C1q (358 bp); lane 2, C2 (215 bp); lane 3, C3 (186 bp); lane 4, C4 (256 bp); lane 5, C5 (315 bp); lane 6, C6 (338 bp); lane 7, C7 (248 bp); lane 8, C8 (258 bp); lane 9, C9 (180 bp). N stands for normal artery (above) and P for plaque tissue (below). Notice that considerably more intense bands are obtained for all of the complement components in plaque tissue compared with normal artery, especially for C1q (lane 1) and C9 (lane 9).
Figure 2 ▶ shows Western blots in normal versus plaque material for CRP, CD11b, HLA-DR, and for the complement proteins. Strong bands were obtained in plaque extracts for CRP at the expected molecular weight of ∼28 kd 28 (Figure 2A) ▶ , for CD11b at the expected molecular weight of 155 kd 29 (Figure 2B) ▶ , and for HLA-DR at the expected molecular weight of 35 kd 30 (Figure 2C) ▶ . Strong bands were also observed for all of the complement proteins at molecular weights previously published (Figure 2D) ▶ . 22,24 In addition, strong bands were obtained for the activated complement fragments C4d, C3d, and C5b-9. These data show that the mRNAs were being translated into their protein products. They also indicate a sharp up-regulation in plaques, with full activation of the classical complement pathway, including formation of the MAC.
Figure 2.
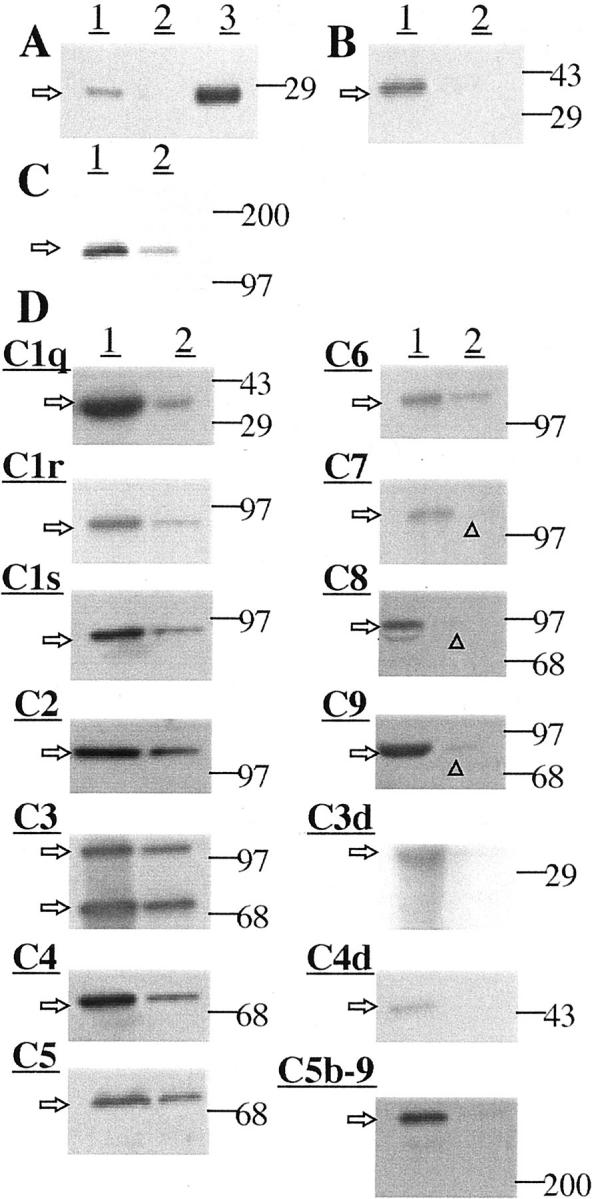
Western blot data for protein extracts of various tissues (see Materials and Methods for details). Arrows on the left indicate the size of observed bands; lines on the right point to the positions of size markers used to estimate molecular weights. A: Detection of CRP. Lane 1, plaque extract; lane 2, normal arterial extract; lane 3, 0.5 μg of CRP protein as a standard. Notice a detectable band at ∼ 28 kd in plaque extract. There was no detectable band in normal arterial extract. An intense band was obtained for 0.5 μg of CRP standard. B: Detection of CD11b. Lane 1, atherosclerotic plaque extract; lane 2, normal arterial extract. A strong band was obtained for atherosclerotic plaque extract, at ∼155 kd with no detectable band for normal arterial extract. C: Detection of HLA-DR. Lane 1, atherosclerotic plaque extract; lane 2, normal arterial extract. A strong band of ∼35 kd was obtained in plaque extract, and a weak band for normal arterial extract. D: Detection of complement proteins. In all cases, lane 1 is for atherosclerotic plaque extract and lane 2 for normal arterial extract. Strong bands were obtained for all components in atherosclerotic plaque extracts (C1q, ∼35 kd; C1r, ∼85 kd; C1s, ∼85 kd; C2, ∼110 kd; C3, ∼115, 75 kd; C4, ∼75 kd; C5, ∼75 kd; C6, ∼120 kd; C7, ∼115 kd; C8, ∼85 kd; C9, ∼80 kd). Also detected were bands for the activated complement fragments C3d, ∼35 kd; C4d, ∼45 kd; and C5b-9. Weaker bands were obtained for normal arterial tissue, except for the activated components C3d, C4d, and C5b-9. The very faint bands are indicated by arrowheads.
Table 3 ▶ gives quantitative mRNA values for each of the complement components, CRP, CD11b, HLA-DR, and cyclophilin. The standard error for cyclophilin values was <0.5%, indicating that factors related to postmortem delay, underlying disease, and agonist cause of death had little influence on the values. Large differences were always observed between values for plaques and normal arteries, so that the differences were highly significant, with P values ranging from 0.0003 to 0.0114 (Table 3) ▶ . In contrast, the standard errors for both normal and plaque tissue were relatively low, in most cases being <10%. The greatest up-regulation was for CRP where a 10.2-fold increase of plaque versus normal artery was observed. Values normalized to cyclophilin were similarly analyzed, but the corrections were so small that there was no influence on the significance of the differences.
Table 3.
Levels of the mRNAs (Mean ± SEM) for the Various Components Studied in Normal and Atheromatous Arterial Tissue
| mRNA | Arterial tissue | Ratio | Analysis of variance | |||
|---|---|---|---|---|---|---|
| Normal | Plaque | P* | t | t for pairs | ||
| C1q | 3.82 ± 0.68 | 20.64 ± 3.40 | 5.40 | 0.0003 | 4.846 | 4.542 |
| C1r | 8.54 ± 0.69 | 19.93 ± 1.46 | 2.33 | 0.0009 | 7.063 | 12.537 |
| C1s | 3.43 ± 0.52 | 17.53 ± 1.59 | 5.11 | 0.0013 | 8.417 | 8.208 |
| C2 | 5.85 ± 0.88 | 19.32 ± 1.27 | 3.30 | 0.0014 | 8.732 | 6.961 |
| C3 | 44.28 ± 1.57 | 52.80 ± 2.30 | 1.19 | 0.0114 | 3.062 | 8.584 |
| C4 | 34.90 ± 0.94 | 46.69 ± 1.98 | 1.34 | 0.0005 | 5.381 | 8.716 |
| C5 | 5.02 ± 0.49 | 13.91 ± 1.24 | 2.77 | 0.0008 | 6.679 | 5.418 |
| C6 | 6.87 ± 0.53 | 13.86 ± 1.20 | 2.07 | 0.0004 | 5.340 | 5.907 |
| C7 | 11.43 ± 0.96 | 24.08 ± 1.31 | 2.10 | 0.0011 | 7.793 | 7.915 |
| C8 | 5.46 ± 0.70 | 19.57 ± 1.65 | 3.58 | 0.0012 | 7.872 | 7.601 |
| C9 | 3.08 ± 0.89 | 18.47 ± 1.87 | 6.00 | 0.0010 | 7.421 | 6.559 |
| CRP | 2.48 ± 0.45 | 25.38 ± 2.40 | 10.23 | 0.0015 | 9.364 | 9.750 |
| CD11b | 8.41 ± 0.90 | 19.70 ± 2.14 | 2.34 | 0.0006 | 4.683 | 4.773 |
| HLA-DR | 7.65 ± 1.25 | 27.35 ± 2.82 | 3.57 | 0.0007 | 6.394 | 5.644 |
| Cyclophilin | 80.81 ± 0.47 | 80.52 ± 0.34 | 0.627 | 0.492 | 0.836 | |
*Corrected for multiple comparisons by Holm’s step-down procedure. 27
Normal arterial tissue was taken adjacent to the plaque area. This permitted each case to serve as its own control. Paired analyses were done by the Student’s t-tests for plaque versus normal artery (Table 3) ▶ , and highly significant increases were obtained for each of the mRNAs in plaque compared with normal tissue. Significant increases were also found by paired analyses for the mRNAs of CRP (P < 0.001) and HLA-DR (P < 0.02) in plaque tissue compared with liver although complement and CD11b mRNA levels were similar. Regression analysis showed no significant correlation of postmortem delay with CRP mRNA levels in liver (P = 0.57), normal artery tissue (P = 0.69), or plaque tissue (P = 0.12). The same was true for C4 mRNA levels with the respective P values being 0.36, 0.69, and 0.24.
Table 4 ▶ gives data for the mRNAs of each of the complement components, CRP, CD11b, HLA-DR, and cyclophilin for the various organs. Normal appearing organ tissue was taken in each case. Again, the data of Table 4 ▶ show little variation in cyclophilin for each organ. They also show that liver had the highest base levels of all of the components measured, but that the mRNAs were also present in all organs, indicating local synthesis. However, in none of these cases was the synthesis of complement components, CRP, HLA-DR, or CD11b as high as in plaque tissue.
Table 4.
Levels of the mRNAs (Mean ± SEM) for the Various Components Studied in Liver, Heart, Spleen, and Kidney
| mRNA | Liver | Heart | Spleen | Kidney |
|---|---|---|---|---|
| C1q | 10.60 ± 1.30 | 2.38 ± 0.43 | 3.86 ± 1.17 | 3.85 ± 1.11 |
| C1r | 20.68 ± 2.10 | 11.99 ± 2.19 | 12.22 ± 1.79 | 12.56 ± 1.80 |
| C1s | 23.84 ± 1.14 | 12.46 ± 1.27 | 12.24 ± 1.24 | 11.61 ± 0.84 |
| C2 | 14.97 ± 1.10 | 10.99 ± 0.99 | 11.64 ± 0.94 | 13.42 ± 1.14 |
| C3 | 59.01 ± 2.32 | 28.71 ± 1.10 | 31.61 ± 1.27 | 36.63 ± 1.52 |
| C4 | 55.34 ± 2.39 | 27.43 ± 1.01 | 30.10 ± 1.74 | 36.87 ± 2.10 |
| C5 | 11.17 ± 0.88 | 6.34 ± 0.54 | 10.98 ± 0.72 | 11.28 ± 0.67 |
| C6 | 12.77 ± 0.88 | 5.44 ± 0.68 | 9.13 ± 1.25 | 8.11 ± 0.48 |
| C7 | 21.57 ± 1.25 | 6.25 ± 0.81 | 11.11 ± 0.73 | 10.88 ± 0.92 |
| C8 | 22.02 ± 1.07 | 6.16 ± 0.50 | 4.54 ± 0.63 | 6.02 ± 0.73 |
| C9 | 19.01 ± 1.59 | 3.10 ± 0.46 | 2.43 ± 0.32 | 3.22 ± 0.63 |
| CRP | 4.25 ± 0.43 | 1.04 ± 0.22 | 1.50 ± 0.22 | 2.03 ± 0.45 |
| CD11b | 14.11 ± 1.41 | 7.71 ± 0.70 | 10.32 ± 1.20 | 11.56 ± 1.15 |
| HLA-DR | 14.04 ± 1.09 | 6.81 ± 0.48 | 11.71 ± 1.07 | 9.60 ± 0.88 |
| Cyclophilin | 97.03 ± 0.44 | 99.93 ± 0.51 | 99.91 ± 0.32 | 98.00 ± 0.25 |
Figures 3, 4, 5, and 6 ▶ ▶ ▶ , show results of in situ hybridization, as well as histochemical and immunohistochemical staining of plaque versus normal arterial tissue. Figure 3 ▶ illustrates the cellular makeup of plaque and normal arterial tissue. Figure 3A ▶ shows a low-power photomicrograph of a branch of the iliac artery that is trichrome stained. The area contains a classical plaque where the thickened intima has peeled away from the media in the shoulder region, leaving an isolated tongue of the plaque. The fibrous cap shows elongated smooth muscle-derived cells as well as round and ovoid macrophages, all of which are red stained. The swollen intima is relatively acellular and contains mostly green-stained collagen. Figure 3B ▶ is of the area near the peeled shoulder at higher power, showing many elongated muscle cells and round or ovoid macrophages, all of which appear as red-stained cells. Figure 3C ▶ is a high-power photomicrograph of caldesmon immunostaining, identifying the thin elongated cells proliferating in the plaque tissue to be of smooth muscle as opposed to macrophage origin. Figure 3D ▶ is a companion high-power photomicrograph showing HLA-DR staining of macrophages. The cells are quite different in morphology, being round or ovoid with occasional short processes. Figure 3E ▶ illustrates another plaque area from a surgically removed endarterectomized carotid artery. It illustrates a fibrous cap over an acellular swollen intima with the surrounding areas being highly cellular. Figure 3F ▶ shows a cross-section of normal aorta. There is no intimal thickening, and no large deposits of collagen are visible. There is the normal thin intimal layer and larger fibroelastic medial layer containing elongated smooth muscle cells.
Figure 3.
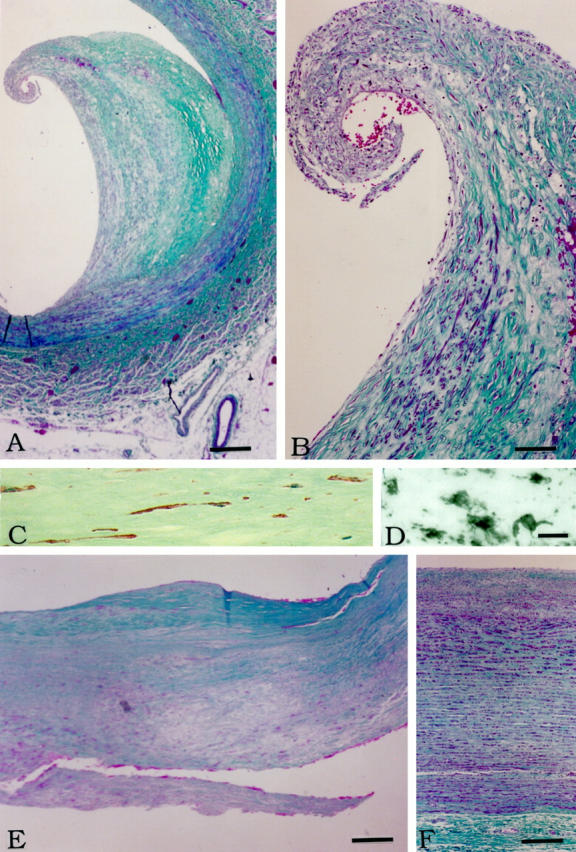
Histochemistry and immunohistochemistry of plaque and normal arterial tissue. A: Low-power photomicrograph of a mature plaque stained by the Gomori trichrome method. The lumen is to the left. Notice how the swollen intima has peeled from the media starting near the shoulder region. Muscle stains deep red. Collagen fibers stain green. Endothelial cells and macrophages stain red. B: Higher power photomicrograph of the peeled region shown in A. Elongated cells of smooth muscle origin are abundant in the fibrous cap. Many round cells also appear in the hypertrophied tissue. C: High-power photomicrograph of the intimal region shown in B immunostained for caldesmon (red color), a marker for smooth muscle cells (see Material and Methods for details). Notice the elongated cell morphology. The section is weakly counterstained with hematoxylin to display nuclei (light blue color). D: High-power photomicrograph of the same region as in C immunostained for HLA-DR to reveal macrophages (see Materials and Methods for details). Notice the differing morphology of the cells. They are round or ovoid, sometimes with short thick processes. E: Low-power photomicrograph of the intima of carotid plaque tissue removed at endarterectomy stained by the Gomori trichrome method. The lumen is toward the top. Notice the fibrous cap (green) over an acellular lipid region. F: Gomori stain of normal aorta. The lumen is toward the top. Scale bars: 500 μm (A), 50 μm (B), 25 μm (C and D), 250 μm (E), 100 μm (F).
Figure 4.

In situ hybridization for CRP and C4 mRNAs. A: Medium-power photomicrograph of the area shown in Figure 3B ▶ hybridized with the CRP antisense probe. Many cells are positive. B: Low-power photomicrograph of the area shown in Figure 3A ▶ hybridized with the CRP sense probe. No signal is seen. C: High-power photomicrograph of hybridization with the CRP antisense probe showing positive cells with both myocyte-like and macrophage morphology. Compare the morphology with Figure 3, C and D ▶ . D: Medium-power photomicrograph of the area shown in Figure 3B ▶ hybridized with the C4 antisense probe. Many cells are positive. E: Low-power photomicrograph of the area shown in Figure 3A ▶ hybridized with the C4 sense probe. No signal is seen. F: High-power photomicrograph of hybridization with the C4 antisense probe showing positive cells with myocyte-like and macrophage morphology. G: In situ hybridization with CRP antisense probe in normal aorta (same area as Figure 3F ▶ ). Only faint signals are detected. H: In situ hybridization of the same area of normal aorta with the CRP sense probe. No signal is seen. I: In situ hybridization of the same area of normal aorta with the C4 antisense probe. Only faint signals are detected. J: In situ hybridization of the same area of normal aorta with the sense C4 probe. No signal is seen. Scale bars: D (for A and D), 100 μm; E (for B and E), 250 μm; F (for C and F), 25 μm; J (for G–J), 100 μm.
Figure 5.

Comparison of in situ hybridization and immunohistochemistry. A: In situ hybridization with the CRP antisense probe of endarterectomized carotid artery. The area is the same as in Figure 3E ▶ . Notice the intense but patchy hybridization, especially of elongated myocyte-like cells in the fibrous cap area and near the edges of the acellular lipid deposit. B: In situ hybridization of the same area with the C4 antisense probe. Similar hybridization is seen. C: Same area immunostained for sC5b-9. Many elongated cells are immunostained indicating that complement has been fully activated, with the MAC associating with myocyte-like cells in the area generating CRP and C4 mRNAs. D: Higher power photomicrograph of the same area immunostained for CRP. Positive cells with both elongated and round morphology are seen. E: Same area immunostained for sC5b-9. Cells of elongated morphology are primarily immunostained, indicating activation of the complement pathway in the same areas generating CRP protein. Scale bars, C (for A–C), 250 μm; E (for D and E), 100 μm.
Figure 4 ▶ shows CRP and C4 in situ hybridization results of the same area shown in Figure 3B ▶ . Figure 4A ▶ is a medium-power photomicrograph of in situ hybridization with the CRP antisense probe. Abundant staining can be seen in the shoulder area. Figure 4B ▶ shows that no signal is seen using the CRP sense probe. Figure 4C ▶ shows a high-power photomicrograph, illustrating the cellular morphology of the hybridizing cells. Elongated muscle-like cells are positive, as well as round cells with a macrophage-like morphology similar to the cells shown in Figure 3, C and D ▶ . This indicates that both types of cells are generating CRP.
Figure 4, D–F ▶ , shows comparable in situ data for C4 on sections nearby to those illustrated in Figure 4, A–C ▶ . Figure 4D ▶ shows in situ hybridization at medium power using the antisense C4 probe. An intense signal is observed over cells in the shoulder area. Figure 4E ▶ shows that no signal is obtained using the C4 sense probe. Figure 4F ▶ is a higher power photomicrograph of the shoulder area illustrating many positive elongated cells and some round cells, similar to those hybridizing positively for CRP mRNA. Figure 4, G and H ▶ , shows CRP in situ hybridization of normal aorta using the antisense (Figure 4G) ▶ and sense (Figure 4H) ▶ probes. The area corresponds to that shown in Figure 3C ▶ . Only faint signals are picked up by the antisense probe, whereas no signal is seen with the sense probe. Figure 4, I and J ▶ , show C4 in situ hybridization of the same area. Again, a faint signal is picked up with the antisense probe but none with the sense probe. These results show that normal smooth-muscle arterial tissue contains low amounts of CRP and C4 mRNAs in keeping with the RT-PCR results of Figures 1 and 2 ▶ ▶ and Table 3 ▶ .
Figure 5 ▶ shows comparisons of in situ hybridization and immunohistochemistry from the carotid plaque area shown in Figure 3E ▶ . Figure 5A ▶ shows in situ hybridization of a shoulder area with the antisense CRP probe. Intense staining of a patchy nature is visible. Figure 5B ▶ shows in situ hybridization of the same area in a nearby section using the C4 antisense probe and there is highly similar staining. Figure 5C ▶ is another nearby section immunostained for sC5b-9. This illustrates that activation of the complement pathway has occurred in the same regions showing up-regulation of CRP and C4 mRNAs. Figure 5D ▶ shows the same region immunostained for CRP and Figure 5E ▶ for sC5b-9. The immunostaining is highly similar. This confirms earlier reports of co-localization of CRP and the MAC 13 and extends them by showing endogenous production of the key components.
Figure 6 ▶ shows in situ hybridization for CRP and C4 in liver sections from a typical case. Detectable signals with the antisense probes for both CRP and C4 were observed over hepatocytes, but the signals were considerably weaker than those from plaque tissue as shown in Figures 4 and 5 ▶ ▶ . These findings are consistent with the mRNA data of Tables 3 and 4 ▶ ▶ , indicating up-regulation of the mRNAs in plaque tissue but not in liver. Signals were not detected in vessel leukocytes either in liver or plaque tissue.
Figure 6.
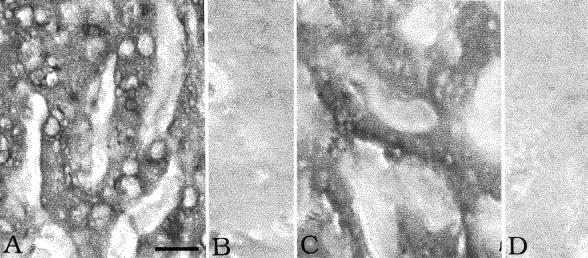
In situ hybridization in liver. A: CRP antisense probe. B: CRP sense probe. C: C4 antisense probe. D: C4 sense probe. Notice the hybridization signal over hepatocytes with both antisense probes but no signal with the sense probes. Same magnification in each photomicrograph. Scale bar, 30 μm (A).
Discussion
The data presented here demonstrate that key inflammatory molecules are synthesized within atherosclerotic lesions. These include complement proteins and CRP, previously believed to be mainly produced in the liver 31,32 and delivered to plaques by serum. It has long been known that activated complement is present in atherosclerotic plaques. 3,4,13,33,34 The assumption has usually been made that complement proteins diffuse from serum into the arterial wall. Various proposals have been made regarding the mechanism of complement activation, including cholesterol deposits, 35 circulating immune complexes, 33 immunoglobulins directed against altered arterial structures, 33 enzymatically modified low density lipoprotein, 36 and CRP. 13
Our results confirm previous reports of full activation of the classical complement pathway within plaques, 33-36 including co-localization of the MAC with CRP. 13 Our data support the concept of simple activation of the classical pathway by CRP. 13 They are not consistent with mechanisms based only on lipid activation of the alternative pathway . 37 CRP is known to activate complement both in vitro 11 and in vivo. 12 It co-localizes with activated complement in acute myocardial infarction 38 as well as plaques. It also appears in association with activated complement in the plaque-associated lesions of Alzheimer’s disease. 21 There is evidence that the MAC itself induces CRP deposition, 13,39 suggesting a self-perpetuating mechanism. Available anti-inflammatory agents such as NSAIDs might be helpful in interrupting such a cycle, but more appropriate targets for future intervention might be blocking CRP or inhibiting full activation of the complement system. Further studies of the close association of CRP and activated complement, particularly the MAC, in a wide spectrum of chronic inflammatory disorders is clearly warranted.
In our series, the causes of death and postmortem delay varied widely from case to case, but the mRNA values for the various inflammatory markers show that these were noncontributory factors. A point worth noting is the remarkable stability of many mRNAs postmortem, a finding we have previously noted, 22,24 and one that has been reported by others. 40,41 The levels of cyclophilin mRNA were almost constant in a given tissue regardless of postmortem delay. Furthermore, analysis of CRP mRNA levels in normal arterial tissue, plaque tissue, and liver as a function of postmortem delay showed no correlation. Finally, most cases studied served as their own control because nearby normal arterial tissue was taken in comparison with plaque material. Statistical analysis of these paired samples yielded probability values little different from those obtained by analysis of variance. This is because comparably low values were always observed in normal arterial tissue and comparably high values in atheromatous tissue. The housekeeping gene cyclophilin varied by <1% between all values, whether from normal or atheromatous tissue, so that statistical differences were similar whether raw data or data normalized to cyclophilin values were used.
The increase of mRNAs was accompanied by increases in the protein products as evidenced by the Western blots of Figure 2 ▶ . Thus, the induction of mRNAs, which is presumably on a sustained basis, is also reflected in sustained protein production.
The mRNA increase in plaque compared with normal arterial tissue was somewhat higher for HLA-DR than CD11b (Table 3 ▶ , ratio of 3.57 versus 2.34). HLA-DR is expressed on macrophages and dendritic cells but not on neutrophils. CD11b is expressed on all phagocytic cells that includes macrophages and neutrophils. It has been reported that up to 26% of HLA-DR-positive cells in plaque tissue are desmin-positive 42 and that in culture smooth muscle arterial cells can be induced to express HLA-DR by γ-interferon. 43 Thus part of our observed HLA-DR increase could be because of expression on transformed smooth-muscle cells that could account for the greater increase in HLA-DR compared with CD11b. However, much of the increase of HLA-DR, as well as CD11b, presumably reflects the increased number of macrophages in plaque tissue as shown immunohistochemically (Figure 3) ▶ . CD11b, of course, is a receptor for complement opsonized targets, so there is a powerful ligand-receptor interaction in the plaque tissue.
The in situ hybridization and immunohistochemical results confirm the mRNA and Western blot data. They further identify the cell types that are generating the proteins. These are macrophages and endogenous arterial cells that are proliferating predominantly in the deep intimal layer and the fibrous cap. The exact nature of these cells is uncertain. They are characterized by many smooth muscle cell markers, 44 as evidenced here by caldesmon. 45,46 However, they have clearly been induced to express high levels of proteins such as C4 and CRP. They may relate to the hybrid cell described as a myofibroblast. 47 Clearly, further investigation is required to characterize the phenotype of these cells. Suppressing their inflammatory secretions may have potential in retarding evolution of the plaques and subsequent thrombotic events.
Macrophages have previously been reported to generate CRP. 48 Macrophages have also been reported to produce all of the classical complement pathway proteins, 49 so identification of these cells producing CRP and C4 in plaque tissue is not surprising.
Complement proteins and CRP are known to be produced by hepatocytes, as confirmed here by the in situ hybridization results of Figure 6 ▶ . The weaker signals from liver compared with plaque tissue are consistent with the lower levels of the mRNAs. There seemed to be no significant contribution from circulating leukocytes. Within plaque tissue, hybridization was not observed over capillaries or other vessels and mRNA levels were low in the spleen where leukocytes are concentrated.
We have previously shown high up-regulation of CRP, and activation of the complement system in the absence of antibodies, in Alzheimer’s disease brain tissue, 21 , 22 myocardial infarcts, 24 and isolated rabbit hearts subjected to reperfusion injury. 23 All of these findings relate to the generality of complement up-regulation and activation in certain types of tissue injury, independently of antibodies generated by the adaptive immune system.
After a heart attack or stroke, serum CRP shows dramatic increases. It may be that these increases are primarily because of secretion from injured tissue and not from liver. Lesser amounts may be continuously released from atheromatous tissue. In this event, slight but persistent increases in serum CRP might reflect the atheromatous burden in an apparently healthy individual and thus be a predictor of a subsequent heart attack or stroke. Evidence supporting this concept can be found in a number of epidemiological studies showing that mild increases in serum CRP predict subsequent myocardial infarctions 14,32-39,50-55 and peripheral vascular disease. 54 They indicate the extent of risk at the time of hospital admission for acute coronary syndromes. 56-60 They also predict survival after a heart attack 17 or stroke. 61 Ridker and colleagues 62 in a prospective, nested, case-control study among 28,263 postmenopausal women, found serum CRP to be the strongest predictor of 12 markers tested for subsequent cardiovascular complications, including coronary heart disease, myocardial infarct, and stroke. Taken together, these data suggest that anti-inflammatory therapy may be effective in retarding atherosclerotic plaque development and the vascular complications that follow.
Acknowledgments
We thank Drs. John English and Blake Gilks as well as Julie Chow of the Pathology Department of the University of British Columbia for assistance in obtaining tissue and carrying out some of the routine staining.
Footnotes
Address reprint requests to Dr. Patrick L. McGeer, Kinsmen Laboratory of Neurological Research, University of British Columbia, Vancouver, B.C. V6T 1Z3 Canada. E-mail: mcgeerpl@interchange.ubc.ca.
Supported by grants from the Jack Brown and Family Alzheimer’s Disease Research Fund, as well as donations from Friends of the University of British Columbia and individual British Columbians.
References
- 1.Ross R: Atherosclerosis: an inflammatory disease. N Engl J Med 1999, 340:115-126 [DOI] [PubMed] [Google Scholar]
- 2.Constantinides P: General Pathobiology. 1994:pp 59-116 Appleton & Lange, Norwalk
- 3.Seifert PS, Kazatchkine MD: The complement system in atherosclerosis. Atherosclerosis 1988, 73:91-104 [DOI] [PubMed] [Google Scholar]
- 4.Torzewski J, Bowyer DE, Waltenberger J, Fitzsimmons C: Processes in atherogenesis: complement activation. Atherosclerosis 1997, 132:131-138 [DOI] [PubMed] [Google Scholar]
- 5.Libby P, Egan D, Skarkatos S: Roles of infectious agents in atherosclerosis and restenosis: an assessment of the evidence and need for future research. Circulation 1997, 96:4095-4103 [DOI] [PubMed] [Google Scholar]
- 6.Hendrix MG, Salimans MM, van Boven CP, Bruggeman CA: High prevalence of latently present cytomegalovirus in arterial walls of patients suffering from grade III atherosclerosis. Am J Pathol 1990, 136:23-28 [PMC free article] [PubMed] [Google Scholar]
- 7.Jackson LA, Campbell LA, Schmidt JT, Kuo CC, Cappuccio AL, Lee MJ, Grayston JT: Specificity of detection of Chlamydia pneumoniae in cardiovascular atheroma: evaluation of the innocent bystander hypothesis. Am J Pathol 1997, 150:1785-1790 [PMC free article] [PubMed] [Google Scholar]
- 8.Melnick JL, Adam E, Debakey ME: Cytomegalovirus and atherosclerosis. Eur Heart J 1993, 14(suppl. K):S30-S38 [PubMed] [Google Scholar]
- 9.Reynolds GD, Vance RP: C-reactive protein immunohistochemical localization in normal and atherosclerotic human aortas. Arch Pathol Lab Med 1987, 111:265-269 [PubMed] [Google Scholar]
- 10.Hatanaka K, Li XA, Masuda K, Yutanii C, Yamamoto A: Immunohistochemical localization of C-reactive protein binding sites in human aortic lesions by a modified streptavidin-biotin-staining method. Pathol Int 1995, 45:635-641 [DOI] [PubMed] [Google Scholar]
- 11.Siegel J, Rent R, Gewurz H: Interactions of C-reactive protein with the complement system. J Exp Med 1974, 140:631-637 [DOI] [PMC free article] [PubMed] [Google Scholar]
- 12.Wolbink GJ, Brouwer MC, Buysmann S, ten Berge IJ, Hack CE: CRP-mediated activation of complement in vivo. J Immunol 1996, 157:473-479 [PubMed] [Google Scholar]
- 13.Torzewski J, Torzewski M, Bowyer DE, Frohlich M, Koenig W, Waltenberger J, Fitzsimmons C, Hombach V: C-reactive protein frequently colocalizes with the terminal complement complex in the intima of early atherosclerotic lesions of human coronary arteries. Arterioscler Thromb Vasc Biol 1998, 18:1386-1392 [DOI] [PubMed] [Google Scholar]
- 14.Mendall MA, Patel P, Ballam L, Strachan D, Morthfield TC: C-reactive protein and its relation to cardiovascular risk factors: a population based cross sectional study. Br Med J 1996, 312:1061-1065 [DOI] [PMC free article] [PubMed] [Google Scholar]
- 15.Morrow DA, Rifai N, Antman EM, Weiner DL, Mccabe CH, Canno CP, Braunwald E: C-reactive protein is a potent predictor of mortality independently of and in combination with troponin T in acute coronary syndromes. J Am Coll Cardiol 1998, 31:1460-1465 [DOI] [PubMed] [Google Scholar]
- 16.Pietila K, Harmoinen A, Hermens W, Simoons ML, Van de Werf F, Verstraete M: Serum C-reactive protein and infarct size in myocardial infarct in patients with a closed versus an open infarct-related coronary artery after thrombolytic therapy. Eur Heart J 1993, 23:915-919 [DOI] [PubMed] [Google Scholar]
- 17.Pietila K, Harmoinen AP, Jokinitty J, Pasternack AI: Serum C-reactive protein concentration in acute myocardial infarction and its relationship to mortality during 24 months of follow-up in patients under thrombolytic treatment. Eur Heart J 1996, 17:1345-1349 [DOI] [PubMed] [Google Scholar]
- 18.Gabay C, Kushner I: Acute-phase proteins and other systemic responses to inflammation. N Engl J Med 1999, 340:448-454 [DOI] [PubMed] [Google Scholar]
- 19.Lambris JD: The chemistry, biology, and phylogeny of C3. Cruise JM Lewis RE, Jr eds. Complement Today. 1993, :pp 16-45 Karger, Basel [Google Scholar]
- 20.Steel DM, Whitehead AS: The major acute phase reactants: C-reactive protein, serum amyloid P component and serum amyloid A protein. Immunol Today 1994, 15:81-88 [DOI] [PubMed] [Google Scholar]
- 21.Yasojima K, Schwab C, McGeer EG, McGeer PL: Human neurons generate C-reactive protein and amyloid P: upregulation in Alzheimer disease. Brain Res 2000, 887:80-89 [DOI] [PubMed] [Google Scholar]
- 22.Yasojima K, Schwab C, McGeer EG, McGeer PL: Upregulated production and activation of the complement system in Alzheimer’s disease brain. Am J Pathol 1999, 154:927-936 [DOI] [PMC free article] [PubMed] [Google Scholar]
- 23.Yasojima K, Kilgore KS, Washington RA, Lucchesi BR, McGeer PL: Complement gene expression by rabbit heart: upregulation by ischemia and reperfusion. Circ Res 1998, 82:1224-1230 [DOI] [PubMed] [Google Scholar]
- 24.Yasojima K, Schwab C, McGeer EG, McGeer PL: Human heart generates complement proteins that are upregulated and activated after myocardial infarction. Circ Res 1998, 83:860-869 [DOI] [PubMed] [Google Scholar]
- 25.Nakayama H, Yokoi H, Fujita J: Quantification of mRNA by non-radioactive RT-PCR and CCD imaging system. Nucl Acids Res 1992, 20:4939. [DOI] [PMC free article] [PubMed] [Google Scholar]
- 26.Schwab C, Steele JC, McGeer PL: Neurofibrillary tangles of Guam Parkinson-dementia are associated with reactive microglia and complement proteins. Brain Res 1996, 707:196-205 [DOI] [PubMed] [Google Scholar]
- 27.Holm S: A simple sequentially repetitive multiple test procedure. Scand J Statist 1979, 6:65-70 [Google Scholar]
- 28.Kindmark CO, Williams JC: Purification of human C-reactive protein by barium sulfate and preparative agarose electrophoresis. APMIS 1989, 97:891-896 [DOI] [PubMed] [Google Scholar]
- 29.Kantor C, Suomalainen-Nevanlinna H, Patarroyo M, Osterlund K, Bergman T, Jornvall H, Schroeder J, Gahmberg CG: Purification in large scale and characterization of the human leukocyte adhesion glycoprotein GP90 (CD18). Eur J Biochem 1988, 170:653-659 [DOI] [PubMed] [Google Scholar]
- 30.Styren SD, Civin WH, Rogers J: Molecular, cellular and pathologic characterization of HLA-DR immunoreactivity in normal elderly and Alzheimer’s disease brain. Exp Neurol 1990, 110:93-104 [DOI] [PubMed] [Google Scholar]
- 31.Gabay C, Kushner I: Acute-phase proteins and other systemic responses to inflammation. N Engl J Med 1999, 340:448-454 [DOI] [PubMed] [Google Scholar]
- 32.Lagrand WK, Visser CA, Hermens WT, Niessen HWM, Verheugt FWA, Wolbrink GJ, Hack CE: C-reactive protein as a cardiovascular risk factor: more than an epiphenomenon? Circulation 1999, 100:96-102 [DOI] [PubMed] [Google Scholar]
- 33.Niculescu F, Rus H, Cristea A, Vlaicu R: Localization of the terminal C5b-9 complement complex in the human aortic atherosclerotic wall. Immunol Lett 1985, 10:109-114 [DOI] [PubMed] [Google Scholar]
- 34.Niculescu F, Rus HG, Vlaicu R: Immunohistochemical localization of C5b-9, S-protein, C3d and apolipoprotein B in human arterial tissues with atherosclerosis. Atherosclerosis 1987, 65:1-11 [DOI] [PubMed] [Google Scholar]
- 35.Vlaicu R, Niculescu F, Rus HG, Cristea A: Immunohistochemical localization of the terminal C5b-9 complement complex in human aortic fibrous plaque. Atherosclerosis 1985, 57:163-177 [DOI] [PubMed] [Google Scholar]
- 36.Torzewski M, Klouche M, Hock J, Messner M, Dorweiler B, Torzewski J, Gabbert HE, Bhakdi S: Immunohistochemical demonstration of enzymatically modified human LDL and its colocalization with the terminal complement complex in the early atherosclerotic lesion. Arterioscler Thromb Vasc Biol 1998, 18:369-378 [DOI] [PubMed] [Google Scholar]
- 37.Seifert PS, Hugo F, Tranum-Jensen J, Zahringer U, Muhly M, Bhakdi S: Isolation and characterization of a complement-activating lipid extracted from human atherosclerotic lesions. J Exp Med 1990, 172:547-557 [DOI] [PMC free article] [PubMed] [Google Scholar]
- 38.Lagrand WK, Niessen HWM, Wolbink GJ, Jaspars LH, Visser CA, Verheugt FWA, Meijer CJLM, Hack CE: C-reactive protein colocalizes with complement in human hearts during acute myocardial infarction. Circulation 1997, 95:97-103 [DOI] [PubMed] [Google Scholar]
- 39.Li YP, Mold C, Du Clos TW: Sublytic complement attack exposes C-reactive protein binding sites on cell membranes. J Immunol 1994, 152:2995-3005 [PubMed] [Google Scholar]
- 40.Johnson SA, Morgan DG, Finch CE: Extensive postmortem stability of RNA from rat and human brain. J Neurosci Res 1986, 16:267-280 [DOI] [PubMed] [Google Scholar]
- 41.Morrison MR, Griffin WST: The isolation and in vitro translation of undegraded messenger RNAs from human postmortem brain. Anal Biochem 1981, 113:318-324 [DOI] [PubMed] [Google Scholar]
- 42.Jonasson L, Holm J, Skalli O, Gabbiani G, Hansson GK: Expression of class II transplantation antigen on vascular smooth muscle cells in human atherosclerosis. J Clin Invest 1985, 76:125-131 [DOI] [PMC free article] [PubMed] [Google Scholar]
- 43.Warner SJ, Friedman GB, Libby P: Regulation of major histocompatibility gene expression in human vascular smooth muscle cells. Arteriosclerosis 1989, 9:279-288 [DOI] [PubMed] [Google Scholar]
- 44.Sobue K, Hayashi K, Nishida W: Expressional regulation of smooth muscle cell-specific genes in association with phenotypic modulation. Mol Cell Biochem 1999, 190:105-118 [PubMed] [Google Scholar]
- 45.Frid MG, Shekhonin BV, Koteliansky VE, Glukhova MA: Phenotypic changes of human smooth muscle cells during development: late expression of heavy caldesmon and calponin. Dev Biol 1992, 153:185-193 [DOI] [PubMed] [Google Scholar]
- 46.Glukhova MA, Kabakov AE, Frid MG, Ornatsky OI, Belkin AM, Mukhin DN, Orekhov AN, Koteliansky VE, Smirnov YN: Modulation of human aorta smooth muscle cell phenotype: a study of muscle-specific variants of vinculin, caldesmon and actin expression. Proc Natl Acad Sci USA 1988, 85:9542-9546 [DOI] [PMC free article] [PubMed] [Google Scholar]
- 47.Schurch W, Seemayer TA, Gabbiani G: The myofibroblast: a quarter century after its discovery. Am J Surg Pathol 1998, 22:141-147 [DOI] [PubMed] [Google Scholar]
- 48.Dong Q, Wright JR: Expression of C-reactive protein by alveolar macrophages. J Immunol 1996, 156:4815-4820 [PubMed] [Google Scholar]
- 49.Hetland G, Johnson E, Ryset P, Eskeland T: Human alveolar macrophages and monocytes generate the functional classical pathway of complement in vitro. Acta Pathol Microbiol Immunol Scand (B) 1987, 95:117-122 [DOI] [PubMed] [Google Scholar]
- 50.Biasucci LM, Colizzi C, Rizzello V, Vitrella G, Crea F, Liuzzo G: Role of inflammation in the pathogenesis of unstable coronary artery diseases. Scand J Clin Lab Invest 1999, 59(suppl. 230):S12-S22 [PubMed] [Google Scholar]
- 51.Koenig W, Sund M, Frohlich M, Fischer H-G, Lowel H, Doring A, Hutchinson WL, Pepys MB: C-reactive protein, a sensitive marker of inflammation, predicts future risk of coronary heart disease in initially healthy middle-aged men. Circulation 1999, 99:237-242 [DOI] [PubMed] [Google Scholar]
- 52.Liuzzo G, Biasuci LM, Gallimore JR, Grillo RL, Rebuzzi AG, Pepys MB, Maseri A: The prognostic value of C-reactive protein and serum amyloid A protein in severe unstable angina. N Engl J Med 1994, 331:417-424 [DOI] [PubMed] [Google Scholar]
- 53.Ridker PM, Buring JE, Shih J, Matias M, Hennekens CH: Prospective study of C-reactive protein and the risk of future cardiovascular events among apparently healthy women. Circulation 1998, 98:731-733 [DOI] [PubMed] [Google Scholar]
- 54.Ridker PM, Cushman M, Stampfer MJ, Tracy RP, Hennekens CH: Plasma concentration of C-reactive protein and risk of developing peripheral vascular disease. Circulation 1998, 97:425-428 [DOI] [PubMed] [Google Scholar]
- 55.Tracy RP, Lemaitre RN, Psaty BM, Ives DG, Evans RW, Cushman M, Meilahn EN, Kuller LH: Relationship of C-reactive protein to risk of cardiovascular disease in the elderly. Arterioscler Thromb Vasc Biol 1997, 17:1121-1127 [DOI] [PubMed] [Google Scholar]
- 56.Abdelmouttaleb I, Danchin N, Ilardo C, Aimone-Gastin I, Lozniewski A, Loubinoux J, Le Faou A, Gueant JL: C-reactive protein and coronary artery disease: additional evidence of the implication of an inflammatory process in acute coronary syndromes. Am Heart J 1999, 137:346-351 [DOI] [PubMed] [Google Scholar]
- 57.Biasucci LM, Liuzzo G, Grillo RL, Caligiuri G, Rebuzzi AG, Buffon A, Summaria F, Ginnetti F, Fadda G, Maseri A: Elevated levels of C-reactive protein at discharge in patients with unstable angina predict recurrent instability. Circulation 1999, 99:855-860 [DOI] [PubMed] [Google Scholar]
- 58.Haverkate F, Thompson SG, Pyke SDM, Gallimore JR, Pepys MB: Production of C-reactive protein and risk of coronary events in stable and unstable angina. Lancet 1997, 349:462-466 [DOI] [PubMed] [Google Scholar]
- 59.Mach F, Lovis C, Gaspoz JM, Unger PF, Bouillie M, Urban P, Rutishauser W: C-reactive protein as a marker for acute coronary syndromes. Eur Heart J 1997, 18:1897-1902 [DOI] [PubMed] [Google Scholar]
- 60.Toss H, Lindahl B, Siegbahn A, Wallentin L: Prognostic influence of increased fibrinogen and C-reactive protein levels in unstable coronary artery disease. Circulation 1997, 96:4204-4219 [DOI] [PubMed] [Google Scholar]
- 61.Muir KW, Weir CJ, Alwan W, Squire IB, Lees KR: C-reactive protein and outcome after ischemic stroke. Stroke 1999, 30:981-985 [DOI] [PubMed] [Google Scholar]
- 62.Ridker PM, Hennekens CH, Buring JE, Rifai N: C-reactive protein and other markers of inflammation in the prediction of cardiovascular disease in women. N Engl J Med 2000, 342:836-843 [DOI] [PubMed] [Google Scholar]