

Abstract
Alpha-fetoprotein (Afp) is the most abundant serum protein in the developing embryo. It is secreted by the visceral endoderm, its derivative yolk sac endoderm, fetal liver hepatocytes, and the developing gut epithelium. The abundance of this protein suggested that Afp gene regulatory elements might serve to effectively drive reporter gene expression in developing endodermal tissues. To this end, we generated transgenic mouse lines Tg(Afp-GFP) using an Afp promoter/enhancer to drive expression of green fluorescent protein (GFP). Bright GFP fluorescence allowed the visualization, in real time, of visceral endoderm, yolk sac endoderm, fetal liver hepatocytes, and the epithelium of the gut and pancreas. Comparison of the localization of green fluorescence with that of endogenous Afp transcripts and protein indicated that the regulatory elements used to generate these mouse lines directed transgene expression in what appeared to be all Afp-expressing cells of the embryo, but only in a subset of fetal liver cells. The bright GFP signal permitted flow cytometric analysis of fetal liver hepatocytes. These mice represent a valuable resource for live imaging as well as identification, quantitation and isolation of cells from the primitive and definitive endoderm lineages of the developing mouse embryo.
Keywords: alfa-fetoprotein, visceral endoderm, fetal liver, fluorescent protein, GFP, transgenic mice, imaging, oncofetal protein
INTRODUCTION
The visceral endoderm comprises a single layered cup-shaped epithelium, which encases the epiblast and extra-embryonic ectoderm of the postimplantation embryo and will later form the endodermal layer of the yolk sac (reviewed by Rossant, 1986). The visceral endoderm functions in nutrient uptake and transport and also expresses a large number of secreted serum proteins and transcription factors in common with the adult gut and liver. Consequently, it is thought to nurture the embryo, both before and after placental connections are established. More recent studies suggest that the visceral endoderm also plays an active role in the morphogenesis and patterning of the early embryo (Belaoussoff, 1998a; Dyer et al., 2001; Lu et al., 2001). The definitive endoderm comprises a population of multipotent progenitor cells representing one of the primary germ layers generated during gastrulation (Tam et al., 2001; Hogan and Zaret, 2002). The definitive endoderm gives rise to the major cell types of the digestive tract and associated organs, including the liver and pancreas. Little is known of the genetic determinants that regulate the specification, differentiation and morphogenesis of the definitive endoderm in mice.
Recent advances in the isolation of proteins that naturally fluoresce and the refinement of techniques for in vivo microscopy, offer unprecedented opportunities for studying cellular and molecular events within living, intact embryos (Hadjantonakis et al., 2003; Passamaneck et al., 2006). The generation of strains of mice expressing genetically-encoded fluorescent proteins in defined lineages now permits live imaging of tissue morphogenesis in a wild type and mutant context. To develop a mouse model that will permit real-time imaging and isolation of primitive and definitive endodermal cells, we have used a 7.6 kb promoter/enhancer from the mouse Afp gene to drive expression of fluorescent reporters. Afp is the most abundant serum protein of the mammalian embryo (Tilghman, 1985; Spear, 1999). An oncodevelopmental protein that is expressed at high levels in the embryonic yolk sac and fetal liver, its expression decreases dramatically after birth (Andrews et al., 1982; Tilghman and Belayew, 1982). While only trace amounts of Afp are synthesized in the adult liver, owing to a dominant repression domain (Emerson et al., 1992; Ramesh et al., 1995) ensconced within a much larger 5′ upstream regulatory region (Krumlauf et al., 1985; Hammer et al., 1987), Afp gene expression is reactivated during conditions involving rapid hepatocyte proliferation, such as liver regeneration or tumorigenesis. Afp has provided an excellent model system for studying the tissue- and developmental stage-specific regulation of gene expression (reviewed by Spear, 1999). In particular, the 7.6 kb Afp promoter/enhancer fragment has been previously characterized in the yolk sac and fetal liver of transgenic mice (Krumlauf et al., 1985; Hammer et al., 1987) and during the directed differentiation of transgenic ES cells (Paparella et al., 2002).
In this study, we have generated lines of Tg(Afp-GFP) mice (hereafter termed Afp-GFP) that express GFP specifically within the visceral endoderm, its derivative the yolk sac endoderm, hepatocytes of the fetal liver and the epithelium of the fetal gut and pancreas. We demonstrate the utility of these lines for tagging and tracking of endodermal cells of the primitive and definitive lineages of the mouse embryo, using microscopic imaging and flow cytometry.
RESULTS AND DISCUSSION
GFP expression in explanted blastocysts
A single line of Afp-KGFP and two lines of Afp-EGFP transgenic mice (see cartoon in Figure 1A) were analyzed. No differences in the spatial or temporal localization of GFP expression during embryogenesis were observed among the Afp-KGFP and Afp-EGFP lines. Therefore, the data have been pooled and the lines referred to generically as AFfp-GFP. To determine the onset of transgene expression as visualized by green fluorescence, we recovered embryos at the blastocyst stage at E3.5 to E4.5, coincident with the specification of primitive endoderm (reviewed by Rossant, 1986). We were unable to visualize GFP in any of the preimplantation stages recovered (E0.5–E4.5) in either hemizygous or homozgous Afp-GFP transgenic embryos (Figure 1B). However, if E4.5 blastocysts were plated onto tissue culture dishes to promote attachment and outgrowth, GFP expression was initiated within 24 hr (Figure 1C-E). The onset of fluorescence was documented in individual blastocyst outgrowths using time-lapse imaging (Figure 1C-E). In a total of 42 embryos examined from 8 litters, 19 blastocysts were GFP-positive. Interestingly, GFP-positive cells were never found interspersed within outgrowths. They were usually observed as single, and occasionally paired, cohorts of cells located internally in the outgrowth. Since blastocyst attachment to a dish usually occurs within the first 24 hours after plating, it was likely that the GFP first became visible a few hours after attachment. Furthermore high-resolution time-lapse imaging of individual blastocysts revealed that a single cell activated expression of the transgene and then divided to form a clone of fluorescing cells, as opposed to a model wherein onset of expression occurs in multiple neighboring cells (data not shown). The morphology of GFP expressing cells, when examined at high magnification, resembled that of primitive endoderm stem cells (XEN cells, Kunath et al., 2005). In particular, we observed the dynamic, unidirectional pseudopodial-like projections characteristic of XEN cells (Figure 1F-M). Since XEN cells have been reported to express markers of both parietal and visceral endoderm, we would expect them to express Afp.
Figure 1. Onset of Afp-GFP transgene expression.
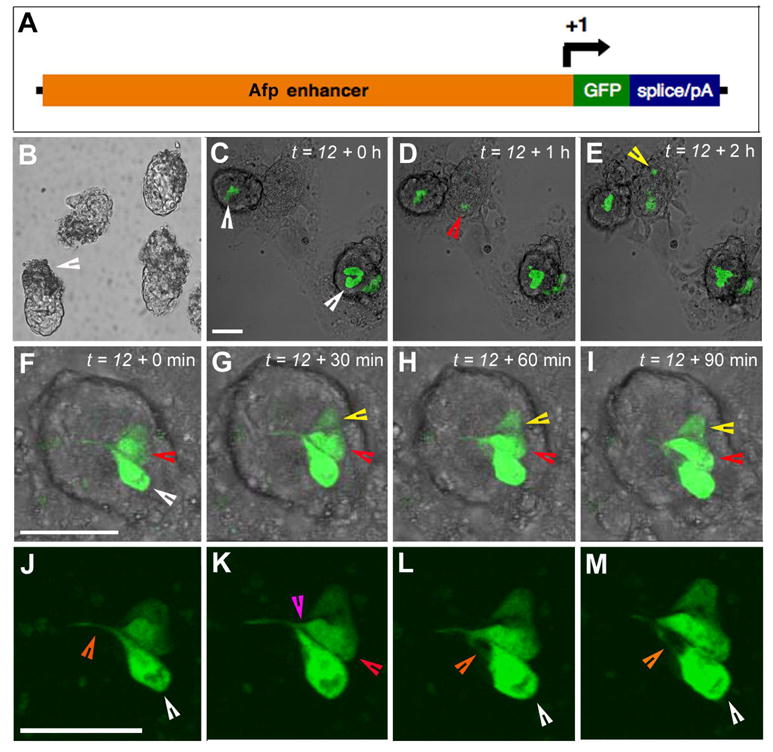
(A) Schematic representation of the Afp-GFP transgenes used in this study. (B) GFP fluorescence was not detected at preimplantation stages including late (E4.5) transgenic blastocysts. Brightfield image of E4.5 embryos with implantation sites (arrowhead). Individual time points from a confocal 3D (z-stack) timelapse sequence of Afp-GFP embryos (C–M) depicting the onset of detectable transgene expression and dynamic morphology of fluorescent cells. Rendered confocal data overlayed onto brightfield images of blastocyst outgrowths at t = 12 + 0 hr, referring to 12 hr after plating and the start of the time-lapse imaging sequence (C), two outgrowths contain cohorts of cells that express GFP (white arrowheads). The onset of GFP expression in a third embryo, less advanced outgrowth is detected after 1 hr of culture (D, red arrowhead). De novo initiation of GFP expression in a second cell at a second site is observed within the same outgrowth (yellow arrowhead) after 2 hr in culture (E). High magnification rendered confocal images from a timelapse sequence of an Afp-GFP outgrowth imaged over 90 min (F–M), depicting a cell division and dynamic, protrusive cell morphology (F–I, fluorescence overlayed on bright field; J–M, fluorescence channel at a higher magnification). (F) At t = 12 + 0 min, two cells express GFP (white and red arrowheads). (G,H) One cell has divided (red arrowhead), resulting in a third GFP expressing cell (yellow arrowhead). (J) At t = 12 + 0 min, one GFP expressing cell (white arrow) has extended a dynamic, unidirectional projection (white arrowhead). Thereafter, a second GFP expressing cell (K, red arrow) extended a unilateral projection along the existing projection (red arrowhead), at which point the projection from the first cell was retracted (L, white arrowhead) and subsequently projected in a different direction (M, white arrowhead). Scale bars represent 50 μm.
GFP expression in postimplantation embryos
By early postimplantation stages, GFP expression was readily detectable in both hemizygous and homozygous transgenic Afp-GFP embryos (Figure 2). Confocal imaging of whole embryos confirmed that fluorescence was localized to the visceral endoderm (Figure 2B,C and F,G). At E5.5, while the distal visceral endoderm overlying the epiblast expressed GFP, the proximal visceral endoderm overlying the extraembryonic ectoderm was devoid of fluorescence (Figure 2A-D and I). By E6.5, coincident with the onset of gastrulation, expression of GFP had spread more proximally, into the extraembryonic visceral endoderm (Figure 2E-H and J). This observation is in general agreement with a previous report that signals emanating from the extraembryonic ectoderm repress Afp expression in the overlying visceral endoderm (Dziadek, 1978). Repression is relieved later, when mesoderm generated during gastrulation has infiltrated the extraembryonic region (Dziadek, 1978; Dziadek and Adamson, 1978).
Figure 2. Visualization of GFP fluorescence in early postimplantation stage Afp-GFP embryos.
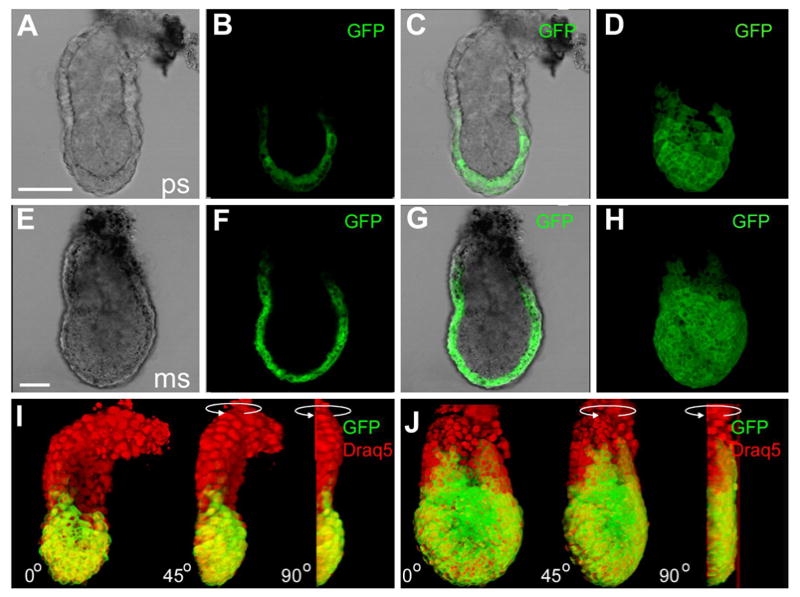
Fluorescence was restricted to the distal visceral endoderm (primarily the cells overlying the epiblast) in prestreak (E5.5) and early streak (E6.5) stage embryos. Brightfield (A,E), single confocal sections taken from a z-stack (B,F), merge of confocal and bright field channels (C,G), and 3D projection of the z-stack of confocal images (D,H). Panels I and J show projections of embryos shown in A–D and E–H, respectively. Embryos have been counterstained with DRAQ5 to highlight nuclei. Depicted images are of red (DRAQ5) and green (GFP) fluorescent channel merges. (I,J) Rendered 2-channel images were rotated 90 degrees around the proximo-distal axis of the embryo, revealing the three dimensionality of GFP localization in the context of embryo morphology. Scale bar represents 50 μM.
In gastrula stage embryos, the domain of GFP expression corresponded with the localization of Afp transcripts as it came to occupy the entire visceral endoderm and subsequently the endoderm component of the vitelline yolk sac (Figure 3). Coincident with formation of definitive endoderm during gastrulation, the domains of expression of GFP and Afp RNA were displaced proximally (Figure 3A-C). High resolution imaging and 3D reconstruction of yolk sac tissue counterstained with a vital nuclear dye (DRAQ5) confirmed the localization of green fluorescence to cells of the yolk sac endoderm (Figure 3J-L).
Figure 3. GFP expression parallels Afp mRNA localization by the headfold to somitogenesis stages and is restricted to the yolk sac endoderm.
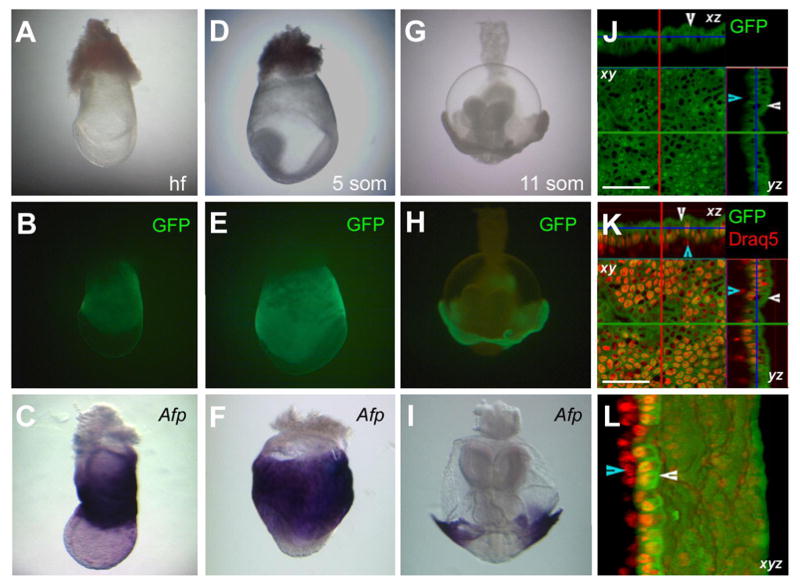
Brightfield (A) and widefield fluorescent (B) images of a headfold stage Afp-GFP embryo and (C) a stage matched embryo depicting Afp mRNA localization. Brightfield (D) and widefield fluorescent (E) images of a 5 somite stage Afp-GFP embryo and (F) a stage matched embryo depicting Afp mRNA localization. Brightfield (G) and widefield fluorescent (H) images of a 11 somite stage Afp-GFP embryo and and (I) a stage matched embryo depicting Afp mRNA localization. (J–L) Data from a confocal z-stack of E8.5 yolk sac counterstained with DRAQ5 to highlight nuclei (red). Green fluorescence is localized to the yolk sac endoderm (white arrowheads) and excluded from yolk sac mesoderm (blue arrowheads). (J), GFP channel (depicting orthogonal views of single xy, xz and zy slices); (K), GFP channel merged with DRAQ5 channel (depicting orthogonal views of single xy, xz and zy slices; (L), 3D rendered z-stack rotated 45 degrees. Abbreviations: hf, headfold; 5 som, 5 somite; 11 som, 11 somite. Scale bar represents 50 μM.
By midgestation (E9.5), fluorescence was detected throughout the yolk sac endoderm (Figure 4A) and within the liver primordium (Figure 4B-D). Both sites of transgene expression were in concordance with the localization of Afp transcripts in stage matched embryos (Figure 4E-H). By E11.5, fluorescence was maintained within the yolk sac endoderm and liver (Figure 4I,J). However, sectioning revealed heterogenous fluorescence in a dispersed population of hepatocytes (Figure 4K). High magnification imaging revealed that these GFP expressing cells exhibited a hepatoblastic morphology, with between one and four protrusions per cell (Figure 4L). Time-lapse imaging of cultured transverse sections of liver from E11.5 embryos established the dynamic nature of these protrusions (Figure 4M-P). In contrast, Afp transcripts were identified in all cells of the liver and in yolk sac endoderm (Figure 4Q-T). At E13.5, the Afp-GFP transgene was widely expressed in the liver (Figure 5A).
Figure 4. By midgestation, GFP is localized to the yolk sac and definitive endodermal derivatives.
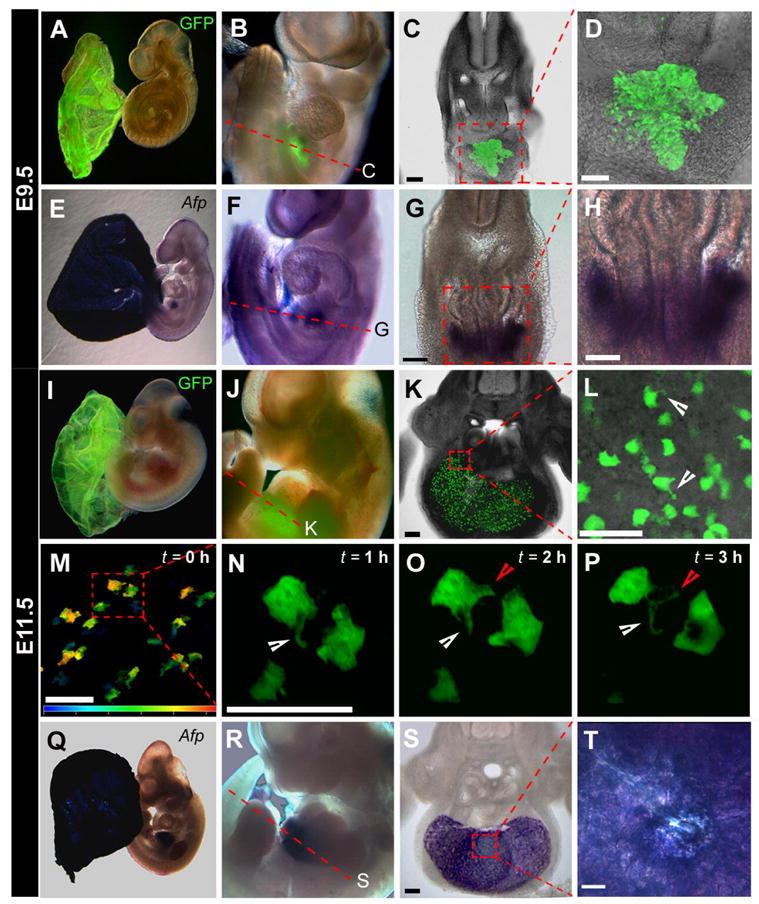
Widefield fluorescence overlayed on brightfield images demonstrates that GFP is restricted to the yolk sac (A,I) and liver (B,J) of Afp-GFP E9.5 and E11.5 embryos. Rendered z-stacks of confocal sections acquired on vibratome sections through the liver region at E9.5 (C,D) and E11.5 (K). The approximate planes of transverse section are depicted by dashed red lines in panels B and J. (L) High magnification rendered z-stack of the fetal liver at E11.5 reveals pseudopodial-like projections (white arrowheads) observed on hepatocytes. (M) Color-coded depth projection depicting a three dimensional data set in two dimensions, the depth being represented by color, of a rendered confocal image of the z-stack of the first time point (t = 0 h) from a time-lapse imaging sequence of a vibratome section of a fresh E11.5 liver in slice culture (dark blue represents 0 μm; red represents 50 μm). (N) At t = 1 hr, a liver cell extends a unilateral projection in one direction (white arrowhead). (O) At t = 2 hr, the same cell extends a second projection in a different direction (red arrowhead). (P) At t = 3 hr, the projections show dynamic extension and retraction (white and red arrowheads). In situ hybridization of Afp RNA expression in stage matched embryos reveals localization to the yolk sac (E,Q) and liver (F,R). Vibratome section in situ hybridization of Afp RNA expression in liver at E9.5 (G,H) and E11.5 (S,T). Scale bars represent 100 μm (C,G,K,S); 50 μm (D,H,L,M,N,T).
Figure 5. Expression of the Afp-GFP transgene in the liver of E13.5 and E14.5 embryos.
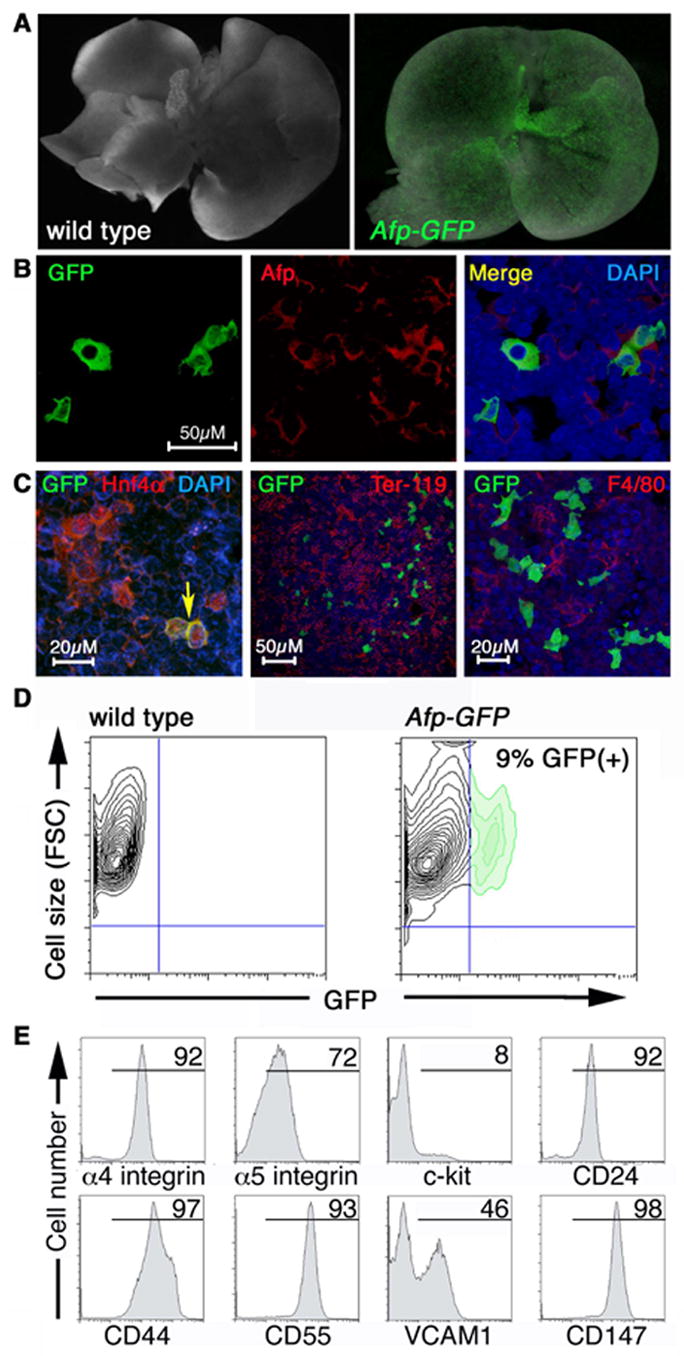
(A) Expression of the Afp-GFP transgene in the E13.5 liver (right). A liver from a wild type littermate is shown (left). Images are overlays of brightfield and GFP channel fluorescence. (B) Immunostaining of E14.5 fetal liver cytospins. All GFP(+) cells express endogenous Afp protein (red; more than 80 GFP(+) cells examined). (C) GFP(+) cells also expressed the endodermal protein Hnf4α (left panel; more than 200 GFP(+) cells examined) but did not express hematopoietic markers (middle and right panels). Immunostaining of cryosections revealed Ter-119(+) erythroid (middle panel) and F4/80(+) macrophage (right panel) populations within the fetal liver. GFP-expressing cells are interspersed with these cells. The characteristic hepatoblastic morphology of the GFP(+) cells is evident at high magnification (right panel). (D,E) Flow cytometric analysis of cells from E14.5 Afp-GFP fetal livers. (D) Contour plot of GFP fluorescence versus forward scatter (FSC, reflecting cell size). The GFP(+) cells were large, as evidenced by their high FSC. (E) The GFP(+) population (9% of total) was gated and examined for expression of surface antigens. Numbers above the bars represent the percentage of GFP(+) cells expressing the indicated surface antigen. The X axis indicates relative logarithmic fluorescence units.
Endoderm specificity of GFP expression
Endoderm (hepatocyte) specificity was confirmed by immunostaining of dispersed cells from E14.5 liver (Figure 5B). All GFP(+) cells expressed endogenous Afp (Figure 5B) and hepatocyte nuclear transcription factor (HNF4, Duncan et al., 1994) (Figure 5C). However, only a subset (~10%) of Afp-expressing cells were GFP(+), with over 680 Afp-expressing cells examined (Figure 5B). The expression of the Afp-GFP transgene within a subpopulation of liver cells may reflect heterogeneity in the onset and level of expression. In addition, the constructs generated for this study lacked an intronic enhancer and alternative promoter known to contribute to Afp expression in the yolk sac and fetal liver (Scohy et al., 2000; Gabant et al., 2002).
Consistent with the hematopoietic activity of the fetal liver, immunostaining of cryosections revealed the presence of Ter119+ erythroid (middle panel) and F4/80(+) macrophage (right panel) populations (Figure 5C). GFP was expressed in a distinct population of cells with characteristic hepatoblastic morphology (Figure 5C, right panel). The large size of these cells is evident from the contour plot of GFP fluorescence versus forward scatter (Figure 5D).
Cell surface phenotype of GFP-expressing cells in the embryo
In addition to their utility for imaging the developing embryo, the GFP reporter mouse lines also allow the isolation and analysis of cells in which the transgene is expressed, using fluorescence activated cell sorting (FACS). To determine whether GFP could be detected by FACS, single cell suspensions of Afp-GFP transgenic livers were prepared from E14.5 embryos and analyzed by flow cytometry. Approximately 10% of the fetal liver cells expressed GFP at high levels (Figure 5D).
To examine the surface phenotype of the GFP(+) liver cells, single cell suspensions were stained with antibodies against a variety of surface antigens and analyzed by FACS. Fetal liver cells have been demonstrated to express a number of adhesion molecules, including α4 integrin, α5 integrin and CD44 (Kawakami et al., 1999); all three were expressed on a majority of GFP(+) cells (Figure 5E). CD24 and CD147/Basigin function in integrin signaling (Hahne et al., 1994; Berditchevski et al., 1997; Sammar et al., 1997; Cho et al., 2001) and were also expressed on the GFP(+) population (Figure 5E). Heterogeneity within the GFP(+) population was suggested by the presence of VCAM-1, a receptor for the α4β1 integrin complex VLA-4 (Hemler et al., 1987) on half of the GFP(+) cells (Figure 5E). Fetal hepatic progenitors have been reported to express α6 integrin (Suzuki et al., 2002) and low levels of c-kit (Minguet et al., 2003). A subset of GFP(+) cells in the fetal liver expressed c-kit (8%, Figure 5E) but not α6 integrin (not shown) and may represent a somewhat more mature population of cells. The C regulatory protein CD55 protects the fetus from lysis by maternal complement (Simpson et al., 1993) and was expressed at high levels in most of the GFP(+) cells of the liver (Figure 5E). Expression of hematopoietic and endothelial markers (CD41, CD45, Ter119, F4/80, CD34, Sca-1 CD31, MECA-32 and Flk1) was not detected within the GFP(+) population (not shown).
GFP expression in late stage yolk sac and definitive endoderm derivatives
In late stage embryos, strong expression of GFP was observed in the yolk sac (Figure 6B,C), liver and pancreas (Figure 6D,E). In the yolk sac, Ter119 staining identified erythroid cells in blood vessels adjacent to the GFP(+) visceral endoderm (Figure 6G). The yolk sac (Figure 6H) and fetal liver endoderm (Figure 6D) and the definitive endodermal layer of the intestine (Figure 6I) and pancreas (Figure 6J) displayed overlapping expression of GFP and the epithelial marker E-cadherin. Ectopic expression of GFP (but not endogenous Afp mRNA) was detected in the brain in all lines (Figure 6F and data not shown).
Figure 6. Expression of GFP in endoderm-derived tissues of late stage embryos.
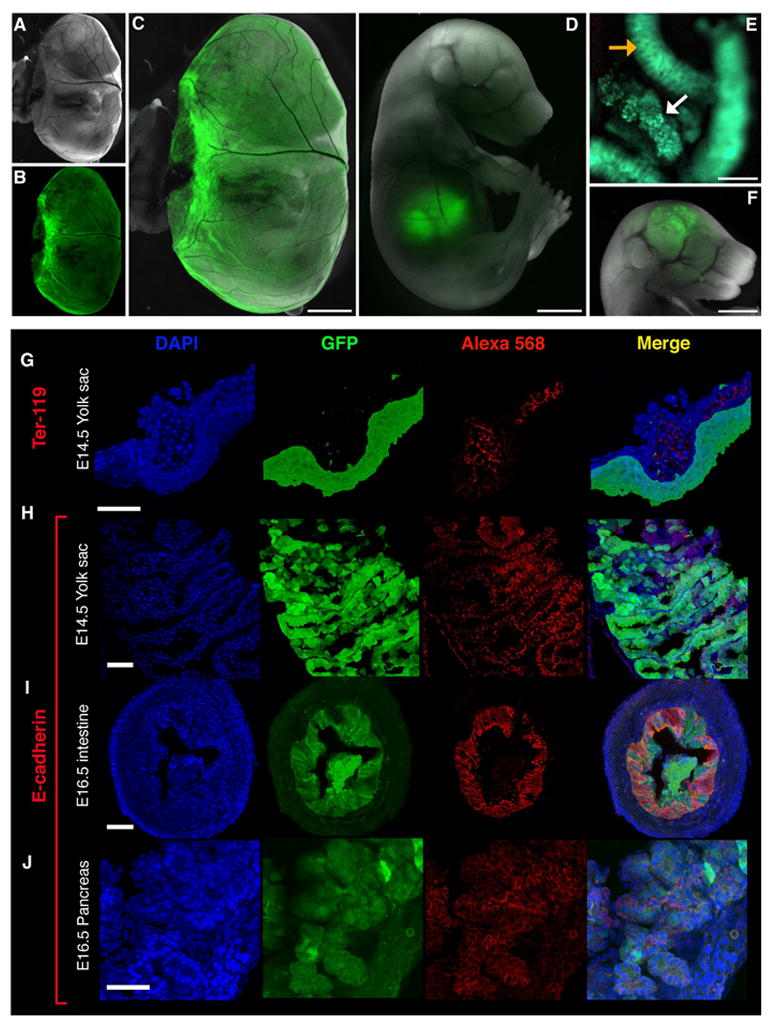
Strong expression of GFP was observed in the yolk sac of E16.5 embryos (A, bright field; B, GFP; C, composite). Bright expression was also detected in the fetal liver (D, composite of bright field and GFP channel fluorescence), intestine (E, orange arrow), pancreas (E, white arrow), and (ectopically) in the brain (F, composite). (G) Yolk sac expression of GFP was restricted to the endodermal layer (E14.5 embryo). Staining for Ter-119, an erythroid marker, highlights erythroblasts within blood vessels adjacent to the GFP(+) visceral endoderm. (H) GFP(+) endodermal cells express E-cadherin in the yolk sac. Note that E-cadherin is expressed at cell-cell junctions while GFP is found within the cytoplasm. GFP(+) cells in the developing intestine (I) and pancreas (J) expressed the epithelial marker E-cadherin.
Afp-GFP transgenic mice: a novel tool for analysis of primitive and definitive endoderm
In summary, the Afp-GFP transgenic mice permit non-invasive imaging of the visceral endoderm, the endoderm of the yolk sac, and several definitive endoderm derivatives. They provide a novel tool for studying the dynamic behavior of visceral endoderm cells, including their displacement and/or migration during gastrulation (Srinivas et al., 2004). The bright endodermal fluorescence will facilitate the isolation of primitive and definitive endodermal cell populations and their derivatives by microdissection and their identification, quantitation, and purification by flow cytometry of living tissue. In view of the known reactivation of Afp, an oncofetal tumor marker, during liver tumorigenesis, these lines should allow a readout in real time in preclinical models of human hepatocellular carcinoma and may represent a useful model for evaluating anti-tumor drugs for the treatment of liver cancer.
A limited number of transgenic mouse lines that express fluorescent reporters in endodermal lineages are currently available. The Hex-GFP line expresses GFP within a subpopulation of visceral endoderm, the prospective anterior visceral endoderm (AVE), and has been used to track the migration of these cells (Srinivas et al., 2004). However, Hex is also expressed in endothelial, primitive erythroid, and endocardial cells, all mesodermal derivatives (Thomas et al., 1998). Otx2 upstream regulatory sequences have been shown to drive regionalized GFP expression in the visceral endoderm (distally, at E5.5, and in the AVE, by E6.25, Kimura et al., 2000). In Pdx1-GFP transgenic mice, GFP fluorescence was observed in the developing pancreas, stomach and duodenum (Gu et al., 2004). Pdx1 is not expressed in the visceral endoderm and GFP fluorescence was not described in this tissue (Gu et al., 2004). To our knowledge, the Afp-GFP transgenic mice reported here are the most specific lines available for the identification, visualization and characterization of both primitive and definitive endodermal lineages in the developing mouse embryo.
EXPERIMENTAL PROCEDURES
Generation of Afp-GFP transgenic mice
The Afp-KGFP transgene construct was built in a pSP73 (Promega, Madison, WI) backbone and contained an EcoRI/SalI fragment containing a 7.6 kb enhancer from the α -fetoprotein (Afp) gene (Hammer et al., 1987; Spear and Tilghman, 1990); jellyfish green fluorescent protein (KGFP) coding sequences amplified using the polymerase chain reaction (PCR) to include HindIII and XbaI sites at the 5′ and 3′ termini, respectively; and sequences from the human ε -globin gene (+474 to +1746) containing part of exon 2, IVS 2, exon 3, 3′ untranslated sequences and a polyadenylation signal. The Afp enhancer was excised from pUC9-Afp-Dd (Spear and Tilghman, 1990). The ε -globin sequences were excised as a XbaI/EcoRI fragment from −179εlacZμLCR (Belaoussoff, 1998b) and inserted by blunt ligation into the PvuII site of pSP73. For microinjection into embryos, plasmid DNAs were digested with EcoRI and XhoI restriction enzymes and the eukaryotic portions purified using standard methods (Nagy et al., 2003). Pronuclear injection into C57BL/6 x C3H (B6C3) F1 hybrid embryos was performed by the Mount Sinai Mouse Genetics Shared Resource Facility. The mice were maintained as hemizygotes on an ICR outbred background. Transgenic males were crossed with ICR females for all studies. The morning of detection of the vaginal plug was taken as day 0.5 of gestation.
To generate the Afp-EGFP vector, the 7.6 kb Afp enhancer was cloned into plasmid phsp68-EGFP-SV40pA, containing the hsp68 minimal promoter, the yellow-shifted EGFP variant fluorescent protein (Clontech, Inc., Palo Alto, CA) coding sequence, and an SV40 polyadenylation sequence. The eukaryotic insert DNA was excised with NotI. Following purification using routine protocols (Nagy et al., 2003), DNA was injected into C57BL/6 zygotes at the Memorial Sloan-Kettering Cancer Center Transgenic Core Facility.
Embryo collection
Preimplantation embryos were recovered in M2 medium and cultured in KSOM Embryo Culture Medium (Chemicon Specialty Media, Temecula, CA) in an organ culture dish (BD Falcon, cat# 353037) or, for live imaging, under mineral oil in a MatTek glass bottom dish (cat. # P35G-1.5-14C), at 37°C, 5% CO2. Postimplantation embryos and organs were dissected in N-2-hydroxyethylpiperazine-N′-2-ethanesulfonic acid (HEPES) buffered Dulbecco’s Modified Eagle’s Medium (DMEM) containing 10% fetal bovine serum (FBS). During live imaging, specimens were cultured in 50% rat serum, 50% DMEM/F12 supplemented with L-glutamine (2 mM). For fixation, embryos were dissected in phosphate-buffered saline (PBS) and subsequently transferred into 4% paraformaldehyde in PBS (PFA/PBS). All data presented are from hemizygous single transgenic animals. Homozygous animals displayed more robust fluorescence (not shown).
Vibrating microtome sectioning and counterstaining
Specimens were either embedded and sectioned immediately after dissection or were fixed in 4% PFA/PBS for 2 to 12 hr, washed in PBS, and embedded in 4% low-melt agarose, 5% sucrose in PBS. Blocks were cut out of embedding molds, trimmed using a razor blade, and then mounted onto a vibrating microtome chuck (Leica VT1000S) using superglue. Sections were cut at a thickness of 200 μm. Embryos were counterstained with 7.5 mM DRAQ5 (Alexis Biochemicals, San Diego, CA) in 50% DMEM : 50% rat serum.
In situ hybridization and immunochemistry
In situ hybridization of biotinylated RNA probes to wholemount embryos and vibrating microtome sections was performed according to standard protocols (Nagy et al., 2003). Embryos were dissected in PBS and fixed in 4% PFA/PBS for 12 to 24 hr, then washed in PBS before being processed for in situ hybridization as either wholemounts or 200 μm-thick sections. Hybridizations were performed using an Afp probe (Law and Dugaiczyk, 1981).
For immunocytochemistry, fetal livers from E14.5 Afp-GFP embryos were dissociated by simple trituration and filtration through a 70 μm cell strainer (BD Falcon, cat. # 352350) to produce single cell suspensions. Cells were centrifuged onto Fisherbrand Superfrost/Plus glass slides for 3 min at 600 rpm (Cytospin3 cyocentrifuge, Shandon, Inc., Pittsburgh, PA) and allowed to air dry overnight. Cytospins were fixed for 10 min at room temperature (RT) in 4% PFA/PBS, blocked for 1 hr at RT in PBS containing 0.1% Carnation instant nonfat dry milk and 0.05% Tween-20 (Sigma) (PBSMT). Slides were then stained overnight at 4°C with anti-Afp antibody (Afp AB-2, rabbit polyclonal, NeoMarkers, Lab Vision, Fremont, CA, Cat # RB-365-A1 or Afp (C-19), goat polyclonal IgG, Santa Cruz Biotechnology, Cat # sc-8108) diluted 1:400 in PBSMT. The two anti-Afp sera produced comparable patterns of staining, but background fluorescence was lower for the NeoMarkers antibody, which was used for the experiments shown in the figures shown here. Anti-Hnf4α was from Santa Cruz Biotechnology (Cat # sc-6556). The following day, slides were washed three times with PBS containing 0.05% Tween-20 (PBST) and incubated with anti-rabbit IgG-Alexa568 (Molecular Probes, Eugene, OR) diluted 1:400 in PBST for 1 hr at RT. The cytospins were washed three times in PBS and mounted using Vectashield Mounting Medium with DAPI (cat. #H-1200 (Vector Labs, Burlingame, CA).
For immunohistochemistry, embryos and individual organs were harvested and processed as described previously (Fraser et al., 2005). They were then transferred to Tissue-Tek OCT embedding medium (Sakura Finetek, Torrance, CA) for 3 hr, placed into embedding moulds and snap-frozen in isopentane chilled in a liquid nitrogen bath. Cryosections (10 μm) were cut using a Leica CM3050 cryostat, allowed to adhere to Superfrost/Plus glass slides, and air-dried overnight. They were then blocked for 1hr at RT in PBSMT and incubated for 1 hr at RT with primary antibody. Primary antibodies used were Ter119 (BDBiosciences, San Diego, CA), F4/80 (EBiosciences, San Diego, CA) and E-cadherin (Zymed, South San Francisco, CA). Slides were then washed three times in PBST and incubated for 1 hr at RT with anti-rat IgG-Alexa568 secondary antibody (Molecular Probes) diluted 1:400 in PBST. Slides were then washed in PBS and mounted as described above.
Image acquisition
Laser scanning confocal data were acquired using a Zeiss LSM510 META laser scanning confocal mounted on a Zeiss Axiovert 200M microscope. Whole embryos were kept in PBS in MatTek glass bottom dishes during imaging. Fluorescence was excited with a 488nm Argon laser (GFP) or a 633nm HeNe laser (DRAQ5). Objectives used were: C-apochromat 40x/NA1.2, plan-apochromat 20x/NA0.75, fluar 5x/NA0.25, or plan-apochromat 63x/NA1.4. Optical section thicknesses ranged from 0.2–2 μM. Widefield images were acquired using a Axiocam MRC (Zeiss) camera mounted onto a Leica MZ16FA stereodissecting microscope. For live imaging and time-lapse experiments, embryos were maintained at 37°C in humidified chamber, under 5% CO2 (Solent Sci, UK).
Image processing
Raw data were processed using Zeiss AIM software (Carl Zeiss Microsystems, http://www.zeiss.com/), and Volocity (Improvision, http://www.improvision.com/). Re-animation and annotation of data to generate rotations or movies of time-lapse sequences was performed using QuickTime Pro (Apple Computer, Inc., http://www.apple.com/quicktime/).
Flow cytometry
Single cell preparations of E14.5 fetal livers were prepared as described above and incubated with fluorescently conjugated antibodies to detect surface antigen expression. Conjugated antibodies were purchased from EBiosciences (EBio) or BDBiosciences (BD). Phycoerythrin (PE)-conjugated antibodies were: α6 integrin (BD), Ter119 (EBio), CD31 (EBio), CD34 (BD), CD41 (BD), CD55 (EBio), CD147 (EBio) and Sca-1 (BD). CD44 and c-kit antibodies (BD) were directly conjugated to allophycocyanin (APC). Biotin-conjugated antibodies were: α4- and α5-integrin, from BD; CD45, F4/80, MECA-32, VCAM-1, and Flk1, from EBio. Biotin was detected using Streptavidin-APC (BD). Cells were washed in FACS buffer (10% FBS in PBS) and resuspended in FACS buffer containing 0.01% propidium iodide to allow exclusion of dead cells. Cells were analyzed using a FACSCalibur four-color analyzer (Becton Dickinson) in the Mount Sinai Flow Cytometry Shared Research Facility.
Acknowledgments
We thank Chantal Lackan for assistance during the course of this work, and Drs Kevin Kelley and Liz Lacy for helpful discussions. The Afp-Dd construct was a generous gift from Dr Shirley Tilghman.
Footnotes
Grant Sponsor: NIH; Grant number: RO1 DK52191. Grant Sponsor: NIH; Grant number: HL62248. Grant Sponsor: NCI; Grant number: R24 CA88302. Grant Sponsor: Memorial Sloan-Kettering Cancer Center Core Grant; Grant Sponsor: NCI; Grant Number: P30CA08748-41.
References
- Andrews GK, Dziadek M, Tamaoki T. Expression and methylation of the mouse alpha-fetoprotein gene in embryonic, adult, and neoplastic tissues. J Biol Chem. 1982;257:5148–5153. [PubMed] [Google Scholar]
- Belaoussoff M. Molecular and Cellular Biology. Cambridge, MA: Harvard University; 1998a. Embryonic Induction of Hematopoiesis and Vasculogenesis During Mouse Development. [Google Scholar]
- Belaoussoff M. Embryonic Induction of Hematopoiesis and Vasculogenesis During Mouse Development. Cambridge, MA: Ph.D. Thesis, Harvard University; 1998b. [Google Scholar]
- Berditchevski F, Chang S, Bodorova J, Hemler ME. Generation of monoclonal antibodies to integrin-associated proteins. Evidence that alpha3beta1 complexes with EMMPRIN/basigin/OX47/M6. J Biol Chem. 1997;272:29174–82910. doi: 10.1074/jbc.272.46.29174. [DOI] [PubMed] [Google Scholar]
- Cho JY, Fox DA, Horejsi V, Sagawa K, Skubitz KM, Katz DR, Chain B. The functional interactions between CD98, beta1-integrins, and CD147 in the induction of U937 homotypic aggregation. Blood. 2001;98:374–382. doi: 10.1182/blood.v98.2.374. [DOI] [PubMed] [Google Scholar]
- Duncan SA, Manova K, Chen WS, Hoodless P, Weinstein DC, Bachvarova RF, Darnell JE. Expression of transcription factor HNF-4 in the extraembryonic endoderm, gut, and nephrogenic tissue of the developing mouse embryo: HNF-4 is a marker for primary endoderm in the implanting blastocyst. Proc Natl Acad Sci USA. 1994;91:7598–7602. doi: 10.1073/pnas.91.16.7598. [DOI] [PMC free article] [PubMed] [Google Scholar]
- Dyer MA, Farrington SM, Mohn D, Munday JR, Baron MH. Indian hedgehog activates hematopoiesis and vasculogenesis and can respecify prospective neurectodermal cell fate in the mouse embryo. Development. 2001;128:1717–1730. doi: 10.1242/dev.128.10.1717. [DOI] [PubMed] [Google Scholar]
- Dziadek M. Modulation of alphafetoprotein synthesis in the early postimplantation mouse embryo. J Embryol exp Morph. 1978;46:135–146. [PubMed] [Google Scholar]
- Dziadek M, Adamson E. Localisation and synthesis of alphafoetoprotein in post-implantation mouse embryos. J Embryol Exp Morphol. 1978;43:289–313. [PubMed] [Google Scholar]
- Emerson JA, Vacher J, Cirillo LA, Tilghman SM, Tyner AL. The zonal expression of alpha-fetoprotein transgenes in the livers of adult mice. Dev Dyn. 1992;195:55–66. doi: 10.1002/aja.1001950106. [DOI] [PubMed] [Google Scholar]
- Fraser ST, Hadjantonakis AK, Sahr KE, Willey S, Kelly OG, Jones EA, Dickinson ME, Baron MH. Using a histone yellow fluorescent protein fusion for tagging and tracking endothelial cells in ES cells and mice. Genesis. 2005;42:162–171. doi: 10.1002/gene.20139. [DOI] [PMC free article] [PubMed] [Google Scholar]
- Gabant P, Forrester L, Nichols J, Van Reeth T, De Mees C, Pajack B, Watt A, Smitz J, Alexandre H, Szpirer C, Szpirer J. Alpha-fetoprotein, the major fetal serum protein, is not essential for embryonic development but is required for female fertility. Proc Natl Acad Sci USA. 2002;99:12865–12870. doi: 10.1073/pnas.202215399. [DOI] [PMC free article] [PubMed] [Google Scholar]
- Gu G, Wells JM, Dombkowski D, Preffer F, Aronow B, Melton DA. Global expression analysis of gene regulatory pathways during endocrine pancreatic development. Development. 2004;131:165–179. doi: 10.1242/dev.00921. [DOI] [PubMed] [Google Scholar]
- Hadjantonakis AK, Dickinson ME, Fraser SE, Papaioannou VE. Technicolour Transgenics: Imaging Tools for Functional Genomics in the Mouse. Nat Rev Genet. 2003;4:613–625. doi: 10.1038/nrg1126. [DOI] [PubMed] [Google Scholar]
- Hahne M, Wenger RH, Vestweber D, Nielsen PJ. The heat-stable antigen can alter very late antigen 4-mediated adhesion. J Exp Med. 1994;179:1391–1395. doi: 10.1084/jem.179.4.1391. [DOI] [PMC free article] [PubMed] [Google Scholar]
- Hammer RE, Krumlauf R, Camper SA, Brinster RL, Tilghman SM. Diversity of alpha-fetoprotein gene expression in mice is generated by a combination of separate enhancer elements. Science. 1987;235:53–58. doi: 10.1126/science.2432657. [DOI] [PubMed] [Google Scholar]
- Hemler ME, Huang C, Schwarz L. The VLA protein family. Characterization of five distinct cell surface heterodimers each with a common 130,000 molecular weight beta subunit. J Biol Chem. 1987;262:3300–3309. [PubMed] [Google Scholar]
- Hogan BLM, Zaret KS. Development of the Endoderm and Its Tissue Derivatives. In: Rossant J, Tam PPL, editors. Mouse Development Patterning, Morphogenesis, and Organogenesis. New York: Academic Press; 2002. pp. 301–330. [Google Scholar]
- Kawakami N, Nishizawa F, Sakane N, Iwao M, Tsujikawa K, Ikawa M, Okabe M, Yamamoto H. Roles of integrins and CD44 on the adhesion and migration of fetal liver cells to the fetal thymus. J Immunol. 1999;163:3211–3216. [PubMed] [Google Scholar]
- Kimura C, Yoshinaga K, Tian E, Suzuki M, Aizawa S, Matsuo I. Visceral Endoderm Mediates Forebrain Development by Supressing Posteriorizing Signals. Dev Biol. 2000;225:304 – 321. doi: 10.1006/dbio.2000.9835. [DOI] [PubMed] [Google Scholar]
- Krumlauf R, Hammer RE, Tilghman SM, Brinster RL. Developmental Regulation of a-Fetoprotein Genes in Transgenic Mice. Mol Cell Biol. 1985;5:1639–1648. doi: 10.1128/mcb.5.7.1639. [DOI] [PMC free article] [PubMed] [Google Scholar]
- Kunath T, Arnaud D, Uy GD, Okamoto I, Chureau C, Yamanaka Y, Heard E, Gardner RL, Avner P, Rossant J. Imprinted X-inactivation in extra-embryonic endoderm cell lines from mouse blastocysts. Development. 2005;132:1649–1661. doi: 10.1242/dev.01715. [DOI] [PubMed] [Google Scholar]
- Law SW, Dugaiczyk A. Homology between the primary structure of alpha-fetoprotein, deduced from a complete cDNA sequence, and serum albumin. Nature. 1981;291:201–205. doi: 10.1038/291201a0. [DOI] [PubMed] [Google Scholar]
- Lu CC, Brennan J, Robertson EJ. From fertilization to gastrulation: axis formation in the mouse embryo. Curr Opin Genet Develop. 2001;11:384–392. doi: 10.1016/s0959-437x(00)00208-2. [DOI] [PubMed] [Google Scholar]
- Minguet S, Cortegano I, Gonzalo P, Martinez-Marin JA, de Andres B, Salas C, Melero D, Gaspar ML, Marcos MA. A population of c-Kit(low)(CD45/TER119)- hepatic cell progenitors of 11-day postcoitus mouse embryo liver reconstitutes cell-depleted liver organoids. J Clin Invest. 2003;112:1152–1163. doi: 10.1172/JCI17409. [DOI] [PMC free article] [PubMed] [Google Scholar]
- Nagy A, Gertsenstein M, Vintersten K, Behringer R. Manipulating the Mouse Embryo: A Laboratory Manual. Cold Spring Harbor: Cold Spring Harbor Laboratory Press; 2003. [Google Scholar]
- Paparella M, Kolossov E, Fleischmann BK, Hescheler J, Bremer S. The use of quantitative image analysis in the assessment of in vitro embryotoxicity endpoints based on a novel embryonic stem cell clone with endoderm-related GFP expression. Toxicol In Vitro. 2002;16:589–597. doi: 10.1016/s0887-2333(02)00052-8. [DOI] [PubMed] [Google Scholar]
- Passamaneck YJ, Di Gregorio A, Papaioannou VE, Hadjantonakis AK. Live imaging of fluorescent proteins in chordate embryos: From ascidians to mice. Microsc Res Tech. 2006;69:160–167. doi: 10.1002/jemt.20284. [DOI] [PubMed] [Google Scholar]
- Ramesh TM, Ellis AW, Spear BT. Individual mouse alpha-fetoprotein enhancer elements exhibit different patterns of tissue-specific and hepatic position-dependent activities. Mol Cell Biol. 1995;15:4947–4955. doi: 10.1128/mcb.15.9.4947. [DOI] [PMC free article] [PubMed] [Google Scholar]
- Rossant J. Development of extraembryonic lineages in the mouse embryo. In: Rossant J, Pedersen RA, editors. Experimental Approaches to Mammalian Embryonic Development. Cambridge, UK: Cambridge University Press; 1986. pp. 97–119. [Google Scholar]
- Sammar M, Gulbins E, Hilbert K, Lang F, Altevogt P. Mouse CD24 as a signaling molecule for integrin-mediated cell binding: functional and physical association with src-kinases. Biochem Biophys Res Commun. 1997;234:330–334. doi: 10.1006/bbrc.1997.6639. [DOI] [PubMed] [Google Scholar]
- Scohy S, Gabant P, Szpirer C, Szpirer J. Identification of an enhancer and an alternative promoter in the first intron of the alpha-fetoprotein gene. Nucleic Acids Res. 2000;28:3743–3751. doi: 10.1093/nar/28.19.3743. [DOI] [PMC free article] [PubMed] [Google Scholar]
- Simpson KL, Houlihan JM, Holmes CH. Complement regulatory proteins in early human fetal life: CD59, membrane co-factor protein (MCP) and decay-accelerating factor (DAF) are differentially expressed in the developing liver. Immunology. 1993;80:183–190. [PMC free article] [PubMed] [Google Scholar]
- Spear BT. Alpha-fetoprotein gene regulation: lessons from transgenic mice. Semin Cancer Biol. 1999;9:109–116. doi: 10.1006/scbi.1998.0087. [DOI] [PubMed] [Google Scholar]
- Spear BT, Tilghman SM. Role of Alpha-Fetoprotein Regulatory Elements in Transcriptional Activation in Transient Heterokaryons. Mol Cell Biol. 1990;10:5047–5054. doi: 10.1128/mcb.10.10.5047. [DOI] [PMC free article] [PubMed] [Google Scholar]
- Srinivas S, Rodriguez T, Clements M, Smith JC, Beddington RS. Active cell migration drives the unilateral movements of the anterior visceral endoderm. Development. 2004;131:1157–1164. doi: 10.1242/dev.01005. [DOI] [PubMed] [Google Scholar]
- Suzuki A, Zheng Y-W, Kaneko S, Onodera M, Fukao K, Nakauchi H, Taniguchi H. Clonal identification and characterization of self-renewing pluripotent stem cells in the developing liver. J Cell Biol. 2002;156:173–184. doi: 10.1083/jcb.200108066. [DOI] [PMC free article] [PubMed] [Google Scholar]
- Tam PP, Gad JM, Kinder SJ, Tsang TE, Behringer RR. Morphogenetic tissue movement and the establishment of body plan during development from blastocyst to gastrula in the mouse. BioEssays. 2001;23:508–517. doi: 10.1002/bies.1070. [DOI] [PubMed] [Google Scholar]
- Thomas P, Brown A, Beddington R. Hex: a homeobox gene revealing peri-implantation asymmetry in the mouse embryo and an early transient marker of endothelial cell precursors. Develop. 1998;125:85–94. doi: 10.1242/dev.125.1.85. [DOI] [PubMed] [Google Scholar]
- Tilghman SM. The structure and regulation of the alpha-fetoprotein and albumin genes. Oxf Surv Eukaryot Genes. 1985;2:160–206. [PubMed] [Google Scholar]
- Tilghman SM, Belayew A. Transcriptional control of the murine albumin/alpha-fetoprotein locus during development. Proc Natl Acad Sci USA. 1982;79:5254–5257. doi: 10.1073/pnas.79.17.5254. [DOI] [PMC free article] [PubMed] [Google Scholar]