

Abstract
Sequestration of parasitized erythrocytes in the central nervous system microcirculation and increased cerebrospinal fluid lactate are prominent features of cerebral malaria (CM), suggesting that sequestration causes mechanical obstruction and ischemia. To examine the potential role of ischemia in the pathogenesis of CM, Plasmodium berghei ANKA (PbA) infection in CBA mice was compared to infection with P. berghei K173 (PbK) which does not cause CM (the non-CM model, NCM). Cerebral metabolite pools were measured by 1H nuclear magnetic resonance spectroscopy during PbA and PbK infections. Lactate and alanine concentrations increased significantly at the terminal stage of CM, but not in NCM mice at any stage. These changes did not correlate with parasitemia. Brain NAD/NADH ratio was unchanged in CM and NCM mice at any time studied, but the total NAD pool size decreased significantly in the CM mice on day 7 after inoculation. Brain levels of glutamine and several essential amino acids were increased significantly in CM mice. There was a significant linear correlation between the time elapsed after infection and small, progressive decreases in the cell density/cell viability markers glycerophosphocholine and N-acetylaspartate in CM, indicative of gradual loss of cell viability. The metabolite changes followed a different pattern, with a sudden significant alteration in the levels of lactate, alanine, and glutamine at the time of terminal CM. In NCM, there were significant decreases with time of glutamate, the osmolyte myo-inositol, and glycerophosphocholine. These results are consistent with an ischemic change in the metabolic pattern of the brain in CM mice, whereas in NCM mice the changes were more consistent with hypoxia without vascular obstruction. Mild obstructive ischemia is a likely cause of the metabolic changes during CM, but a role for immune cell effector molecules cannot be ruled out.
The pathogenesis of cerebral malaria (CM), the most serious complication of malaria infection, remains controversial. One contentious issue is the role of sequestration of parasitized red blood cells (PRBCs) and whether this leads to ischemia. 1,2 A crucial role in human CM for ischemia, because of blockage of cerebral vessels, was first postulated by Laveran 3 as early as 1893. Since then a number of groups 2,4-8 have investigated the mechanical obstruction purported to be caused by sequestration of PRBCs in the cerebral vessels. Quantitative studies have correlated sequestration of PRBCs in the cerebral microvasculature with the occurrence of human CM. 7-9
A predictable consequence of sequestration of PRBCs in the brain vessels would be reduced regional, or even global, cerebral blood flow and prolonged cerebral transit time leading to stagnant hypoxia. In a study on adult patients with CM, 6 cerebral oxygen consumption was shown to be low in >90% of comatose cases. Cerebrospinal fluid lactate content increased and was found to be a sensitive prognostic index of CM in humans. 5,6 However, cerebral blood flow rates in CM patients have been reported to be within the normal range for healthy adults. 6 A lack of evidence for cerebral hypoperfusion during human CM also has been reported. 10 These findings question whether sequestration of PRBCs in the cerebral microvessels does lead to mechanical obstruction. These studies were performed on adult Thai CM patients, in whom the disease pathogenesis may differ from that in African children. Some workers 1 argue that factors other than ischemia must play an important role in the pathogenesis of CM, because ischemia cannot plausibly explain all of the pathological manifestations of CM, for example the rapidity of recovery from coma and the low incidence of severe neurological complications thereafter. These latter processes distinguish the outcome of CM from that of ischemic cerebrovascular accidents.
To further examine the potential role of ischemia in the pathogenesis of CM, P. berghei ANKA (PbA) infection was studied in CBA mice. In this, the most commonly used murine malaria model of CM, cerebral complications develop at ∼days 5 to 6 after inoculation and increase to a peak at day 7 after inoculation, with the animals showing neurological and histopathological signs reminiscent of CM in humans. 11-13 Murine CM is an immunopathological condition 14-18 involving cytokines, CD4+ T lymphocytes, nonneuronal central nervous system (CNS) cells (microglia and astrocytes), and activation of the kynurenine pathway of tryptophan metabolism. Obstruction of the CNS microvasculature, as epitomized by retinal vessels, does occur in murine CM. 19 We therefore investigated whether CNS lactate accumulation occurs during murine CM.
Factors such as the level of parasitemia, 20 increased production of tumor necrosis factor-α 21 and anemia, 22 which could all be present in severe malaria infection, may also predispose to lactic acidosis. We therefore measured brain alanine as another indicator of the onset of tissue anoxia and anaerobic glycolysis. 23 The brain levels of various amino acids also were investigated, because amino acid concentrations may change during ischemia and such changes can reflect the metabolic status of the ischemic tissue. 23-25
Materials and Methods
Inoculation of Mice
The malaria parasites used were P. berghei, either PbA (Dr. G. Grau, Université de la Méditerranée, Marseille, France) or P. berghei K173 (PbK) (Dr. I. Clark, Australian National University, Canberra, Australia). Female CBA/T6 mice (6 to 8 weeks old) weighing 20 to 25 g were inoculated by intraperitoneal injection of 10 6 PRBCs as described previously. 17 As expected, 11,12 mice inoculated with PbA developed cerebral complications and became terminally ill between days 6 and 7 after inoculation. Mice inoculated with PbK (NCM mice) did not develop CM, but showed signs of malaria at ∼day 13 after inoculation and became moribund between days 14 and 22, presumably of severe anemia, as expected. 26
Sample Preparation
Mice infected with PbA were sacrificed either when they became clinically moribund with CM or as indicated in Results. For PbK infection, mice were sacrificed either when they became critically ill with anemia or as indicated in Results. Mice were sacrificed by decapitation in such a way that the heads fell straight into liquid nitrogen. Whole brain samples were chiseled out of the frozen head before further processing.
For proton nuclear magnetic resonance (1H-NMR) analyses and high-performance liquid chromatography (HPLC) quantification of amino acids, whole brain samples were extracted in 6% (w/v) ice-cold HClO4 and neutralized to pH 7.2 with 1 mol/L of KOH. For 1H-NMR, neutralized supernate (2 ml) was freeze-dried and the lyophilized samples reconstituted in 0.65 ml of 2H2O, containing 2 mmol/L 2,2,3,3-tetradeuterotrimethylsilyl,1-propionic acid as an internal chemical shift and concentration reference. For HPLC analysis, the neutralized supernate was diluted 1 in 10 (v/v) with nanopure water, and 40 μl was mixed with 40 μl of o-phthaladehyde (OPA) reagent (1 mg/ml solution; Sigma Chemical Co., St. Louis, MO) and 5 μl of β-mercaptoethanol (BDH Chemicals, Poole, England), 2 minutes prior to injection onto the HPLC column.
For spectrophotometric assay of lactate, pyruvate, and adenosine triphosphate (ATP), whole frozen mouse brain samples were weighed and homogenized in 2 ml of 3 mol/L ice-cold HClO4. The brain homogenate was centrifuged at 5000 × g for 30 minutes at 4°C, and the supernates retrieved and neutralized to pH 7.0. 27
For quantification of NAD(H) whole brain samples were weighed quickly in 4 ml of ice-cold buffer (1 mmol/L bathophenanthrolinedisulfonic acid (Sigma Chemical Co., St. Louis, MO), 0.2 mol/L KCN, 0.06 mol/L KOH) and then homogenized, extracted twice with chloroform, 28 and filtered through 0.45-μm positively charged nylon-66 filters (Rainin microfilterfuge tube; Woburn, MA) by centrifuging at 16,000 × g for 10 minutes and 4°C to remove RNA and DNA. The filtrates were stored at −80°C until analyzed by HPLC.
Blood samples (0.4 ml) taken quickly via axillary artery laceration were mixed with 0.4 ml of 3 mol/L ice-cold HClO4, left on ice for 10 minutes, and then centrifuged for 30 minutes at 5000 × g at 4°C. The supernates were neutralized to pH 7.0 with 2 mol/L of KHCO3 and used for spectrophotometric determination of blood lactate and pyruvate.
To differentiate between intrinsic factors (such as NAD or thiamin deficiencies) and extrinsic factors (eg, ischemia) as the cause of the changes in brain metabolites, recovery experiments were performed to test whether brain cells from malaria-infected mice could revert to normal metabolism in vitro in the presence of O2 and glucose. For this, mice were sacrificed by cervical dislocation, their brains removed, and the cerebral cortices dissected and sliced into 350-μm axial sections using a McIllwain tissue chopper (Mickle Laboratory Engineering Co. Ltd.). The slices were washed three times and then incubated for 60 minutes to allow metabolic recovery in a modified Krebs-Henseleit buffer (124 mmol/L NaCl, 5 mmol/L KCl, 1.2 mmol/L KH2PO4, 1.2 mmol/L MgSO4, 26 mmol/L NaHCO3, 5 mmol/L glucose, and 1.2 mmol/L CaCl2). 29 After incubation, slices were removed by filtration, extracted in 6% (w/v) HClO4, and treated for 1H-NMR analyses as described above. The intracellular [K+], an index of slice metabolic integrity, 30 was determined by flame photometry.
1H-NMR Spectroscopy
All 1H-NMR spectra (see example in Figure 1 ▶ ) were acquired at 600.13 MHz on a Bruker AMX-600 spectrometer, using a gradient inverse probe, across 64-kb data points using a spectral width of 6000 Hz, a duty cycle of 30 seconds for fully-relaxed spectra, and consisted of the sum of 32 transients. Spectra were transformed with 0.5 Hz of exponential multiplication and two degrees of zero filling. Concentrations of the various compounds were determined by integral comparison of the resonance of interest with that from 2,2,3,3-tetradeuterotrimethylsilyl,1-propionic acid. Integrals were obtained either by fitting Lorentzian line shapes to the resonances or by standard integration.
Figure 1.
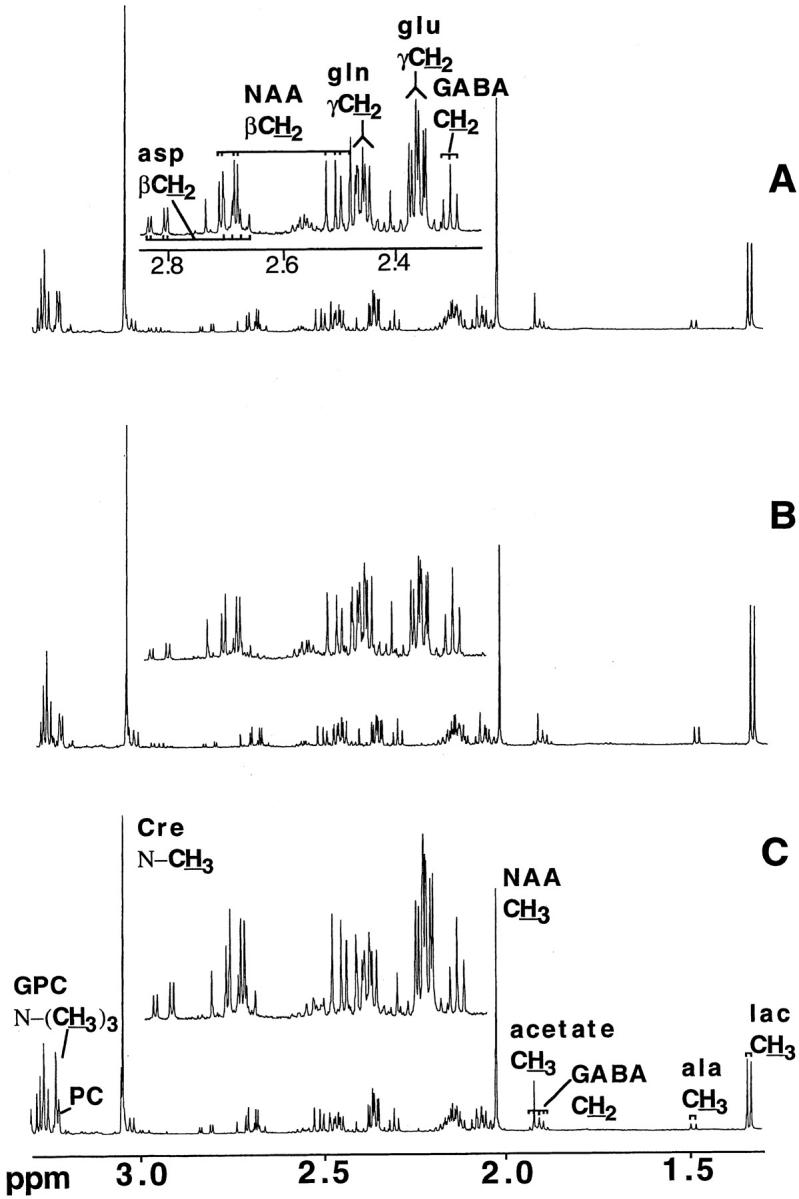
Typical 600.13 MHz NMR spectra of perchloric acid extracts of mouse brains. A: Control mouse. B: CM mouse. C: NCM mouse. Spectra represent the sum of 32 transients and were transformed with two degrees of zero filling and 0.5 Hz exponential multiplication. Abbreviations: GABA, γ-aminobutyric acid; NAA, N-acetylaspartate; GPC, glycerophosphocholine; Cre, creatine; Lac, lactate.
Spectrophotometric Assays
Brain and blood lactate were also measured spectrophotometrically using the Boehringer Mannheim kit that uses a method modified from that of Gutman and Wahlfeld. 30 Brain and blood pyruvate were measured as reported previously. 32 ATP was measured using the Sigma diagnostics kit (Sigma Chemical Co., St. Louis, MO).
HPLC Analyses
Brain NAD and NADH were quantified as described, 28 using an LC 18 column (25 × 0.46 cm) with a 2-cm guard (Supelco, Bellefonte, PA). The mobile phase consisted of 0.2 mol/L ammonium acetate (pH 6.2) and HPLC-grade methanol (Mallinckrodt, Victoria, Australia), initially at 96:4 (v/v). After 1 minute the methanol was set to increase at 0.2% per minute for 25 minutes. The flow rate throughout was 1 ml/min. The eluent was monitored using a Perkin Elmer (Norwalk, CT) LC 240 fluorescence detector (7-μl flow cell), with excitation wavelength set at 330 nm and emission wavelength at 460 nm. Amino acids were quantified as reported previously. 33
Statistical Analysis
Data were subjected to nonparametric analysis of variance to determine whether sufficient grounds for further analysis existed. Where this was established, data were analyzed by Mann-Whitney U test. Correlation coefficients were determined using Spearman’s Rank test. Values of P ≤ 0.02 were considered significant.
Results
Brain Concentrations of Lactate, Pyruvate, and Alanine
Whole brain concentrations of lactate and alanine were determined by 1H-NMR at various time points after parasite inoculation. The concentrations of lactate and alanine increased significantly, to approximately twice the normal values, only in mice suffering from CM on days 6 to 7 after inoculation (Table 1) ▶ . These changes did not correlate with the degree of parasitemia.
Table 1.
Brain Lactate and Alanine (μmol/g Wet Weight) as Measured by 1H-NMR and Parasitemia in Control Uninfected, P. berghei ANKA-Infected (CM), and P. berghei K173-Infected (NCM) Mice
| CBA control (n = 7) | CM | NCM | |||||
|---|---|---|---|---|---|---|---|
| Day 4 (n = 6) | Day 5 (n = 6) | Days 6–7 (n = 7) | Day 7 (n = 6) | Day 9 (n = 6) | Days 14–22 (n = 6) | ||
| Lactate | 1.52 ± 0.08 | 1.54 ± 0.08 | 1.70 ± 0.11 | 3.08 ± 0.25* | 1.71 ± 0.14 | 1.38 ± 0.10 | 1.71 ± 0.25 |
| Alanine | 0.25 ± 0.01 | 0.26 ± 0.01 | 0.26 ± 0.02 | 0.49 ± 0.03* | 0.28 ± 0.02 | 0.29 ± 0.02 | 0.34 ± 0.05 |
| Parasitemia | 0 | 2.7 ± 0.4* | 8.5 ± 1.0* | 20.8 ± 1.1* | 2.8 ± 0.4* | 19.2 ± 3.9* | 73.5 ± 1.7* |
Values are mean ± SEM, with the number of mice given in parentheses.
*Indicates P < 0.02 when compared with control uninfected mice.
Pyruvate could not be detected by NMR and therefore was assessed spectrophotometrically, together with lactate (Table 2) ▶ . This technique confirmed that brain lactate was increased in CM at days 6 to 7 after inoculation but not in NCM during the same period or at the terminal stage of infection (days 14 to 22 after inoculation). Again, there was no correlation with parasitemia. Brain pyruvate was significantly increased in NCM mice on days 14 to 22 after inoculation (Table 2) ▶ . The lactate:pyruvate ratio was increased more than threefold in the brain in CM mice on days 6 to 7 after inoculation. Blood lactate concentration fell significantly in both the CM mice and NCM mice on days 6 to 7 after inoculation, but was significantly increased in NCM on days 14 to 22 after inoculation (Table 2) ▶ . Blood pyruvate concentration was normal in CM and NCM mice on days 6 to 7 after inoculation but significantly increased in NCM mice on days 14 to 22 after inoculation. The blood lactate:pyruvate ratio was significantly decreased in CM mice days 6 to 7 after inoculation and NCM on days 14 to 22 after inoculation but not in NCM on days 6 to 7 after inoculation.
Table 2.
Lactate and Pyruvate in Brain and Blood from Control Uninfected, P. berghei ANKA-Infected (CM) and P. berghei K173-Infected (NCM) Mice, and Corresponding Parasitemias
| Sample | Parameter | Control | CM (days 6–7) | NCM (days 6–7) | NCM (days 14–22) |
|---|---|---|---|---|---|
| Brain | Lactate (μmol/g wet wt) | 1.50 ± 0.06 | 6.38 ± 0.44* | 1.50 ± 0.02 | 1.71 ± 0.06 |
| Pyruvate (μmol/g wet wt) | 0.39 ± 0.02 | 0.44 ± 0.02 | 0.40 ± 0.01 | 0.66 ± 0.03* | |
| Lactate:pyruvate ratio | 3.8 ± 0.1 | 14.2 ± 0.3* | 3.7 ± 0.1 | 2.6 ± 0.1* | |
| Blood | Lactate (μmol/mL) | 5.64 ± 0.08 | 3.74 ± 0.19* | 4.63 ± 0.17 | 10.06 ± 0.21* |
| Pyruvate (μmol/mL) | 0.18 ± 0.01 | 0.16 ± 0.01 | 0.14 ± 0.05 | 0.75 ± 0.06* | |
| Lactate:pyruvate ratio | 31.8 ± 1.1 | 23.6 ± 0.6* | 32.4 ± 0.2 | 12.5 ± 0.5* | |
| Parasitemia | 0 | 13.2 ± 2.2* | 10.1 ± 0.6* | 66.2 ± 1.9* |
Values are mean ± SEM (n = 5).
*Indicates P < 0.01 (Mann-Whitney U test) compared to uninfected control values.
Brain NAD/NADH and ATP
The NAD to NADH ratio was similar between uninfected and CM mice on day 6 after inoculation (Table 3) ▶ . However, the total NAD pool (NAD + NADH) decreased significantly, by ∼18%, in CM mice. These parameters did not change significantly in the NCM mice. Brain ATP concentrations were similar in all groups studied [control uninfected, 4.2 ± 0.2 μmol/g wet weight (n = 6); CM day 7 after inoculation, 3.6 ± 0.5 (n = 6); NCM day 7 after inoculation, 3.7 ± 0.5 (n = 5); NCM day 15 after inoculation, 4.5 ± 0.2 (n = 5)].
Table 3.
Brain NAD/NADH Ratio and Total NAD Pool (nmol/g Wet Weight) in Control Uninfected, P. berghei ANKA-Infected (CM) and P. berghei K173-Infected (NCM) Mice
| CBA control | CM | NCM | ||
|---|---|---|---|---|
| Day 7 | Day 7 | Day 18 | ||
| NAD/NADH ratio | 1.56 ± 0.11 | 1.59 ± 0.12 | 1.51 ± 0.15 | 1.19 ± 0.08 |
| (n = 7) | (n = 8) | (n = 5) | (n = 5) | |
| NAD pool | 0.51 ± 0.02 | 0.42 ± 0.01* | 0.46 ± 0.03 | 0.44 ± 0.02 |
| (n = 7) | (n = 8) | (n = 5) | (n = 5) | |
Values are mean ± SEM, with the number of mice given in parentheses.
*Indicates P < 0.005 when compared with control uninfected mice.
1H-NMR Analysis of Brain Metabolites
Brain glutamate concentration decreased significantly in NCM mice on days 14 to 22 after inoculation compared with controls, whereas glutamine increased significantly in CM on days 6 to 7 after inoculation (Table 4) ▶ . The level of the neuronal marker N-acetylaspartate 34 was significantly decreased in CM mice on days 6 to 7 after inoculation, but not in NCM mice at any stage. Succinate and glycine levels increased significantly in CM, but not NCM, mice. Levels of the cell membrane marker glycerophosphocholine and the organic osmolyte myo-inositol decreased significantly at the later stages in NCM mice (Table 4) ▶ .
Table 4.
Concentration of Various Amino Acids and Metabolites in the Brain Homogenates Prepared from Control Uninfected, P. berghei ANKA-Infected (CM) and P. berghei K173-Infected (NCM) Mice on Various Days after Inoculation (p.i.) as Measured by 1H-NMR
| CBA control (n = 7) | CM | NCM | |||||
|---|---|---|---|---|---|---|---|
| Day 4 p.i. (n = 6) | Day 5 p.i. (n = 6) | Days 6–7 p.i. (n = 7) | Day 7 p.i. (n = 6) | Day 9 p.i. (n = 6) | Days 14–22 p.i. (n = 6) | ||
| Glutamate | 4.12 ± 0.10 | 4.08 ± 0.11 | 4.41 ± 0.21 | 3.49 ± 0.24 | 3.99 ± 0.17 | 3.48 ± 0.25 | 3.28 ± 0.34‡ |
| Aspartate | 1.22 ± 0.06 | 1.22 ± 0.05 | 1.39 ± 0.05 | 0.94 ± 0.13 | 1.21 ± 0.08 | 1.05 ± 0.09 | 1.04 ± 0.09 |
| Glutamine | 1.86 ± 0.04 | 1.66 ± 0.09 | 1.67 ± 0.09 | 2.59 ± 0.09‡ | 1.68 ± 0.04 | 2.29 ± 0.16 | 3.07 ± 0.55 |
| NA | 2.68 ± 0.06 | 2.53 ± 0.08 | 2.40 ± 0.12 | 2.23 ± 0.10† | 2.57 ± 0.10 | 2.41 ± 0.09 | 2.48 ± 0.20 |
| GABA | 1.02 ± 0.03 | 0.97 ± 0.03 | 0.99 ± 0.04 | 1.15 ± 0.06 | 0.96 ± 0.04 | 0.95 ± 0.02 | 0.90 ± 0.09 |
| Succinate | 0.21 ± 0.02 | 0.18 ± 0.04 | 0.26 ± 0.02 | 0.34 ± 0.03† | 0.22 ± 0.02 | 0.22 ± 0.02 | 0.20 ± 0.04 |
| Glycine | 0.55 ± 0.02 | 0.53 ± 0.04 | 0.48 ± 0.04 | 0.70 ± 0.04* | 0.50 ± 0.02 | 0.56 ± 0.01 | 0.57 ± 0.05 |
| Myo-inositol | 2.97 ± 0.09 | 3.18 ± 0.16 | 3.30 ± 0.22 | 2.49 ± 0.17 | 2.95 ± 0.13 | 2.85 ± 0.16 | 2.12 ± 0.18‡ |
| GPC | 0.51 ± 0.03 | 0.47 ± 0.02 | 0.44 ± 0.03 | 0.40 ± 0.04 | 0.48 ± 0.02 | 0.37 ± 0.04* | 0.34 ± 0.03‡ |
| Tyrosine | 0.07 ± 0.01 | 0.09 ± 0.01 | 0.05 ± 0.02 | 0.10 ± 0.02 | 0.11 ± 0.01 | 0.05 ± 0.01 | 0.13 ± 0.05 |
Values are mean ± SEM, expressed in μmol/g wet weight, with the number of mice in each group given in parentheses.
*Indicates P < 0.02 when compared with control uninfected mice.
†P < 0.01.
‡P < 0.005.
NA, N-acetyl aspartate; GABA, γ-aminobutyric acid; GPC, glycerophosphocholine.
Brain Amino Acids Measured by HPLC
The brain concentrations of valine, leucine, isoleucine, histidine, and threonine were significantly increased in CM mice on days 6 to 7 after inoculation, but not in NCM mice (Table 4) ▶ . Lysine and phenylalanine increased significantly in both CM on days 6 to 7 and NCM on days 13 to 17. The concentrations of arginine and methionine decreased significantly solely in NCM mice on days 13 to 17 after inoculation.
Metabolic Recovery of Brain Slices in Vitro
To distinguish between extrinsic (eg, hypoxia and cytokines/malarial toxins) and intrinsic (eg, NAD or thiamin deficiency) factors as being responsible for the observed cerebral lactic acidosis and amino acid changes, cortical brain slices of control and PbA-infected mice were incubated in a modified Krebs-Henseleit buffer bubbled with carbogen gas (95% O2/5% CO2) and the concentrations of lactate, alanine, γ-aminobutyric acid, glutamate, aspartate, and glutamine determined as an index of metabolic performance and recovery of brain cells from the changes observed in vivo. The brain slices from CM mice behaved like those from control, uninfected mice, as judged from the concentrations of the metabolites (Figure 2) ▶ , and returned to normal levels in vitro. Intracellular K+ concentrations (a marker of slice viability) 30 determined by flame photometry after 1 hour of incubation showed no significant difference between control and CM tissue slices.
Figure 2.

Recovery of metabolic profile in brain slices. Cortical slices from P. berghei ANKA-infected (dark columns) and uninfected mice (light columns) were incubated in brain slice buffer for 1 hour. Slices were removed at regular intervals to determine viability. Abbreviations: Lac, lactate; GABA, γ-aminobutyrate. Columns and bars are mean ± SD (n = 3).
Discussion
Lactate and Alanine as Markers of Ischemia
Human CM is a multifactorial condition, 1-3,35 as is murine CM. 16,17,36 In adult Thai patients, a 100% mortality rate was seen when cerebrospinal fluid lactate values exceeded twice the normal level, 5 suggesting that metabolic disturbances in the brain may reflect a fundamental pathological process. A similar result has now been obtained in murine CM, allowing investigations of the underlying mechanisms. An increase in the total brain concentration of lactate, specific to CM mice on days 6 to 7 after inoculation, was observed independent of the method used to measure lactate concentration (Tables 1 and 2) ▶ ▶ . In other systems, brain lactate increases in ischemic episodes, 37 presumably because of decreased flux of pyruvate into the Krebs cycle in the absence of oxygen and a concomitant increased flux of pyruvate through the lactate dehydrogenase reaction to maintain the NAD/NADH ratio (the Pasteur effect).
Alanine, also produced from pyruvate via alanine transaminase, is considered a better marker than lactate of the degree of hypoxia. The concentration of alanine increases proportional to the degree of hypoxia, unlike the levels of lactate which are more responsive to mild hypoxia and tend to plateau in severe hypoxia. 38 Lactate and alanine are readily transported from neurons and glia and, under conditions of normal unobstructed blood flow, are prevented from accumulating by removal via the circulation. Therefore, a build-up of these metabolites is consistent both with a decrease in the available oxygen and a decrease in perfusion. This, together with the demonstration that regions of intravascular obstruction and reduced erythrocyte perfusion of CNS microvessels are evident in CM mice from day 5 after inoculation onwards, 19 is consistent with the notion that ischemia occurs during murine CM.
Glycerophosphocholine is primarily accepted as an indicator of cell density, the concentration being relative to the total membrane choline ester content. 39 N-acetylaspartate, a compound found only in neurons, is accepted as a marker of neuronal density and neuronal mitochondrial activity. 40 Declining N-acetylaspartate levels are indicative either of neuronal death, or of decreased neuronal mitochondrial viability, both of which can occur in transient ischemic episodes. 41
Inspection of the time course of change of metabolites in brain in murine CM showed that the change in concentrations of lactate [P = 0.0004, rs (Spearman’s rank correlation coefficient) = 0.71], alanine (P = 0.0009, rs = 0.67), NA (P = 0.0025, rs = −0.60), and glycerophosphocholine (GPC) (P = 0.012, rs = −0.51) correlated significantly (n = 25) with time. However, examination of the time course of change of lactate and alanine revealed that it is best described as nonlinear, with the majority of the increase taking place at days 6 to 7 after inoculation (Table 4) ▶ . By contrast, the time-course of change of the cellular markers NA and GPC was gradual, with progressive decreases across the course of the disease (NA and GPC correlated significantly with one another, P = 0.0001, rs = 0.82). Unlike the acute markers of ischemia (alanine and lactate) the time course of change of other metabolites, such as Krebs cycle intermediates glutamate and aspartate, the polyol myo-inositol, and the energy carrier creatine, was similarly gradual, declining in tandem with the cellular marker GPC (gluamate, P = 0.0007, rs = 0.68; aspartate, P = 0.015, rs = 0.49; myo-inositol, P = 0.0005, rs = 0.70; creatine, P = 0.0004, rs = 0.71). This scenario is consistent with gradual loss of cell viability throughout the course of the disease, followed by an ischemic insult, most likely at the level of small vessels, on days 6 to 7 after inoculation.
By contrast, the metabolite profile in brain in malaria infection without cerebral involvement was more illustrative of hypoxia (ie, oxygen deprivation but with cerebral blood flow maintained). There was no significant correlation of the ischemia markers lactate (P = 0.52, rs = 0.159) and alanine (P = 0.053, rs = 0.414) with time, whereas there was a significant decrease with time in the metabolites glutamate (P = 0.004, rs = −0.59), myo-inositol (P = 0.003, rs = −0.60) and the cellular marker GPC (P = 0.0004, rs = −0.72). The oxygen deprivation experienced in non-CM because of the low hematocrit would seem to have caused loss of cellular viability and metabolites, as illustrated by the significant linear correlations of the cellular marker GPC with various metabolites (glutamate, P = 0.0001, rs = 0.86; myo-inositol, P = 0.0001, rs = 0.79; creatine, P = 0.0014, rs = 0.65; aspartate, P = 0.0039, rs = 0.59; γ-aminobutyric acid, P = 0.01, rs = 0.53).
An increase in the concentrations of brain lactate and alanine could represent a shift to anaerobic respiration independent of changes in blood flow. For example, lactic acidosis could be induced by tumor necrosis factor-α 21 or a deficiency in NAD and thiamin that are needed to convert pyruvate to acetyl CoA. The increase in brain lactate in murine CM is likely because of an increase in local production rather than movement of lactate into the CNS, as blood lactate concentration decreased in CM mice on days 6 to 7 after inoculation (Table 2) ▶ . This argues against a major role for systemic tumor necrosis factor-α, through its actions on peripheral organs, in the development of CNS lactic acidosis during murine CM, although the involvement of locally produced tumor necrosis factor-α in the CNS 42 certainly cannot be ruled out. The observed increases in brain lactate and alanine (Tables 1 and 2) ▶ ▶ did not correlate with parasitemia, so production of these metabolites by circulating malaria parasites seems not to be a major determinant of these changes.
Brain cells did recover metabolic viability after incubation of brain slices in the presence of glucose and a mixture of 95% O2 and 5% CO2, as indicated by the re-establishment of normal pool sizes of lactate, alanine, glutamate, and glutamine (Gln) (Figure 2) ▶ and return of intracellular [K+] to normal. This suggests that the biochemical changes observed in the brains of the CM mice were not because of factors intrinsic to the brain cells (such as NAD or thiamin deficiency).
Does Ischemia Play a Role in the Pathogenesis of Murine CM?
The exact cause of the ischemia that seems to occur in murine CM is unknown. Two factors may contribute: attachment of monocytes to CNS vascular endothelial cells, and cerebral edema. Both are prominent features of murine CM. Processes such as up-regulation of adhesion molecules on endothelial cells, attachment of monocytes and platelets to endothelium, redistribution of astrocytes and microglia, increased permeability to protein of the blood-brain barrier, and CNS vascular obstruction, all commence on ∼days 3 to 5 after inoculation. 13,19 This is before brain lactate increases (Table 1) ▶ , suggesting that the metabolic events occur as a result of the earlier changes. Lactic acidosis is thought to enhance brain damage under ischemic conditions, leading to cytotoxic brain edema and, eventually, irreversible death of glia and neurons. 43-45 Thus, the development of CNS lactic acidosis may be a crucial factor that predisposes to a deleterious outcome in murine CM. This may also be true for severe human CM where the concentration of lactate in the CNS increases, 5,6 and CNS lactic acidosis correlates with a bad prognosis. 5,46
A number of factors question whether vascular obstruction (induced by blood cell sequestration) plays a dominant role in the development of the biochemical changes that seem to signify brain ischemia in CM. The sequestration observed during CM in humans does not affect the brain uniformly. 47-49 Similarly, the vascular obstruction in murine CM, observed in retinal whole mounts, is not widespread. 19 Furthermore, localizing neurological signs (such as limb weakness, hemiplegia, and cranial nerve deficits) are not classical features of CM, and this distinguishes this condition from embolic or thrombotic cerebrovascular accidents. Cerebral edema accompanied by raised intracranial pressure may provide a plausible explanation. When intracranial pressure is sufficiently elevated by the mass effect of the edema fluid, cerebral perfusion pressure becomes low, predisposing the tissue to ischemia. 50 Furthermore, severe cerebral edema may cause brain dysfunction through brain distortion and herniation. 50 Cerebral edema and increased intracranial pressure have been shown to occur in most children suffering from CM, 51,52 although only the very severe cases associated with transtentorial herniation and cardiorespiratory arrest are thought to become fatal. 53 However, in studies on adults from South East Asia, multiple organ involvement is the typical finding during severe P. falciparum infection and the principal causes of death are pulmonary edema, and acute renal and circulatory failure with metabolic acidosis. 54 The observation that opening pressures are normal in 80% of Thai adults suffering from CM 55 contrasts with the findings in African children 51,52 and suggests that whereas cerebral edema may contribute to mortality from CM in African children, its role in adults is uncertain. It therefore seems that CM in humans is an end-stage clinical syndrome with multiple pathophysiological input, which depends on the age of the patient and perhaps some geographically related features also.
Changes in Metabolites and Amino Acids
Brain glycine increased only in CM mice on days 6 to 7 after inoculation (Table 4) ▶ , the time when the mice exhibited neuro-excitatory signs of CM, notably convulsions. glycine enhances the neuro-excitatory responses mediated through the N-methyl-d-aspartate receptor. 56 We reported previously 17 that quinolinic acid, probably acting via the N-methyl-d-aspartate receptor, may contribute to the neuro-excitatory signs of murine CM. Considered together, the propensity for neuro-excitation is likely to be increased during murine CM, reinforcing the notion that neuro-excitation mediated via the N-methyl-d-aspartate receptor is a factor in the pathogenesis of murine CM.
The brain concentrations of the essential amino acids valine, leucine, isoleucine, and histidine increased only in CM mice on days 6 to 7 after inoculation (Table 5) ▶ , perhaps because of reduced catabolism. The branched chain amino acids valine, leucine, and isoleucine are normally converted by transamination to their corresponding α-keto acids, which are then converted to acyl-CoA derivatives by oxidative decarboxylation. A defect in one or both of these two steps would result in the accumulation of the branched chain amino acids; if the defect were at the level of decarboxylation, the corresponding α-keto acids would also accumulate. The build up of these amino acids in the CNS, as is the case in maple syrup urine disease, may lead to acute ketoacidosis that can cause lethargy, seizures, and coma, 57 which are important features of both human and murine CM. Overall, the changes in brain amino acids observed during murine CM were similar to those reported in rodents suffering from acute thiamin deficiency, 58 in which a breakdown of the blood-brain barrier, cerebral edema and petechial hemorrhages are prominent features. The changes did not show any simple correlation with parasitemia so presumably were not a consequence of amino acid production by the circulating malaria parasites.
Table 5.
Concentration of Amino Acids Measured by HPLC Analysis in Brain of Control Uninfected, P. berghei ANKA-Infected (CM) and P. berghei K173-Infected (NCM) Mice, and Corresponding Parasitemias
| CBA control (n = 10) | CM Days 6–7 p.i. (n = 11) | NCM | ||
|---|---|---|---|---|
| Days 6–7 p.i. (n = 11) | Days 13–17 p.i. (n = 11) | |||
| Val | 162 ± 5 | 509 ± 99‡ | 177 ± 4 | 196 ± 13 |
| Leu | 152 ± 6 | 417 ± 87† | 159 ± 3 | 176 ± 13 |
| Ile | 82 ± 4 | 191 ± 40† | 80 ± 4 | 84 ± 5 |
| His | 21 ± 1 | 38 ± 4† | 21 ± 1 | 22 ± 2 |
| Thr | 538 ± 21 | 707 ± 37† | 524 ± 24 | 686 ± 58 |
| Lys | 213 ± 7 | 463 ± 52‡ | 230 ± 10 | 421 ± 32‡ |
| Phe | 78 ± 3 | 171 ± 16‡ | 93 ± 2† | 166 ± 14‡ |
| Arg | 260 ± 15 | 227 ± 14 | 240 ± 15 | 174 ± 11‡ |
| Met | 52 ± 3 | 52 ± 3 | 61 ± 1* | 39 ± 2† |
| Parasitemia | 0 | 15.6 ± 1.0 ‡ | 2.4 ± 0.3† | 58.5 ± 4.4‡ |
Amino acid values are mean ± SEM, expressed in nmol/g wet weight, with the number of mice in each group given in parentheses. Metabolites underlined are those in which changes occurred only during CM.
*P < 0.01.
†P < 0.005.
‡P < 0.0005 when compared with control, uninfected mice.
Conclusions
Together, the results suggest that ischemia or locally produced cytokines, or both, may contribute significantly to the pathogenesis of murine CM and that the observed increase in brain lactate is because of local CNS production. We currently are investigating the roles of ischemia and cytokines in the metabolic changes observed in murine CM.
Footnotes
Address reprint requests to Professor Nicholas Hunt, Department of Pathology (D06), University of Sydney, N.S.W. 2006, Australia. E-mail: nhunt@pathology.usyd.edu.au.
Supported by a grant from the National Health and Medical Research Council of Australia, an AusAID scholarship from the Australian Government (to L. S.), a University of Sydney Faculty of Medicine postgraduate scholarship (to A. M.), and by the Rolf Edgar Lake Fellowship of the Faculty of Medicine, University of Sydney (to C. R.).
Current address of L. A. S.: National Institute for Medical Research, The Ridgeway, Mill Hill, London NW7 1AA, UK.
References
- 1.Clark IA, Rockett KA: The cytokine theory of human cerebral malaria. Parasitol Today 1994, 10:410-412 [DOI] [PubMed] [Google Scholar]
- 2.Berendt AR, Turner GDH, Newbold CI: Cerebral malaria: the sequestration hypothesis. Parasitol Today 1994, 10:412-414 [DOI] [PubMed] [Google Scholar]
- 3.Warrell DA: Pathophysiology of severe falciparum malaria in man. Parasitology 1987, 94:S53-S76 [DOI] [PubMed] [Google Scholar]
- 4.Raventos-Suarez C, Kaul DK, Macaluso F, Nagel RL: Membrane knobs are required for the microcirculatory obstruction induced by Plasmodium falciparum-infected erythrocytes. Proc Natl Acad Sci USA 1985, 82:3829-3833 [DOI] [PMC free article] [PubMed] [Google Scholar]
- 5.White NJ, Warrell DA, Looareesuwan S, Chanthavanich P, Phillips RE, Pongpaew P: Pathophysiological and prognostic significance of cerebrospinal-fluid lactate in cerebral malaria. Lancet 1985, 1:776-778 [DOI] [PubMed] [Google Scholar]
- 6.Warrell DA, White NJ, Veall N, Looareesuwan S, Chanthavanich P, Phillips RE, Karbwang J, Pongpaew P, Krishna S: Cerebral anaerobic glycolysis and reduced cerebral oxygen transport in human cerebral malaria. Lancet 1988, 2:534-538 [DOI] [PubMed] [Google Scholar]
- 7.MacPherson GG, Warrell MJ, White NJ, Looareesuwan S, Warrell DA: Human cerebral malaria. A quantitative ultrastructural analysis of parasitized erythrocyte sequestration. Am J Pathol 1985, 119:385-401 [PMC free article] [PubMed] [Google Scholar]
- 8.Pongponratn E, Riganti M, Punpoowong B, Aikawa M: Microvascular sequestration of parasitized erythrocytes in human falciparum malaria: a pathological study. Am J Trop Med Hyg 1991, 44:168-175 [DOI] [PubMed] [Google Scholar]
- 9.Turner G: Cerebral malaria. Brain Pathol 1997, 7:569-582 [DOI] [PMC free article] [PubMed] [Google Scholar]
- 10.Clavier N, Rahimy C, Falanga P, Ayivi B, Payen D: No evidence for cerebral hypoperfusion during cerebral malaria. Crit Care Med 1999, 27:628-632 [DOI] [PubMed] [Google Scholar]
- 11.Rest JR: Cerebral malaria in inbred mice. I. A new model and its pathology. Trans R Soc Trop Med Hyg 1982, 76:410-415 [DOI] [PubMed] [Google Scholar]
- 12.Thumwood CM, Hunt NH, Clark IA, Cowden WB: Breakdown of the blood-brain barrier in murine cerebral malaria. Parasitology 1988, 96:579-589 [DOI] [PubMed] [Google Scholar]
- 13.Neill AL, Hunt NH: Pathology of fatal and resolving Plasmodium berghei cerebral malaria in mice. Parasitology 1992, 105:165-175 [DOI] [PubMed] [Google Scholar]
- 14.Grau GE, Piguet PF, Engers HD, Louis JA, Vassalli P, Lambert PH: L3T4+ T-lymphocytes play a major role in the pathogenesis of murine cerebral malaria. J Immunol 1986, 137:2348-2354 [PubMed] [Google Scholar]
- 15.Grau GE, Piguet PF, Lambert PH: Immunopathology of malaria: role of cytokine production and adhesion molecules. Memorias do Instituto Oswaldo Cruz 1992, 87(Suppl 5):95-100 [DOI] [PubMed] [Google Scholar]
- 16.Medana IM, Hunt NH, Chan-Ling T: Early activation of microglia in the pathogenesis of fatal murine cerebral malaria. Glia 1997, 19:91-103 [DOI] [PubMed] [Google Scholar]
- 17.Sanni LA, Thomas SR, Tattam BN, Moore DE, Chaudhri G, Stocker R, Hunt NH: Dramatic changes in oxidative tryptophan metabolism along the kynurenine pathway in experimental cerebral and non-cerebral malaria. Am J Pathol 1998, 152:611-619 [PMC free article] [PubMed] [Google Scholar]
- 18.Curfs JH, Schetters TP, Hermsen CC, Jerusalem CR, van Zon AA, Eling WM: Immunological aspects of cerebral lesions in murine malaria. Clin Exp Immunol 1989, 75:136-140 [PMC free article] [PubMed] [Google Scholar]
- 19.Chan-Ling T, Neill AL, Hunt NH: Early microvascular changes in murine cerebral malaria detected in retinal wholemounts. Am J Pathol 1992, 140:1121-1130 [PMC free article] [PubMed] [Google Scholar]
- 20.Lando G, Djiogue R, Djoumessi S: Prognostic value of lactate determination in cerebral malaria in the Cameroonian child. Bulletin de la Societe de Pathologie Exotique 1995, 88:152-155 [PubMed] [Google Scholar]
- 21.Starnes HF, Jr, Warren RS, Jeevanandam M, Gabrilove JL, Larchian W, Oettgen HF, Brennan MF: Tumor necrosis factor and the acute metabolic response to tissue injury in man. J Clin Invest 1988, 82:1321-1325 [DOI] [PMC free article] [PubMed] [Google Scholar]
- 22.Mizock BA: Lactic acidosis. Bone RC eds. Disease-a-Month. 1989, :pp 233-300 Year Book Medical Publishers, Chicago [DOI] [PubMed] [Google Scholar]
- 23.Nilsson GE, Lutz PL: Release of inhibitory neurotransmitters in response to anoxia in turtle brain. Am J Physiol 1991, 261:R32-R37 [DOI] [PubMed] [Google Scholar]
- 24.Erecinska M, Nelson D, Wilson DF, Silver IA: Neurotransmitter amino acids in the CNS. I. Regional changes in amino acid levels in rat brain during ischemia and reperfusion. Brain Res 1984, 304:9-22 [DOI] [PubMed] [Google Scholar]
- 25.Nilsson GE, Winberg S: Changes in the brain levels of GABA and related amino acids in anoxic shore crab (Carcinus maenas). Am J Physiol 1993, 264:R733-R737 [DOI] [PubMed] [Google Scholar]
- 26.Neill AL, Hunt NH: Effects of endotoxin and dexamethasone on cerebral malaria in mice. Parasitology 1995, 111:443-454 [DOI] [PubMed] [Google Scholar]
- 27.Matsuoka M, Igisu H, Kohriyama K, Inoue N: Suppression of neurotoxicity of ammonia by L-carnitine. Brain Res 1991, 567:328-331 [DOI] [PubMed] [Google Scholar]
- 28.Klaidman LK, Leung AC, Adams JD: High-performance liquid chromatography analysis of oxidised and reduced pyridine dinucleotides in specific brain regions. Anal Biochem 1995, 228:312-317 [DOI] [PubMed] [Google Scholar]
- 29.Bader-Goffer RS, Bachelard HS, Morris PG: Cerebral metabolism of acetate and glucose studied by 13C NMR spectroscopy. Biochem J 1990, 266:133-139 [DOI] [PMC free article] [PubMed] [Google Scholar]
- 30.McIlwain H, Bachelard HS: Biochemistry and the Central Nervous System, ed 5 1985, Churchill Livingstone, Edinburgh
- 31.Gutman I, Wahlfeld AW (Eds): Lactate, ed 2. New York and London, Verlag Chemi, Weinheim/Academic Press, Inc., 1974
- 32.Lamprecht W, Heinz F (Eds): Pyruvate, ed 3. New York and London, Verlag Chemie, Weinheim/Academic Press Inc.; 1985
- 33.Neuzil J, Gebicki JM, Stocker R: Radical-induced chain oxidation of proteins and its inhibition by chain-breaking antioxidants. Biochem J 1993, 293:601-606 [DOI] [PMC free article] [PubMed] [Google Scholar]
- 34.Urenjak J, Williams SR, Gadian GD, Noble M: Proton nuclear magnetic resonance spectroscopy unambiguously identifies different neural cell types. J Neurosci 1993, 13:981-989 [DOI] [PMC free article] [PubMed] [Google Scholar]
- 35.Clark IA, Rockett KA, Cowden WB: Role of TNF in cerebral malaria. Lancet 1991, 337:302-303 [DOI] [PubMed] [Google Scholar]
- 36.Ma N, Hunt NH, Madigan MC, Chan-Ling T: Correlation between enhanced vascular permeability, up-regulation of cellular adhesion molecules and monocyte adhesion to the endothelium in the retina during the development of fatal murine cerebral malaria. Am J Pathol 1996, 149:1745-1762 [PMC free article] [PubMed] [Google Scholar]
- 37.Tombaugh GC, Sapolsky RM: Evolving concepts about the role of acidosis in ischaemic neuropathology. J Neurochem 1993, 61:793-803 [DOI] [PubMed] [Google Scholar]
- 38.Ben-Yoseph O, Bader-Gofer RS, Morris PG, Bachelard HS: Glycerol 3-phosphate and lactate as indicators of cytoplasmic redox state in severe and mild hypoxia respectively; a 13C and 31P NMR study. Biochem J 1993, 291:915-919 [DOI] [PMC free article] [PubMed] [Google Scholar]
- 39.Miller BL, Chang L, Booth R, Ernst T, Cornford M, Nikas D, McBride D, Jenden DJ: In vivo 1H MRS choline: correlation with in vitro chemistry/histology. Life Sci 1996, 58:1929-1935 [DOI] [PubMed] [Google Scholar]
- 40.Bates TE, Strangward M, Keelan J, Davey GP, Munro PM, Clarke JB: Inhibition of N-acetylaspartate production: implications for 1H MRS studies in vivo. Neuroreport 1995, 7:1397-1400 [PubMed] [Google Scholar]
- 41.de Stefano N, Matthews PM, Arnold DL: Reversible decreases in N-acetylaspartate after acute brain injury. Magn Reson Med 1996, 34:721-727 [DOI] [PubMed] [Google Scholar]
- 42.Clark IA, al Yaman FM, Jacobson LS: The biological basis of malarial disease. Int J Parasitol 1997, 27:1237-1249 [DOI] [PubMed] [Google Scholar]
- 43.Siesjo BK: Acidosis and ischaemic brain damage. Neurochem Pathol 1988, 9:31-88 [DOI] [PubMed] [Google Scholar]
- 44.Staub F, Baethmann A, Peters J, Kempski O: Effects of lactacidosis on volume and viability of glial cells. Acta Neurochirurgica 1990, 51:S3-S6 [DOI] [PubMed] [Google Scholar]
- 45.Staub F, Mackert B, Kempski O, Peters J, Baethmann A: Swelling and death of neuronal cells by lactic acid. J Neurol Sci 1993, 119:79-84 [DOI] [PubMed] [Google Scholar]
- 46.Molyneux ME, Taylor TE, Wirima JJ, Borgstein A: Clinical features and prognostic indicators in paediatric cerebral malaria: a study of 131 comatose Malawian children. Q J Med 1989, 71:441-459 [PubMed] [Google Scholar]
- 47.Nagatake T, Hoang VT, Tegoshi T, Rabbege J, Ann TK, Aikawa M: Pathology of falciparum malaria in Vietnam. Am J Trop Med Hyg 1992, 47:259-264 [DOI] [PubMed] [Google Scholar]
- 48.Sein KK, Maeno Y, Thuc HV, Anh TK, Aikawa M: Differential sequestration of parasitized erythrocytes in the cerebrum and cerebellum in human cerebral malaria. Am J Trop Med Hyg 1993, 48:504-511 [DOI] [PubMed] [Google Scholar]
- 49.Sein KK, Brown AE, Maeno Y, Smith CD, Corcoran KD, Hansukjariya P, Webster HK, Aikawa M: Sequestration pattern of parasitized erythrocytes in cerebrum, mid-brain, and cerebellum of Plasmodium coatneyi-infected rhesus monkeys (Macaca mulatta). Am J Trop Med Hyg 1993, 49:513-519 [DOI] [PubMed] [Google Scholar]
- 50.Miller JD, Ironside JW: Raised intracranial pressure, oedema and hydrocephalus. 6th ed. Graham DI Lantos PL eds. Greenfield’s Neuropathology, 1997, :pp 157-195 Oxford University Press, London [Google Scholar]
- 51.Waller D, Crawley J, Nosten F, Chapman D, Krishna S, Craddock C, Brewster D, White NJ: Intracranial pressure in childhood cerebral malaria. Trans R Soc Trop Med Hyg 1991, 85:362-364 [DOI] [PubMed] [Google Scholar]
- 52.Newton CR, Kirkham FJ, Winstanley PA, Pasvol G, Peshu N, Warrell DA, Marsh K: Intracranial pressure in African children with cerebral malaria. Lancet 1991, 337:573-576 [DOI] [PubMed] [Google Scholar]
- 53.Newton CR, Crawley J, Sowumni A, Waruiru C, Mwangi I, English M, Murphy S, Winstanley PA, Marsh K, Kirkham FJ: Intracranial hypertension in Africans with cerebral malaria. Arch Dis Child 1997, 76:219-226 [DOI] [PMC free article] [PubMed] [Google Scholar]
- 54.: World Health Organisation: Severe and complicated malaria, 2nd ed. Trans R Soc Trop Med Hyg 1990, 84(Suppl 2):1-65 [PubMed] [Google Scholar]
- 55.Warrell DA, Looareesuwan S, Phillips RE, White NJ, Warrell MJ, Chapel HM, Areekul S, Tharavanij S: Function of the blood-cerebrospinal fluid barrier in human cerebral malaria: rejection of the permeability hypothesis. Am J Trop Med Hyg 1986, 35:882-889 [DOI] [PubMed] [Google Scholar]
- 56.Stone YW: Glycine and kynurenine enhance NMDA sensitivity in rat hippocampal slices. Life Sci 1991, 48:765-772 [DOI] [PubMed] [Google Scholar]
- 57.Tanaka K: Disorders of organic acid metabolism. Gaull GE eds. Biology of Brain Dysfunction. 1975, :pp 145-214 Plenum Press, New York [Google Scholar]
- 58.Gaitonde MK, Fayein NA, Johnson AL: Decreased metabolism in vivo of glucose into amino acids of the brain of thiamine-deficient rats after treatment with pyrithiamine. J Neurochem 1975, 24:1215-1223 [DOI] [PubMed] [Google Scholar]