

Abstract
The increased fractional clearance of albumin in nephrotic states has long been attributed to glomerular permselectivity dysfunction. Using radiolabeled rat serum albumin, transferrin, IgG, and polydisperse Ficoll, this study investigated the changes in their in vivo fractional clearance in puromycin aminonucleoside nephrosis and anti-glomerular basement membrane glomerulonephritis. In control rats the lack of charge selectivity was confirmed by the demonstration that carboxymethyl Ficoll (valence ∼−39) had the same fractional clearance as uncharged Ficoll. Both diseases exhibited similar effects on fractional clearance measurements suggesting an underlying common mechanism. In disease, there was good agreement between the fractional clearance of proteins determined by radioactivity as compared to those determined by radioimmunoassay. A small increase in the fractional clearance for IgG was evident in disease as compared to controls, which mirrored the change in the equivalent size Ficoll, suggesting that the increase is because of the development of a small proportion of large pores in the glomerular capillary wall. There was no increase, however, in the fractional clearance of Ficoll of equivalent size to albumin in either disease, yet the fractional clearance of the albumin increased by 12 to 14 times as determined by radioactivity and 4500 to 6600 times as determined by radioimmunoassay. This study demonstrates that glomerulonephritis is not a disease associated with changes in glomerular permeability to albumin but is because of alterations in albumin processing by cells distal to the glomerular basement membrane. It is also apparent that approaches to glomerular pathology and proteinuria as risk factors in renal disease must be reassessed.
Increased urinary albumin or protein excretion is a hallmark of glomerulonephritis. 1-5 This is determined by measuring urinary protein, usually albumin in the urine by radioimmunoassay (RIA) or by nonspecific total protein assays involving precipitation or by dye-binding protein assays. To account for these increases, a model of large pores, has been proposed 6,7 because it had been assumed that virtually all proteins filtered by the kidney are excreted intact. However, recent studies have identified significant flaws in this hypothesis as the immunochemical assays used to measure albumin, and other high molecular weight proteins, only measure intact protein. This is important because proteins are normally degraded during renal passage. 8-14 We have shown that albumin undergoes a high degree of fragmentation (>90%), resulting in small peptide fragments <10 kd being excreted in the urine in both rodents and humans. 8-14 The fragmentation process occurs in cells distal to the glomerular basement membrane (GBM), the most likely location being the tubular epithelial cells where albumin is endocytosed and trafficked to the lysosomes (termed the “degradation pathway”). Once fragmented, the proteins are exocytosed into the tubular lumen and excreted in the urine. These degradation products produced by the kidney are found only in the urine and not in the blood. They are not the result of contamination of fragments produced by extrarenal sources. Albumin RIAs and many of the nonspecific total protein assays fail to detect fragmented albumin. 11,13-15 Thus, there is in fact a much larger excretion of albumin by the normal kidney than previously assumed and this will have a profound influence on urinary excretion measurements. IgG and transferrin undergo similar processing to albumin as studied in healthy rats by the degradation pathway, in that they are subject to extensive fragmentation before excretion. 12 An inhibition of the fragmentation mechanism could result in an apparent increase in the excretion of intact molecules without a change in the excretion of the total amount of the molecule (intact plus fragments) and the filtration properties of the glomerular capillary wall (GCW).
Recent studies have demonstrated that in addition to a fragmentation process, an albumin retrieval mechanism operates to return ∼99% of filtered albumin back to the blood supply. 9,16 A possible location for this retrieval pathway is the glomerular epithelial cell or proximal tubular cell, a location that would allow the early retrieval of the albumin, resulting in only a small fraction of filtered albumin being delivered to the degradation pathway. An inhibition of the retrieval pathway will result in an increase in the fractional clearance (FC) of total albumin without any change to glomerular permselectivity.
Puromycin aminonucleoside (PAN) 1,3,10,17-20 and anti-GBM antibodies 2,4,21,22 have both been used to induce massive glomerular injury. Pronounced morphological changes at the GCW are induced by PAN including a loss of foot process, a spreading of epithelial cell cytoplasm, a lifting of focal areas of the epithelial cells, 18 the appearance of microvilli, 3 and a thin, less compact appearance to the GBM. Anti-GBM glomerulonephritis (GN) also results in substantial glomerular changes including glomerular crescent formation, 22 vascular sclerosis, 4 and an increasing loss of the endothelial layer. 2 These morphological changes have been considered the cause of the development of large pores in the GCW and hence the increased excretion of proteins.
This study set out to examine the FC of albumin, IgG, and transferrin in control rats as compared with rats with PAN or anti-GBM GN. As the albumin RIA has been shown to only detect intact albumin, radiolabeled proteins were used, in addition to the RIA, as a comparative method of determining FC as radiolabeling allows the detection of both intact and fragmented protein. The FC of Ficolls of equivalent radius to albumin, transferrin, and IgG are also measured to account for any changes in the permeability properties of the GCW.
Materials and Methods
Materials
Rabbit anti-rat transferrin, rabbit anti-rat albumin, 125I (10 mCi), and bovine IgG were obtained from ICN Biomedicals Inc., Aurora, OH. Benzoylated dialysis tubing (molecular weight cut-off, 2000), rat serum albumin (RSA), rat transferrin, rabbit anti-rat IgG (whole molecule, adsorbed with human IgG), rat IgG, sodium azide, bovine apo-transferrin, PAN, Freund’s complete adjuvant, polydisperse Ficoll type 70, and thimerosal were obtained from Sigma Chemicals, St. Louis, MO. Alzet osmotic pumps (model 2001) were obtained from Alza Pharmaceuticals, Palo Alto, CA. Nembutal (60 mg/ml) was obtained from Rhone Mirieux Australia Pty Ltd., Pinkenba, Queensland, Australia. Sodium-[3H]hydride (132 mCi/mg) and tritiated water were obtained from NEN Research Products Du Pont, Wilmington, DE. Q-Sepharose, Sephacryl S-300, Sephadex G-100, Sephadex G-25 in PD-10 columns, and Blue dextran T2000 were purchased from Pharmacia Fine Chemicals, Uppsala, Sweden. Carboxymethyl Ficoll 40 with 13.8% carboxyl content (equivalent to a net negative charge of −0.34 per sucrose unit according to the manufacturer) was supplied by TdB Consultancy, Uppsala, Sweden (for a Ficoll of molecular weight 40,000 substituted with carboxymethyl cellulose the valence would be ∼−39). Anesthetic ether was purchased from Ajax Chemicals, Auburn, Australia. Sheep anti-rabbit antibody was generously supplied by David Casley of the Department of Medicine, Austin and Repatriation Medical Center, Australia.
Experimental Design
Normal or diseased rats were constantly infused with radiolabeled proteins (albumin, transferrin, or IgG) or polydisperse Ficoll for a 7-day period via mini osmotic pumps. Blood and 24-hour urine collections were made on days 2, 5, and 7. Animals were killed 7 days after pump implantation and the radioactive material in blood, urine, and one kidney examined to determine the FC of individual molecules.
Experimental Animals
Eight-week-old male Sprague-Dawley rats were obtained from the Monash University Central Animal House. Throughout the experimental period they were maintained as pairs, housed in rat boxes, under a 12-hour day/night cycle with free access to standard rat chow and water. All IgG and transferrin experimental groups contained 7 rats, all albumin experimental groups contained 14 rats, and the polydisperse Ficoll 70 experimental groups contained 7 PAN rats and 6 control and anti-GBM GN rats. Permission to perform these animal experiments was given by Monash University Animal Ethics Committee.
Induction of PAN Nephritis
Induction of PAN was performed as previously described 3,17,19 with the dosage of PAN according to Osicka and colleagues. 17 Briefly the rats were immobilized by towel wrapping and an injection of 10 mg/100g body weight of PAN made up as a 3.5% solution in phosphate-buffered saline (PBS), was administered via the tail vein. Osmotic pumps were implanted on day 2 after PAN administration. Animals were killed 7 days later, with one kidney taken for assessment of disease pathology (see below). Age- and weight-matched controls were administered with an equivalent volume of PBS. After killing, one kidney was removed for assessment of disease pathology and the other kidney was analyzed for radioactivity. Controls were age and weight matched.
Tissues for pathological assessment were fixed in 10% neutral-buffered formalin and embedded in paraffin. Sections (2 μm) were stained with hematoxylin and eosin (H&E) or periodic acid-Schiff reagents. Immunohistochemistry staining for ED1+ macrophages and W3/13+ T cells was performed on 4-μm paraffin sections. After hydration, sections were microwaved for 10 minutes in 0.01 mol/L sodium citrate buffer, pH 6.0, to enhance antigen detection. Immunostaining used a three-layer peroxidase anti-peroxidase method with the chromogen 3,3,diaminobenzidine (Sigma Chemical Co.), as previously described. 21
Induction of Anti-GBM Glomerulonephritis
Passive accelerated anti-GBM GN was induced in rats as previously described. 21 Briefly, the rats were immunized subcutaneously with 5 mg of normal sheep IgG in Freund’s complete adjuvant and 7 days later were injected intravenously with 5 ml/kg of sheep anti-rat GBM serum. Osmotic pumps were implanted 3 hours before anti-GBM serum administration. Animals were killed 7 days after anti-GBM serum injection, with one kidney taken for assessment of disease pathology (as described above), and the other kidney analyzed for radioactivity. Controls were age and weight matched.
Radiolabeling of Proteins
IgG and transferrin were tritiated using the reductive methylation technique. 23 The specific activities achieved were: [3H]transferrin 1.921 × 10⁷dpm/mg, and [3H]IgG 1.635 × 10⁷dpm/mg.
Polydisperse Ficoll 70 and carboxymethyl Ficoll 40 were tritiated according to Van Damme and colleagues. 24 The specific activity of polydisperse Ficoll 70 was 2.2 × 10 7 dpm/mg and carboxymethyl Ficoll 40 was 5.9 × 10 5 dpm/mg.
The RSA was labeled with 14C using a reductive methylation technique modified from Eng 25 using [14C]formaldehyde. The specific activity achieved was 2.02 × 10⁶dpm/mg.
Column Chromatography
Plasma and urine samples were analyzed using a Sephadex G-100 column (column dimensions, 1.5 × 75 cm2) or a Sephacryl S-300 column (column dimensions, 2 × 66 cm2). The columns were run at 4°C with a flow rate of 20 ml/h and the buffer changed to PBS with 2 mg/ml of bovine serum albumin and 0.02% sodium azide. The columns were calibrated using blue dextran (2 mg/ml) and tritiated water to determine the void volume and the total volume, respectively. Ninety-five fractions of ∼1.65 ml (G-100) or ∼1.45 ml (S-300) were collected with recoveries between 95 and 105% obtained. Kav was determined by the formula (Ve − Vo)/(Vt − Vo), where Vo is the void volume, Ve the elution volume, and Vt is the total volume of the column.
The Kav for radiolabeled albumin, transferrin, and IgG on Sephacryl S-300 was 0.510, 0.429, and 0.367, respectively. The FC of [3H]Ficoll corresponding to these protein radii was then determined by examining the elution of urine and plasma samples containing [3H]Ficoll at these Kav values.
In Vivo FC Studies of Radiolabeled Proteins and Polydisperse Ficoll 70 Using the Osmotic Pump Method
As previously described 12 Alzet osmotic pumps were filled with [14C]albumin and one of [3H]IgG, [3H]transferrin or polydisperse [3H]Ficoll 70, along with 0.002% w/v of thimerosal to inhibit bacterial growth. The Alzet osmotic pumps model 2001 have a mean filling volume of 227 ± 6 μl, pumping rate 0.96 ± 0.04 μl/hour, length 3 cm, diameter 0.7 cm, and unfilled weight 1.1 g. Once filled the pumps were then incubated in PBS for 4 hours at 37°C. The concentrations of radioactivity initially in the pump were [3H]IgG ∼5.26 × 10 8 dpm/ml, [3H]transferrin ∼6.79 × 10 8 dpm/ml, [14C]RSA ∼1.62 × 10 7 dpm/ml, and polydisperse [3H]Ficoll 2.54 × 10 8 dpm/ml.
The rats were anesthetized with ether and the osmotic pumps were implanted subcutaneously between the scapulae using sterile technique. The rats were given one pump filled with [3H]Ficoll 70 or two pumps, one with [14C]albumin and one with either [3H]immunoglobulin or [3H]transferrin. The rats were then maintained as pairs in rat boxes with free access to food and water at all times, being placed in metabolic cages on days 2, 5, and 7 for 24 hours where urine collections and corresponding plasma samples were taken at the end of the urine collection period. Both blood and urine samples were centrifuged at 3000 rpm in a KS-5200C Kubota bench top centrifuge (Kubota Corp., Tokyo, Japan) for 10 minutes and then analyzed for radioactivity. Samples taken on days 2, 5, and 7 to ensure that steady state was reached on day 7 as shown previously using the same osmotic pumps. 12 Figure 1 ▶ demonstrates that labeled protein (data shown for albumin) remains intact from day 0 to day 7 within the osmotic pump and in day 7 plasma for control, PAN, and anti-GBM GN rats. Degradation products were not present in these samples. On day 7 the animals were anesthetized with Nembutal and sacrificed by cardiac puncture and their kidneys were removed for radioactivity analysis and histological assessments. Figure 2 ▶ examines the turnover over a bolus injection of [3H]albumin in various tissues including the kidney. Throughout the period of 7 days plasma radioactivity continuously decreases with significant uptake particularly by the muscle tissue. Uptake by the liver and kidney was relatively low (<5%). There was no evidence of tissue uptake with rapid resynthesis and disappearance of labeled material from the tissue into the plasma. Glomerular filtration rate was determined by the creatinine assay. 26 The urine flow rate was determined by measuring the volume of the 24-hour urine collection in ml.
Figure 1.
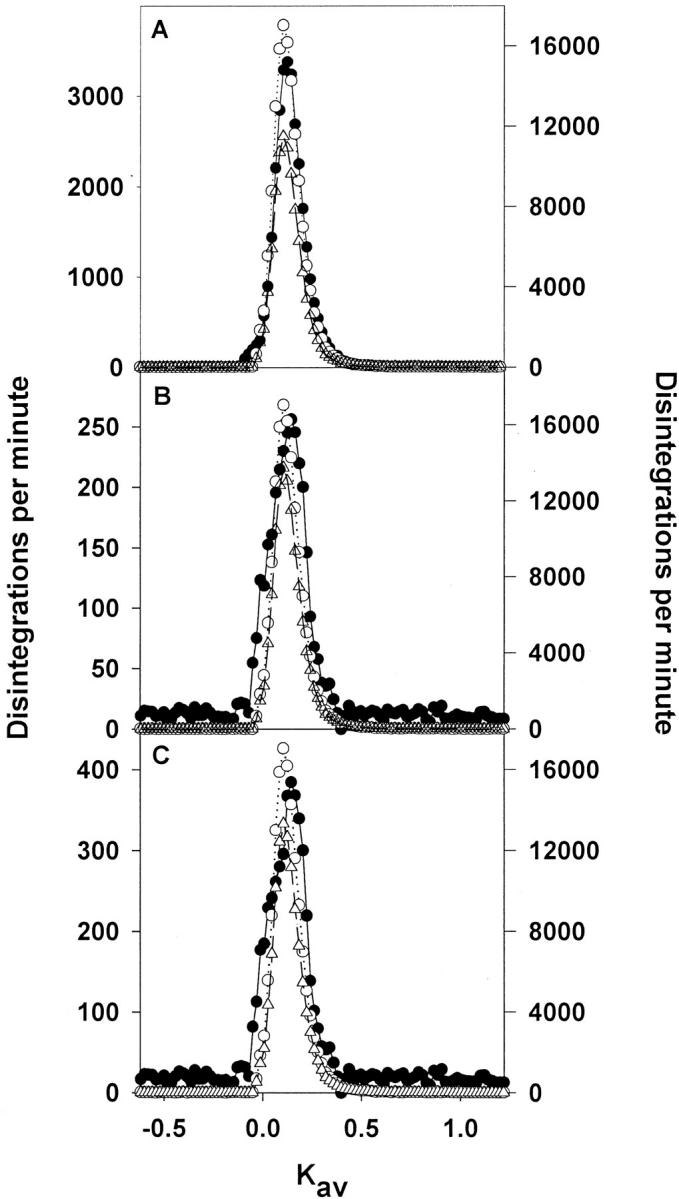
Representative size exclusion chromatography profiles on Sephadex G-100 of stock [14C]albumin that was loaded into the osmotic pump (open circle, right y axis) on day 0, [14C]albumin from the osmotic pump on day 7 of the osmotic pump administration (open triangle, right y axis), and [14C]albumin in the plasma on day 7 of the osmotic pump administration (filled circle, left y axis). A: Control rat (stock 182,500 dpm loaded, day 7 osmotic pump contents 164,500 dpm loaded, plasma 27,500 dpm loaded). B: PAN rat (stock 182,500 dpm loaded, day 7 osmotic pump contents 176,500 dpm loaded, plasma 2250 dpm loaded. C: Anti-GBM GN rat (stock 182,500 dpm loaded, day 7 osmotic pump contents 165,500 dpm loaded, plasma 3950 dpm loaded).
Figure 2.

Percentage of the injected radioactivity in plasma and organ tissue at various intervals after administration (intravenously) of [3H]RSA (1 × 10⁸dpm) in different rats. At various times after injection (0.25, 1, 2, 4, 24, and 168 hours) (n = 4, each time point) the rats were sacrificed by cardiac puncture, and the organs (kidneys, liver, spleen, and muscle) were removed, weighed, and digested with 1.4 mol/L NaOH. The percentage of injected radioactivity was estimated by assuming that a rat weighing ∼400 g has, on average, 15 ml of blood (7 ml plasma), 10 g of liver, and 100 g of muscle.
In Vivo FC Studies of Radiolabeled Polydisperse Ficoll 70 and Carboxymethyl Ficoll 40 Using a Short-Term Steady-State Method
Because the specific activity of the carboxymethyl Ficoll 40 was too low to allow it to be used in the osmotic pumps we examined its clearance as compared to uncharged Ficoll by a short-term steady-state method. Sprague-Dawley rats were injected in the tail vein with 4.0 × 10 7 dpm of [3H]Ficoll 70 or 2.0 × 10 7 dpm of [3H]carboxymethyl Ficoll 40 and placed in a metabolic cage. Urine was collected between 4 and 6 hours (around midday to 2 pm) after the injection by the urine container in the metabolic cage and by collection from the bladder at 6 hours. All experiments were performed at the same time of day. There was a small reduction in the plasma radioactivity throughout this period; the plasma concentration for molecules with 36Å radius was taken as the mean of 4- and 6-hour plasma radioactivity as determined by size exclusion chromatography. Although this method is not as accurate as the osmotic pump method, the major issue to be resolved is whether there were significant differences in the FC of Ficoll 70 as compared to carboxymethyl Ficoll 40. Blood was collected via the tail vein into an heparinized syringe at 4 hours and a cardiac puncture was performed at 6 hours with a heparinized syringe. All blood and urine samples were spun at 3,000 rpm for 10 minutes in a Kubota bench centrifuge and the resulting plasma and urine counted for radioactivity. Plasma and urine samples at 6 hours were analyzed for creatinine. 26 The plasma and urine samples were fractionated on a Sephacryl S-300 column as described vide supra and FCs of fractions with radii of 36Å determined. The charge integrity of the carboxymethyl Ficoll was checked on Q-Sepharose where it would normally elute at a sodium chloride concentration of 0.45 mol/L under a linear gradient eluting condition of sodium chloride concentration ranging from 0.05 to 1.2 mol/L. The charge concentration of the carboxymethyl Ficoll was not changed after excretion in urine. The salt concentration required to elute the carboxymethyl Ficoll from Q-Sepharose is equivalent to a dextran sulfate with a degree of substitution of 0.4 sulfates per glucose residue.
Processing of Albumin in Vivo
To examine possible degradation products arising from the extra-renal degradation of albumin, rats were anesthetized and their kidneys were prevented from filtering by occlusion of both ureters. After 10 minutes, ∼2 × 10 7 dpm of [3H]albumin was injected into the femoral vein. The rats were then maintained under anesthesia for 4 hours. The rats were then sacrificed by cardiac puncture and the plasma analyzed for radioactivity. The integrity of the labeled tracer in the plasma was also analyzed by size exclusion chromatography.
Analysis of Kidneys for Radioactivity
One of the kidneys excised from the rat was weighed, minced, and made up to 3 ml with 1.4 mol/L NaOH in glass centrifuge tubes (the other kidney was used for histology). The centrifuge tubes were covered loosely and suspended in boiling water for 15 to 30 minutes to allow complete digestion. Four sample aliquots of 100 μl each were taken, 50 μl of hydrogen peroxide was added to decolorize the samples, and the volume made up to 1 ml with 850 μl of water. Four μl of scintillation fluid was added to the samples and they were rested in the dark overnight to reduce chemiluminescence. The samples were counted for radioactivity and the presence of the tracer in the kidneys determined as dpm/g of tissue.
Albumin RIA
The RIA used 125I-labeled RSA, prepared using the Chloramine T method, 27 rabbit antiserum (polyclonal) to rat albumin, and sheep anti-rabbit antibodies. The urinary albumin concentration measured by this double-antibody RIA had an interassay coefficient of variation of 7% at a concentration of 180 ng/ml. The detection limit of the assay was 31.2 ng/ml. The standard curve was prepared using a RSA standard (1 mg/ml) that was diluted to give a range of 4000 to 31.2 ng/ml.
IgG RIA
The RIA used 125I-labeled rat serum IgG, prepared according to the Chloramine T method 27 using 10 μl of a 1 mg/ml IgG standard, rabbit antiserum (polyclonal) to rat IgG, sheep anti-rabbit antibodies, and nonimmune rabbit serum. The detection limit of the assay was 31.2 ng/ml. The standard curve was prepared using a rat serum IgG standard (1 mg/ml) that was diluted to give a range of 4000 to 31.2 ng/ml.
Transferrin RIA
The RIA used 125I-labeled rat serum transferrin, prepared according to the Chloramine T method 27 using 10 μl of a 1 mg/ml transferrin standard, rabbit antiserum (polyclonal) to rat transferrin, sheep anti-rabbit antibodies, and nonimmune rabbit serum. The detection limit of the assay was 6 ng/ml. The standard curve was prepared using a rat serum IgG standard (1 mg/ml) that was diluted to give a range of 1600 to 6 ng/ml.
Total Protein Assay
Total urinary protein was measured with a bicinchoninic acid protein assay kit (that measures peptide bonds) (Pierce, Rockford, IL).
Counting of Radioactivity
Tritium and [14C] radioactivity was determined using a 1:3 sample to Optiphase scintillation fluid ratio 28 and recorded on a Wallac 1409 liquid scintillation counter (Wallac, Finland).
Statistics
All data are expressed as mean ± SD with n representing the number of determinations. Significance of results was determined using the Student’s t-tests.
Results
Characteristics of the Diseased Models
The induction of PAN or anti-GBM GN led to an increase in urine flow rate, a reduction in glomerular filtration rate (for PAN), and a reduction of plasma protein concentration (Table 1) ▶ . Microscopically, animals with anti-GBM GN exhibited glomerular hypercellularity, focal periodic acid-Schiff deposits in most glomeruli, occasional early crescents, and tubular casts. There was a marked glomerular and interstitial infiltrate of ED1+ macrophages and W3/13+ T cells, with areas of tubulitis seen. PAN also exhibited glomerular hypercellularity and tubular casts, with prominent macrophage and T-cell infiltration in the interstitium and areas of tubulitis.
Table 1.
Physiological Parameters of the Control, Anti-GBM, and PAN Experimental Groups
| Glomerular filtration rate (ml/min) | Urine flow rate (10−3 ml/min) | Plasma concentration (mg/ml) | |
|---|---|---|---|
| Controls | |||
| Immunoglobulin G (n = 7) | 1.6 ± 0.3 | 8.1 ± 1.4 | 0.8 ± 0.4 |
| Transferrin (n = 7) | 1.8 ± 0.2 | 6.9 ± 1.2 | 3.9 ± 0.5 |
| Albumin (n = 14) | 1.7 ± 0.3 | 7.5 ± 1.4 | 32.7 ± 1.7 |
| Polydisperse Ficoll 70 (n = 6) | 2.0 ± 0.2 | 7.5 ± 1.3 | N/A |
| Anti-GBM | |||
| Immunoglobulin G (n = 7) | 1.7 ± 0.3 | 14.6 ± 9.1 | 0.4 ± 0.2* |
| Transferrin (n = 7) | 1.5 ± 0.4 | 11.3 ± 5.2* | 0.9 ± 0.4† |
| Albumin (n = 14) | 1.6 ± 0.3 | 12.9 ± 7.3* | 8.5 ± 3.7† |
| Polydisperse Ficoll 70 (n = 6) | 1.0 ± 0.4† | 14.6 ± 3.6† | N/A |
| PAN | |||
| Immunoglobulin G (n = 7) | 1.4 ± 0.3 | 27.0 ± 5.7† | 0.3 ± 0.1‡ |
| Transferrin (n = 7) | 1.4 ± 0.2‡ | 12.3 ± 3.0† | 1.2 ± 0.6† |
| Albumin (n = 14) | 1.4 ± 0.2† | 20.2 ± 8.0† | 11.9 ± 4.8† |
| Polydisperse Ficoll 70 (n = 7) | 1.2 ± 0.4† | 17.2 ± 3.9† | N/A |
The plasma concentration of IgG, transferrin, and albumin was measured by RIA. Note that the administered proteins have negligible effect upon these plasma concentrations. n is the number of rats used for the infusion of labeled protein by osmotic pumps. Studies were performed using pairs of proteins, either [3H]IgG and [14C]albumin or [3H]transferrin and [14C]albumin.
N/A, not applicable.
†, P < 0.001; ‡, P < 0.01; *, P < 0.05 versus controls.
Characteristics of Protein Clearance
Table 2 ▶ shows the concentration of radiolabeled material in the plasma as compared to the kidneys on day 7 of the steady-state osmotic pump studies. For all of the tracers there is no more than 2 to 3 times the plasma levels in the kidney, this being representative of normal flux through the kidney, rather than major accumulation of the tracer. In both control and disease states the percentage of the osmotic infusion rate appearing in the urine is <1%. The urinary excretion rate for [14C]albumin was lower than the other labeled compounds because the [14C]albumin had considerably lower specific activity. For all radiolabeled proteins the net amount of protein being infused into the blood supply was negligible compared to the plasma protein concentration.
Table 2.
The Concentration of Radiolabeled Material in the Plasma (dpm/ml) and Kidney (dpm/gm) on Day 7 of the Osmotic Pump Infusion and Corresponding Urinary Excretion Rate
| Plasma (dpm/ml)/104 | Kidney (dpm/gm)/104 | Urinary excretion (dpm/min) | |
|---|---|---|---|
| Controls | |||
| [3H]Immunoglobulin G (n = 7) | 18.6 ± 6.3† | 30.6 ± 4.1 | 730.0 ± 62.0 |
| [3H]Transferrin (n = 7) | 16.6 ± 22.3 | 33.5 ± 3.5 | 750.7 ± 98.1 |
| [14C]Albumin (n = 14) | 0.9 ± 0.2* | 1.1 ± 0.3 | 25.0 ± 3.5 |
| Polydisperse [3H]Ficoll (n = 6) | 2.2 ± 0.7 | 2.0 ± 0.2 | 595.5 ± 66.6 |
| Anti-GBM | |||
| [3H]Immunoglobulin G (n = 7) | 27.8 ± 6.4† | 49.2 ± 7.6 | 4060.9 ± 1335.9 |
| [3H]Transferrin (n = 7) | 20.7 ± 7.1† | 54.3 ± 19.9 | 4928.3 ± 2604.6 |
| [14C]Albumin (n = 14) | 0.3 ± 0.1† | 0.6 ± 0.1 | 91.6 ± 9.7 |
| Polydisperse [3H]Ficoll (n = 6) | 4.4 ± 1.2 | 5.3 ± 2.4 | 620.0 ± 112.2 |
| PAN | |||
| [3H]Immunoglobulin G (n = 7) | 16.7 ± 1.5† | 32.5 ± 3.0 | 3428.0 ± 607.2 |
| [3H]Transferrin (n = 7) | 19.1 ± 3.6† | 45.5 ± 10.9 | 3276.0 ± 1328.8 |
| [14C]Albumin (n = 14) | 0.6 ± 0.1† | 1.5 ± 0.2 | 167.2 ± 30.4 |
| Polydisperse [3H]Ficoll (n = 7) | 6.8 ± 2.0 | 8.5 ± 3.0 | 779.1 ± 68.2 |
n is the number of rats used for the infusion of labeled protein by osmotic pumps. Studies were performed using pairs of proteins, either [3H]IgG and [14C]albumin or [3H]transferrin and [14C]albumin.
†, P < 0.001; *, P < 0.05 plasma (dpm/ml) versus kidney (dpm/gm).
Size exclusion analysis showed that the radiolabeled proteins loaded into the pumps were intact and analysis of the day 7 plasmas showed the radiolabeled proteins to be intact in the circulation with no low-molecular weight material present (Figure 1) ▶ . The size exclusion analysis of the control urines (Figure 3) ▶ showed that in the controls, most of the protein was excreted in the form of fragments, with a small proportion of the radiolabeled proteins excreted in macromolecular form (we use the term “macromolecular” to identify the protein as distinct from “intact” to allow for the possibility that some minor alteration may have occurred to some of the protein during renal passage even though it elutes at essentially the same position on the size exclusion column) (Table 3) ▶ . The degradation is not the result of enzymes present in the urine 9,10 or the result of extrarenal degradation before filtration because the material in the plasma was intact (Figure 1) ▶ . This was further confirmed in studies of control rats with nonfiltering kidneys. At 4 hours after the administration of intact [3H]albumin the plasma contained 2 × 10 6 dpm/ml of radioactivity. When analyzed on Sephadex G-100 (loading quantity, 100,000 dpm) there was no low-molecular weight material present (not shown). If the kidneys had been filtering normally we would have expected at least 720,000 dpm of radiolabeled material (mostly fragments) in urine. The fact that no radiolabeled fragments were observed in the 4-hour plasma provides direct evidence that albumin fragments in urine are produced specifically by the kidney and not by extra-renal sources.
Figure 3.

Representative size exclusion chromatography profiles on Sephadex G-100 of urine from PAN rats (open square), anti GBM rats (open triangle), and age-matched controls (filled circle). A: [3H]IgG in PAN (126,250 dpm loaded) versus [3H]IgG in control (97,540 dpm loaded). B: [14C]RSA in PAN (5530 dpm loaded) versus [14C]RSA in control (4600 dpm loaded). C: [3H]transferrin in PAN (206,820 dpm loaded) versus [3H]transferrin in control (124,830 dpm loaded). D: [3H]IgG in anti-GBM (190,260 dpm loaded) versus [3H]IgG in control (97,540 dpm loaded). E: [14C]RSA in anti-GBM (6640 dpm loaded) versus [14C]RSA in control (4600 dpm loaded). F: [3H]transferrin in anti-GBM (396,230 dpm loaded) versus [3H]transferrin in control (124,830 dpm loaded).
Table 3.
The Percentage of Excreted Radiolabeled Protein Appearing in the Urine as Macromolecular Protein or as Degradation Products on Day 7 of the Osmotic Pump Infusion as Determined using Sephadex G-100 Size Exclusion Chromatography
| % Macromolecular protein | % Degradation products | |
|---|---|---|
| Controls | ||
| Immunoglobulin G (n = 7) | 1.8 ± 0.5 | 98.2 ± 0.5 |
| Transferrin (n = 7) | 1.9 ± 0.5 | 98.1 ± 0.6 |
| Albumin (n = 14) | 2.3 ± 1.6 | 97.7 ± 1.5 |
| Anti-GBM | ||
| Immunoglobulin G (n = 7) | 53.2 ± 13.6† | 46.8 ± 13.6† |
| Transferrin (n = 7) | 66.6 ± 5.7† | 33.4 ± 5.7† |
| Albumin (n = 14) | 90.0 ± 4.2† | 10.0 ± 4.2† |
| PAN | ||
| Immunoglobulin G (n = 7) | 52.4 ± 4.1† | 47.6 ± 4.1† |
| Transferrin (n = 7) | 47.1 ± 5.6† | 52.9 ± 5.6† |
| Albumin (n = 14) | 88.1 ± 5.8† | 11.9 ± 5.8† |
Macromolecular material was taken as material eluting at or near the void volume of the column whereas degraded material was taken as material eluting 0.5>Kav<1.0 for albumin and transferrin and 0.23>Kav<1.0 for IgG. The relative proportions of macromolecular to degraded material was determined by the areas under the chromatographic profiles. n is the number of rats used for the infusion of labeled protein by osmotic pumps. Studies were performed using pairs of proteins, either [3H]IgG and [14C]albumin or [3H]transferrin and [14C]albumin.
†, P < 0.001 versus controls.
With the induction of both PAN and anti-GBM GN the percentage of macromolecular-radiolabeled protein being excreted increases significantly, particularly for albumin, with the percentage of macromolecular albumin being excreted increasing from ∼2% to nearly 90% of the total albumin excreted (Figure 3) ▶ .
The FCs of the IgG, transferrin, and albumin were determined using both radiolabeled proteins and the RIA (Table 4) ▶ . By radioactivity the FC of the IgG, transferrin, and albumin in the controls were, respectively, 220 times, 420 times, and 380 times greater than the FC determined by the RIA. Anti-GBM GN and PAN both result in a significant increase in FC of all three proteins as determined by both RIA and radioactivity. The large increase in FC by RIA with anti-GBM GN and PAN reflect the large shift to macromolecular protein excretion caused by the diseases (Table 3) ▶ .
Table 4.
Fractional Clearances of IgG, Transferrin, and Albumin in Anti-GBM, PAN, and Age-Matched Control Rats as Measured by Both RIA and Radioactivity on Day 7 of the Osmotic Pump Infusion
| Radioimmunoassay/10−3 | Radioactivity/10−3 | |
|---|---|---|
| Controls | ||
| Immunoglobulin G (n = 7) | 0.0134 ± 0.00812 | 3.06 ± 0.49‡ |
| Transferrin (n = 7) | 0.00623 ± 0.00414 | 2.63 ± 0.25‡ |
| Albumin (n = 14) | 0.00435 ± 0.00266 | 1.67 ± 0.43‡ |
| Anti-GBM | ||
| Immunoglobulin G (n = 7) | 4.86 ± 2.04† | 7.00 ± 2.08†‡ |
| Transferrin (n = 7) | 7.70 ± 2.10† | 12.60 ± 1.62†‡ |
| Albumin (n = 14) | 28.90 ± 13.50† | 22.50 ± 5.40† |
| PAN | ||
| Immunoglobulin G (n = 7) | 9.72 ± 2.06† | 14.00 ± 2.45†‡ |
| Transferrin (n = 7) | 7.00 ± 4.53† | 12.20 ± 3.31†‡ |
| Albumin (n = 14) | 19.80 ± 6.88† | 20.20 ± 5.13† |
FC = [urine] × UFR/[plasma] × GFR where [urine] and [plasma] are the concentration of material in urine and plasma, respectively. n is the number of rats used for the infusion of labeled protein by osmotic pumps. Studies were performed using pairs of proteins, either [3H]IgG and [14C]albumin or [3H]transferrin and [14C]albumin.
†, P < 0.001 controls versus disease; ‡, P < 0.001 RIA versus radioactivity.
When the fractions eluted from a Sephadex G-100 column run of day 7 urine from an anti-GBM GN rat were analyzed for [3H]IgG or [3H]transferrin and assayed by RIA for the same proteins it was found that only the macromolecular peak was detected by the RIA with no evidence of any low-molecular weight material despite the presence of radiolabeled fragments (Figure 4) ▶ . This suggests that the RIA is specific for macromolecular transferrin and IgG and does not detect small fragments of these proteins; a similar phenomenon was found for albumin (see the Introduction).
Figure 4.

Representative profiles of the size exclusion chromatography on Sephadex G-100 of IgG (114,180 dpm loaded) (A) and transferrin (170,360 dpm loaded) (B) in urine samples from anti-GBM rats as detected by RIA (filled square) and radioactivity (open circle).
The excretion rates of IgG, transferrin, and albumin were determined by radioactivity and RIA, with the controls displaying a significant difference between the two methods (Table 5) ▶ . With the induction of PAN and anti-GBM GN the excretion rates of the three proteins as determined by RIA increased significantly from the controls, whereas by radioactivity, only albumin and PAN IgG increased significantly. The difference in the excretion rates as determined by the two methods, loses significance for albumin with disease because fragmentation is inhibited. Total protein excretion as determined by the bicinchoninic acid assay gave values for the control of 79.4 ± 13.3 μg/min (n = 7), for PAN as 327.5 ± 104.3 μg/min (n = 7), and for anti GBM GN as 454.6 ± 131.9 μg/min (n = 7). These values are comparable with albumin excretion rates determined by radioactivity. It is assumed that total protein estimates will only be semiquantitative, particularly for controls, because of variability of chromogen formation with low molecular peptides. 14,15
Table 5.
Excretion Rates of IgG, Transferrin, and Albumin in Anti-GBM, PAN, and Age-Matched Control Rats as Measured by both RIA and Radioactivity on Day 7 of the Osmotic Pump Infusion
| Radioimmunoassay (μg/min) | Total radioactivity (μg/min) | Fragment (μg/min) | |
|---|---|---|---|
| Controls | |||
| Immunoglobulin G (n = 7) | 0.016 ± 0.006 | 4.48 ± 2.76‡ | 4.46 ± 2.75 |
| Transferrin (n = 7) | 0.036 ± 0.051 | 18.34 ± 2.92‡ | 18.30 ± 2.87 |
| Albumin (n = 14) | 0.24 ± 0.12 | 92.28 ± 21.30‡ | 92.04 ± 21.18 |
| Anti-GBM | |||
| Immunoglobulin G (n = 7) | 3.36 ± 1.28† | 5.25 ± 2.54‡ | 1.89 ± 1.26* |
| Transferrin (n = 7) | 15.03 ± 3.66† | 20.44 ± 10.91‡ | 5.41 ± 7.25† |
| Albumin (n = 14) | 319.78 ± 48.09† | 314.27 ± 173.46† | 0.00 ± 0.00† |
| PAN | |||
| Immunoglobulin G (n = 7) | 3.41 ± 0.94† | 9.91 ± 3.69†‡ | 6.50 ± 2.75 |
| Transferrin (n = 7) | 9.46 ± 1.52† | 19.58 ± 10.49‡ | 10.12 ± 8.97* |
| Albumin (n = 14) | 298.57 ± 49.62† | 318.79 ± 165.99† | 20.22 ± 119.37* |
Fragment (or degradation product) excretion rate was determined by the difference between excretion rates determined by radioactivity and by RIA. Excretion rates from radioactivity have been calculated from the specific activity of the protein in plasma. n is the number of rats used for the infusion of labeled protein by osmotic pumps. Studies were performed using pairs of proteins, either [3H]IgG and [14C]albumin or [3H]transferrin and [14C]albumin.
†, P < 0.001; *, P < 0.05 controls versus disease; ‡, P < 0.001 RIA versus radioactivity.
Table 6 ▶ shows the increase with disease of the FC and excretion rate of the three proteins by RIA and radioactivity. Although the increase by RIA is in the range of 200 to 6600 times, the increases by radioactivity are between 2 to 14 times.
Table 6.
The Multiple Increase in FC and Excretion Rate of Albumin, IgG, and Transferrin as Determined by RIA and Radioactivity in PAN and Anti-GBM as Compared to Controls on Day 7 of the Osmotic Pump Infusion
| Radioimmunoassay | Radioactivity | |||
|---|---|---|---|---|
| Fractional clearance | Excretion rate | Fractional clearance | Excretion rate | |
| Anti-GBM | ||||
| Immunoglobulin G (n = 7) | 363 | 210 | 2.29 | N/S |
| Transferrin (n = 7) | 1236 | 417 | 4.79 | N/S |
| Albumin (n = 14) | 6644 | 1332 | 13.47 | 3.41 |
| PAN | ||||
| Immunoglobulin G (n = 7) | 725 | 213 | 4.58 | 2.21 |
| Transferrin (n = 7) | 1124 | 263 | 4.64 | N/S |
| Albumin (n = 14) | 4552 | 1244 | 12.10 | 3.45 |
n is the number of rats used for the infusion of labeled protein by osmotic pumps. Studies were performed using pairs of proteins, either [3H]IgG and [14C]albumin or [3H]transferrin and [14C]albumin. N/S = not significant.
Charge Selectivity Exhibited by Negatively Charged Ficoll
Experiments to test charge selectivity of Ficoll corresponding to radius of 36Å gave similar values for both Ficoll 70 and carboxymethyl Ficoll (Figure 5) ▶ . Ion exchange chromatographic analysis of the carboxymethyl Ficoll in the urine demonstrated that the charged Ficoll retained all its charged groups (not shown). The value obtained for Ficoll 70 (radius 36Å) with these short-term experiments is also similar to that obtained for Ficoll 70 (36Å) as studied by the osmotic pump method (Figure 6) ▶ to be discussed in more detail below. These results demonstrate that charge selectivity is negligible and that the FC of Ficoll is considerably higher than that measured for albumin by RIA or radioactivity as studied in control rats (Figure 5) ▶ .
Figure 5.

FC of albumin as measured by RIA and radioactivity (from Table 4 ▶ ) as compared to the FC of Ficoll (radius 36Å) (n = 5) and 36Å carboxymethyl Ficoll (n = 6). n, Number of rats used in the study.
Figure 6.
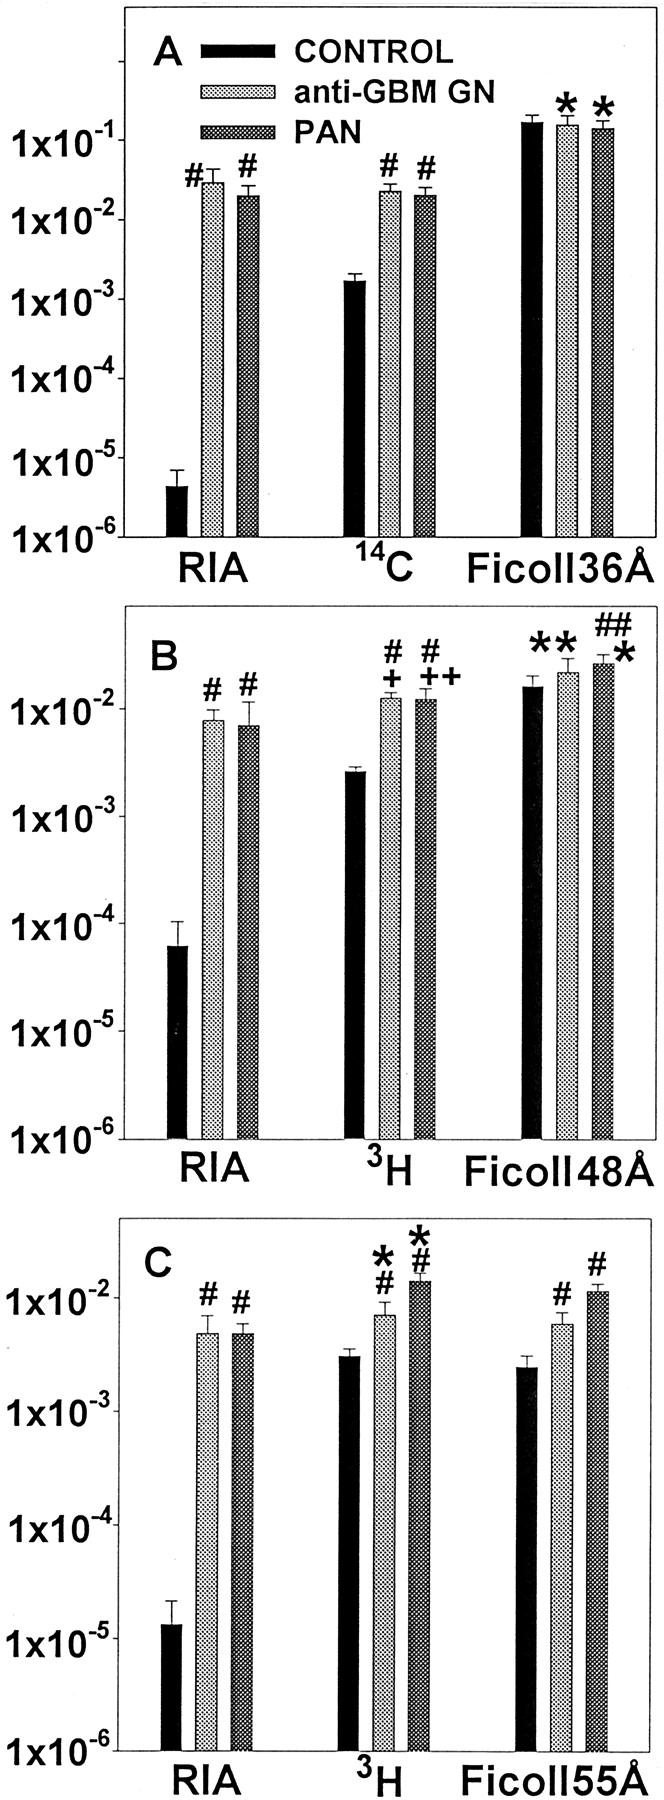
FC of albumin (A), transferrin (B), and IgG (C) from control, PAN, and anti-GBM GN rats as measured by RIA and radioactivity as compared with the FC of [3H]Ficoll with a radius of 36Å, 48Å, and 55Å, respectively. #, P < 0.001; ##, P < 0.01 disease versus control. +, P < 0.001; ++, P < 0.05 disease FC by radioactivity versus disease FC by RIA. *, P < 0.001; **, P < 0.01 disease FC by radioactivity versus disease FC of Ficoll of the same radii. For [3H] Ficoll, n = 6 for control, n = 6 for anti-GBM GN, and n = 7 for PAN.
Comparison of Ficoll and Protein Clearance
To determine whether the FC increases of the proteins were the result of size-selective changes in the GCW, polydisperse [3H]Ficoll 70 was introduced into the circulation of control, PAN, and anti-GBM GN rats using osmotic pumps and the FC of 36Å, 48Å, and 55Å Ficoll was determined (because these radii correspond with the radii of albumin, transferrin, and IgG, respectively) using size exclusion analysis on Sephacryl S-300. Figure 6 ▶ illustrates the changes in the FC of albumin, transferrin, and IgG (in order) as determined by RIA and radioactivity and the FC of the relevant-sized [3H]Ficoll in both controls, PAN, and anti-GBM GN. It can be seen that whereas there was an increase in the FC of albumin by RIA and radioactivity in PAN and anti-GBM GN, there was no corresponding increase in the FC of the 36Å Ficoll in the disease states. For the IgG, an increase in FC was observed by both RIA and radioactivity with the diseases. For both PAN and anti-GBM GN a change in the FC of the 55Å Ficoll was observed, with this change being not significantly different from the change observed for IgG using radioactivity. For transferrin, an increase in FC was observed by RIA and radioactivity. The FC of the 48Å Ficoll was greater than either the control or the disease radioactivity results, indicating that like the case of albumin, something other than the GCW is influencing transferrin’s passage through the kidney.
Discussion
The appearance of proteins in the urine is widely considered to be the result of their filtration at the GCW and endocytosis by proximal tubules. Contraluminal uptake of proteins leading to a potential alternative route by which proteins could appear in urine has been demonstrated to be negligible. 29 The internalization of filtered protein, such as 125I-labeled albumin, by the apical side of the proximal tubular cell and then transport to the lysosomes has been shown by autoradiography. 30 The fact that protein fragments resulting from exocytosis of lysosomal degradation was not recognized until recently is not surprising as microscopical techniques may not detect such rapid cellular processing of peptide fragments. Further, many urinary protein assays do not detect the fragments. 14-15 This is particularly the case for RIA and other immunologically based techniques that are the most commonly used for the detection of albumin, IgG, and other proteins in the urine. Recent studies have clearly demonstrated that the RIA is specific for intact/macromolecular albumin and this work has shown (Figure 4) ▶ that the RIA only detects macromolecular IgG and transferrin. 11,13 As the RIA fails to detect the protein fragments that are excreted, its use results in a severe underestimation of the FC of proteins. It is apparent that normal functioning of the kidney entails almost complete degradation of filtered protein before excretion.
All efforts to demonstrate that some or all of the fragments may possibly have been derived from extra-renal sources have proved negative. Studies presented in Figures 1 and 2 ▶ ▶ demonstrate that no fragments were apparent in the plasma at any time during the course of the study nor was there any significant uptake and resynthesis of radiolabeled material by extra-renal tissues. The method used to detect fragments using radiolabeled material and chromatography represents an extremely sensitive method to detect fragments. We have previously demonstrated that production of extra-renal-labeled fragments is negligible 10 during the simultaneous appearance of the fragments in urine. The studies of rats with nonfiltering kidneys conclusively demonstrated that fragments in urine are the result of renal-mediated degradation and not from degradation associated with extra-renal sources.
The results in Tables 3 and 5 ▶ ▶ are also an important confirmation that in severe proteinuric states the RIA analysis for macromolecular protein is similar to that from radioactivity/chromatography. For control albumin excretion the RIA would predict 0.26% macromolecular material whereas the amount measured was 2.3% (Table 3) ▶ , which reflects the presence of immuno-unreactive material being excreted as established previously. 31 In disease states, however, in which there are relatively low quantities of immuno-unreactive material but comparable quantities of macromolecular material and fragments, particularly for IgG and transferrin, the radioactivity/chromatography method for estimating macromolecular protein excretion rate is in good agreement with that measured by RIA. For example, for IgG in anti-GBM GN the RIA would predict the percentage of macromolecular material to be 64% (Table 5) ▶ where a value of 53.2 ± 13.6% was obtained from chromatography (Table 3) ▶ . The excretion rate of IgG fragments was significant in disease at 1.89 μg/min (as compared to the control value of 4.46 μg/min). Similarly, for albumin in PAN the excretion of RIA-sensitive macromolecular material was 93.7% of the total material excreted as determined by radioactivity (Table 5) ▶ that compares favorably with the 88.1 ± 5.8% as determined by chromatography (Table 3) ▶ . The fragment excretion rate in disease was 20.22 μg/min (as compared to control of 92.04 μg/min). It is clear that the RIA provides a more accurate value of the excretion of filtered protein in proteinuric states in which the fragmentation process has been inhibited as compared to the control.
The massive increases in the FC of all proteins as measured by conventional RIA with PAN and anti-GBM are now recognized to be in large part because of the decrease in the lysosomal degradation process. This could explain similar data in which the large increases in albumin FC in disease were found as compared to changes in dextran clearance. 3-7 Previously, these results have been interpreted as the result of changes in the permeability of the GCW possibly involving the development of large pores and the loss of the charge selectivity. This increase in the FC of the proteins cannot be explained by a decrease in charge selectivity as we demonstrate in this study that there is no charge selectivity between charged Ficoll and uncharged Ficoll. This result can be understood relative to previous studies of charge selectivity in which the charged transport probe used has subsequently been shown to be biochemically altered during filtration and renal passage and that this will have a profound effect on clearance measurements; before excretion dextran sulfate is desulfated 32 and charged proteins are degraded to peptides. 8,9,33 The lack of charge selectivity confirms previous studies showing that the GBM 34 and the GCW 8,9,32,33,35,36 do not exhibit any charge selectivity and that transglomerular passage is determined solely by size selectivity. Albumin interaction with charged polysaccharides and nonrenal extracellular matrix tissues has also been demonstrated to be independent of charge effects. 37-38 The lack of change in glomerular permselectivity for molecules such as albumin would also eliminate the possibility that an increase in the ratio of macromolecular form to fragment form was the result of saturation of the degradation pathway.
To further elucidate possible changes in size selectivity at the GCW and the role of large pores, polydisperse [3H]Ficoll 70 was studied in vivo and within this polydisperse population the FC of Ficoll with radii 36Å, 48Å, and 55Å Ficoll was specifically examined in controls, PAN, and anti-GBM. Ficoll is a spherical polysucrose, which is filtered according to the size-selective properties of the GCW and is not actively reabsorbed or secreted by the tubules. Ficoll is commonly used to study the sieving properties of the GCW and is becoming the molecule of choice over dextrans as they are a better representation of globular proteins. Our results demonstrate that whereas the FC of albumin by radioactivity increased significantly with PAN and anti-GBM (>0.02 FC units), there was no significant change detected in the FC of the 36Å Ficoll (∼0.1) (Figure 6) ▶ . If glomerular permeability was alone responsible for the increase in albumin clearance (given all post-GBM cellular processing is the same) then an increase in the FC of Ficoll of at least 20% would have been expected but this was not observed; the trend was that it decreased in disease states. The large pores associated with the transport of larger molecules such as Ficoll radius 55Å generated increases in FC in disease of 0.004 to 0.011 units. These increases were not enough to significantly alter the clearance of Ficoll radius 36Å. Ultimately, the FC of Ficoll 36Å is a balance of clearance through these larger pores and smaller radius pores. Similar experimental findings have been consistently made previously in which the FC of dextran of radius 36Å or Ficoll 36Å has been demonstrated to be the same or even less in diseased states as compared to the control 3-7,39 even when large pores have been observed to develop. These results demonstrate that changes in glomerular permselectivity to albumin are not responsible for the changes in excretion of albumin.
The results obtained for IgG support the concept that large pores may develop in the GCW in disease. In control rats the FC of [3H]IgG is not significantly different to that of Ficoll with the same radius. This provides further evidence that this protein is filtered intact and that the degradation occurs distal to the GBM. Tubular re-absorption is not a significant factor as the amount of [3H]IgG found in the kidney reaches a relatively low steady-state level at 7 days (Table 2) ▶ . In disease in which there is a small but significant increase in the FC of the 55Å Ficoll (Figure 6) ▶ there is a corresponding increase in the FC of IgG as determined by radioactivity data. Again there is no accumulation of the labeled material in the kidney (Table 2) ▶ and the amount present is not significantly different to that in the control kidney. This shows that the increase in FC of the IgG by radioactivity in PAN and anti-GBM is probably the result of small size selectivity changes at the GCW yet these large pores do not change the FC of albumin-like Ficoll (irrespective that this Ficoll can be transported through these large pores). The large increases in FC by RIA in these diseases for IgG will be the result of an inhibition in the fragmentation process, which is increasing the excretion of RIA detectable intact IgG.
A further issue related to glomerular structural changes and permeability is one of heterogeneity of glomerular permeability in disease. 40 The conclusion from the studies of Yoshioka and colleagues, 40 that a direct relationship exists between structural abnormalities and permeability function, was not seen. The increase in the FC seen only for dextrans >36Å was because of hyperfiltering glomeruli that lacked discernable damage. They found no significant change for dextran radius 36Å. These permeability results are consistent with the present studies in vivo in which there was no change in Ficoll 36Å or any change in glomerular filtration rate in disease states. The increase in large pores observed with Ficoll 55Å are consistent with glomerular heterogeneity. The relevant parameter is the fact that at least for anti-GBM GN there was no significant change in glomerular filtration rate as compared to the control. Therefore, although heterogeneity cannot be eliminated it is unlikely to be a major factor to account for albumin clearance.
The passage of transferrin through the kidney appears more like albumin than IgG. Unlike IgG the FC of transferrin by radioactivity with the diseases does not follow that of the 48Å Ficoll. Rather we see the control value of transferrin being ∼6 times lower than that of the corresponding Ficoll, and even with PAN and anti-GBM the FC of transferrin never exceeds the FC of the control Ficoll. The changes in 48Å Ficoll FC in control and disease are not significant. This indicates that something other than GCW permeability is influencing the passage of transferrin.
In the case of albumin, it is not necessary for large pores to develop in the GCW for an increase in the FC by radioactivity to occur. A partial inhibition of the retrieval pathway in disease would result in an increased flux of intact albumin, from the glomerular epithelial or tubular epithelial cells where the retrieval pathway may operate to the degradation pathway before excretion in urine. Such an occurrence would result in an increase in FC and excretion rate by both RIA and radioactivity. Although a retrieval pathway has so far been demonstrated for albumin, the possibility exists that similar, if less efficient, retrieval mechanisms may occur to retrieve other highly filtered proteins such as transferrin. With little or no change in the GCW affecting the 48Å Ficoll the much greater change in the FC of transferrin by radioactivity could be attributed to the inhibition of a second retrieval mechanism. Further studies are required to understand the effects of these proteinuric states on the renal handling of proteins and Ficoll of lower molecular weight and size to albumin.
Footnotes
Address reprint requests to Dr. Wayne D. Comper, Department of Biochemistry and Molecular Biology, Monash University, Wellington Rd., Clayton Victoria, Australia 3800. E-mail: wayne.comper@med.
Dedicated to Prof. Eric Glasgow, a valued friend and highly respected colleague who passed away after a short illness on January 3, 2001. Eric was instrumental in laying the ground work for this study a number of years ago.
Supported by a postdoctoral fellowship from CAPES/Brazil (to M. A. M. G.).
References
- 1.Houser MT, Berson LS: Renal tubular protein handling in experimental renal disease. Nephron 1991, 58:461-465 [DOI] [PubMed] [Google Scholar]
- 2.Galaske RG, Baldamus CA, Stolte H: Plasma protein handling in the rat kidney: micropuncture experiments in the acute heterologous phase of anti-GBM nephritis. Pflügers Arch 1978, 375:269-277 [DOI] [PubMed] [Google Scholar]
- 3.Olsen JL, Rennke HG, Venkatachalam MA: Alterations in the charge and size selectivity barrier of the glomerular filter in aminonucleoside nephrosis in rats. Lab Invest 1981, 3:271-279 [PubMed] [Google Scholar]
- 4.Alfino PA, Neugarten J, Schacht RG, Dworkin LD, Baldwin DS: Glomerular size-selective barrier of dysfunction in nephrotoxic serum nephritis. Kidney Int 1988, 34:151-155 [DOI] [PubMed] [Google Scholar]
- 5.Deckert T, Feldt-Rasmussen B, Djurup R, Deckert M: Glomerular size and charge selectivity in insulin-dependant diabetes mellitus. Kidney Int 1988, 33:100-106 [DOI] [PubMed] [Google Scholar]
- 6.Myers BD, Winetz F, Chui F, Michaels AS: Mechanisms of proteinuria in diabetic nephropathy: a study of glomerular barrier function. Kidney Int 1982, 21:633-641 [DOI] [PubMed] [Google Scholar]
- 7.Remuzzi A, Battaglia C, Rossi L, Zoja C, Remuzzi G: Glomerular size selectivity in nephrotic rats exposed to diets with different protein content. Am J Physiol 1987, 253:F318-F327 [DOI] [PubMed] [Google Scholar]
- 8.Osicka TM, Comper WD: Glomerular charge selectivity for anionic and neutral horseradish peroxidase. Kidney Int 1995, 47:1630-1637 [DOI] [PubMed] [Google Scholar]
- 9.Osicka TM, Pratt LM, Comper WD: Glomerular capillary wall permeability to albumin and horseradish peroxidase. Nephrology 1996, 2:199-212 [Google Scholar]
- 10.Osicka TM, Comper WD: Protein degradation during renal passage in normal kidneys is inhibited in experimental albuminuria. Clin Sci 1997, 93:65-72 [DOI] [PubMed] [Google Scholar]
- 11.Osicka TM, Panagiotopoulos S, Jerums G, Comper WD: Fractional clearance of albumin is influenced by its degradation during renal passage. Clin Sci 1997, 93:557-564 [DOI] [PubMed] [Google Scholar]
- 12.Burne MJ, Osicka TM, Comper WD: Fractional clearance of high molecular weight proteins on conscious rats using a continuous infusion method. Kidney Int 1999, 55:261-270 [DOI] [PubMed] [Google Scholar]
- 13.Osicka TM, Houlihan CA, Chan JG, Jerums G, Comper WD: Albuminuria in patients with type 1 diabetes is directly linked to changes in the lysosome-mediated degradation of albumin during renal passage. Diabetes 2000, 49:1579-1584 [DOI] [PubMed] [Google Scholar]
- 14.Greive KA, Balazs NDH, Comper WD: Protein fragments have been considerably underestimated by various protein assays. Clin Chem (in press) [PubMed]
- 15.Eppel GA, Nagy S, Jenkins MA, Tudball RN, Daskalakis M, Balazs NDH, Comper WD: Variability of standard clinical protein assays in the analysis of a model urine solution of fragmented albumin. Clin Biochem 2000, 33:487-494 [DOI] [PubMed] [Google Scholar]
- 16.Eppel GA, Osicka TM, Pratt LM, Jablonski P, Howden BO, Glasgow EF, Comper WD: The return of glomerular-filtered albumin to the rat renal vein. Kidney Int 1999, 55:1861-1870 [DOI] [PubMed] [Google Scholar]
- 17.Osicka TM, Hankin AR, Comper WD: Puromycin aminonucleoside nephrosis results in a marked increase in fractional clearance of albumin. Am J Physiol 1999, 277:F139-F145 [DOI] [PubMed] [Google Scholar]
- 18.Diamond JR, Bonventre JV, Karnovsky MJ: A role for oxygen free radicals in aminonucleoside nephrosis. Kidney Int 1986, 29:478-483 [DOI] [PubMed] [Google Scholar]
- 19.Whiteside CI, Cameron R, Munk S, Levy J: Podocytic cytoskeletal disaggregation and basement-membrane detachment in puromycin aminonucleoside nephrosis. Am J Pathol 1993, 142:1641-1653 [PMC free article] [PubMed] [Google Scholar]
- 20.Schwartz MM, Sharon Z, Pauli BU, Lewis EJ: Inhibition of glomerular visceral epithelial cell endocytosis during nephrosis induced by puromycin aminonucleoside. Lab Invest 1984, 51:690-696 [PubMed] [Google Scholar]
- 21.Lan HY, Paterson DJ, Atkins RC: Initiation and evolution of interstitial leukocytic infiltration in experimental glomerulonephritis. Kidney Int 1991, 40:425-433 [DOI] [PubMed] [Google Scholar]
- 22.Atkins RC, Nikolic-Paterson DJ, Song Q, Lan HY: Modulators of crescentic glomerulonephritis. J Am Soc Nephrol 1996, 7:2271-2278 [DOI] [PubMed] [Google Scholar]
- 23.Tack BF, Dean J, Eilat D, Lorenz PE, Schecter AN: Tritium labeling of protein to high specific radioactivity by reductive methylation. J Biol Chem 1980, 225:8842-8847 [PubMed] [Google Scholar]
- 24.Van Damme M-P, Comper WD, Preston BN: Experimental measurements of polymer unidirectional fluxes in polymer + solvent systems with non-zero chemical potential gradients. J Chem Soc Faraday Trans I 1982, 78:3357-3367 [Google Scholar]
- 25.Eng LA: Production and characterization of [14C]protein A, a long lived immunological reagent. J Immunol Methods 1985, 81:239-243 [DOI] [PubMed] [Google Scholar]
- 26.Di Giorgio J: Non protein nitrogenous constituent. Henry R Canon D Winkelman J eds. Clinical Chemistry Principles and Techniques. 1974, :pp 503-563 Maryland, Harper and Row Publishers, Hagerstown [Google Scholar]
- 27.Greenwood FC, Hunter WM, Glover JS: The preparation of 131I-labeled human growth hormone of high specific radioactivity. Biochem J 1963, 89:114-123 [DOI] [PMC free article] [PubMed] [Google Scholar]
- 28.Fox S: Application of Triton X-100 colloid scintillation counting in biochemistry. Int J Radiat Isot 1968, 19:717-730 [DOI] [PubMed] [Google Scholar]
- 29.Bourdeau JE, Carone FA: Protein handling by the renal tubule. Nephron 1974, 13:22-34 [DOI] [PubMed] [Google Scholar]
- 30.Maunsbach AB: Absorption of I125-labeled homologous albumin by rat kidney proximal tubule cells. A study of microperfused single proximal tubules by electron microscopic autoradiography and histochemistry. J Ultrastruct Res 1966, 15:197-241 [DOI] [PubMed] [Google Scholar]
- 31.Greive KA, Eppel GA, Reeve S, Smith AI, Jerums G, Comper WD: Immuno-unreactive albumin has enhanced excretion in STZ diabetic rats. Am J Kidney Dis 2001, 38:144-152 [DOI] [PubMed] [Google Scholar]
- 32.Vyas SV, Burne MJ, Pratt LM, Comper WD: Glomerular processing of dextran sulfate during transcapillary transport. Arch Biophys Biochem 1996, 332:205-212 [DOI] [PubMed] [Google Scholar]
- 33.Osicka TM, Comper WD: Tubular inhibition destroys charge selectivity for anionic and neutral horseradish peroxidase. Biochim Biophys Acta 1998, 1381:170-178 [DOI] [PubMed] [Google Scholar]
- 34.Bolton GR, Deen WM, Daniels BS: Assessment of charge-selectivity of glomerular basement membrane using Ficoll sulfate. Am J Physiol 1998, 274:F889-F896 [DOI] [PubMed] [Google Scholar]
- 35.Comper WD, Glasgow EF: Charge selectivity in kidney ultrafiltration. Kidney Int 1995, 47:1242-1251 [DOI] [PubMed] [Google Scholar]
- 36.Guimarães MAM, Pratt LM, Comper WD: In vivo fractional clearance of carboxymethyl cellulose reveals negligible charge selectivity offered by the glomerular capillary wall. J Am Soc Nephrol 2000, 11:360A [Google Scholar]
- 37.Ogston AG, Preston BN: The exclusion of protein by hyaluronic acid. J Biol Chem 1966, 241:17-19 [PubMed] [Google Scholar]
- 38.Shaw M, Schy A: Exclusion in hyaluronate gels. Biophys J 1977, 17:47-55 [DOI] [PMC free article] [PubMed] [Google Scholar]
- 39.Blouch K, Deen WM, Fauvel J-P, Bialek J, Derby G, Myers BD: Molecular configuration and glomerular size selectivity in healthy and nephrotic humans. Am J Physiol 1997, 273:F430-F437 [DOI] [PubMed] [Google Scholar]
- 40.Yoshioka T, Shiraga H, Yoshida Y, Fogo A, Glick AD, Deen WM, Hoyer JR, Ichikawa I: “Intact nephrons” as the primary origin of proteinuria in chronic renal disease. J Clin Invest 1988, 82:1614-1623 [DOI] [PMC free article] [PubMed] [Google Scholar]