

Abstract
With the completion of the Human Genome Project and high-throughput screening methods using cDNA array and tissue microarray (TMA) technology, there is a pressing need to manage the voluminous data sets generated from these types of investigations. Herein is described a database model to handle 1) clinical and pathology data, 2) TMA location information, and 3) web-based histology results. The model is useful for managing clinical, pathology, and molecular data on >1300 prostate cancer patients dating back to 1995 from the University of Michigan Specialized Program of Research Excellence for prostate cancer. The key components in this multidatabase model are 1) the TMA database, 2) the TMA-image database (TMA-I DB), and 3) the prostate pathology and clinical information databases. All databases were created in Microsoft Access (Microsoft, Redmond, WA). Desired patient, tissue, block, diagnosis, array location, and respective clinical and pathology information is obtained by linking the unique identifier fields among database tables. The TMA database is comprised of interrelated data from 336 prostate cancer patients transferred into 19 TMA blocks with 5451 TMA biopsy cores. Tissue samples include 1695 normal prostate, 3171 prostate cancer, 464 prostatic intraepithelial neoplasia, and 121 atrophy. All 19 TMA blocks have been analyzed over the Internet for several immunohistochemical biomarkers including E-cadherin, prostate-specific antigen, p27Kip1, and Ki-67 labeling index. This system facilitates the statistical analysis of high-density TMA data with clinical and pathology information in an efficient and cost-effective manner. Because the review is performed over the Internet, this system is ideal for collaborative multi-institutional studies.
With the Human Genome Project close to completion, investigators are seeking innovative ways to analyze the role of newly discovered genes as molecular markers that may be useful for prediction of disease presence, aggressiveness, and response to therapy. The introduction of high-throughput tissue microarray (TMA) technology by Kononen and colleagues 1 allows for rapid screening of protein or mRNA expression, or for analysis of chromosomal alterations by fluorescence in situ hybridization from a large number of tissue samples on a single microscope slide. This technology is poised to provide unprecedented capabilities for screening new and existing markers and for facilitating intra- and interinstitutional collaborations. In addition, TMAs help preserve precious tissue resources that in many academic centers are dwindling in supply because of heavy use by translational research projects.
TMA-based technology prompted the need for a system that effectively managed data generated from this high-throughput approach. For example, the typical prostate specimen of a single patient consists of up to 50 individual paraffin blocks (range, 12 to 50; median, 20) containing multiple foci of tumor in addition to benign prostate, prostatic intraepithelial neoplasia, and other potential tissue types (eg, stroma, atrophy, benign prostatic hyperplasia). The use of a large spreadsheet has been the standard solution to handle voluminous amounts of data. This approach is useful for experiments on a one-time basis. However, this approach has lead to the loss of an enormous amount of molecular data because of an inability to return data in a convenient manner back into the database. As part of on-going collaborations between the Specialized Programs in Research Excellence for prostate cancer, the three groups from the University of Michigan (Ann Arbor, MI), Johns Hopkins Hospital (Baltimore, MD), and Baylor College of Medicine (Houston, TX) sought a solution that would allow us to provide data to translational researchers and provide a mechanism to return data back to the database. This approach should ultimately lead to a rich database and prevent duplication of effort. Adequately detailed data sets as described above would contain a high degree of repetitive data in tabular format, requiring more time for manual data entry and the potential for data entry errors.
The use of a database composed of multiple interrelated tables minimizes the potential pitfalls that arise from using single large spreadsheets to record TMA data. The use of unique identifiers to link fields of data between multiple tables and databases is a central concept to the effectiveness of relational databases. Unique identifiers are values appearing only once within a given field in a single table of data, but may be replicated within another table serving as a link between the two data sets. We present a model that links all TMA-related data and corresponding image histology results with clinical and pathology information currently available at the University of Michigan on >1300 PCA patients. The key components are 1) the TMA database (TMA DB), 2) the TMA-image database TMA-I DB), and 3) the prostate pathology and clinical information databases.
Materials and Methods
Sample Acquisition and TMA Block Construction
The first step in a typical TMA study is the acquisition and preparation of relevant donor specimen blocks. Matching hematoxylin and eosin (H&E) reference slides are cut from all donor blocks, graded, and targeted tissue types of interest are circled in ink. These grading markers serve as a template for sampling discrete diagnosis from the donor block. Information such as patient number, specimen number, specimen block label, tissue, and targeted diagnosis are routinely recorded into our TMA DB at this point or after completion of the TMA block. Targeted TMA sample diagnosis refers to the presumed pathology diagnosis of tissue cores being transferred to the recipient TMA block. Because of tissue heterogeneity and potential sampling inaccuracies, these diagnoses are verified at a later time (confirmed TMA sample diagnosis).
TMAs are constructed using a manual tissue puncher/array (Beecher Instruments, Silver Spring, MD) as previously described (Figure 1) ▶ . 1 TMAs are typically constructed with 400 to 600 individual tissue samples of 0.6 mm diameter. Samples are arrayed in a recta-linear pattern with 0.8 mm between the centers of each sample. Once the TMA study block has been prepared, the block can be sectioned into 6 mm thick sections, counterstained with H&E for use as a reference slide to confirm histology, and treated with different immunoperoxidase stains.
Figure 1.
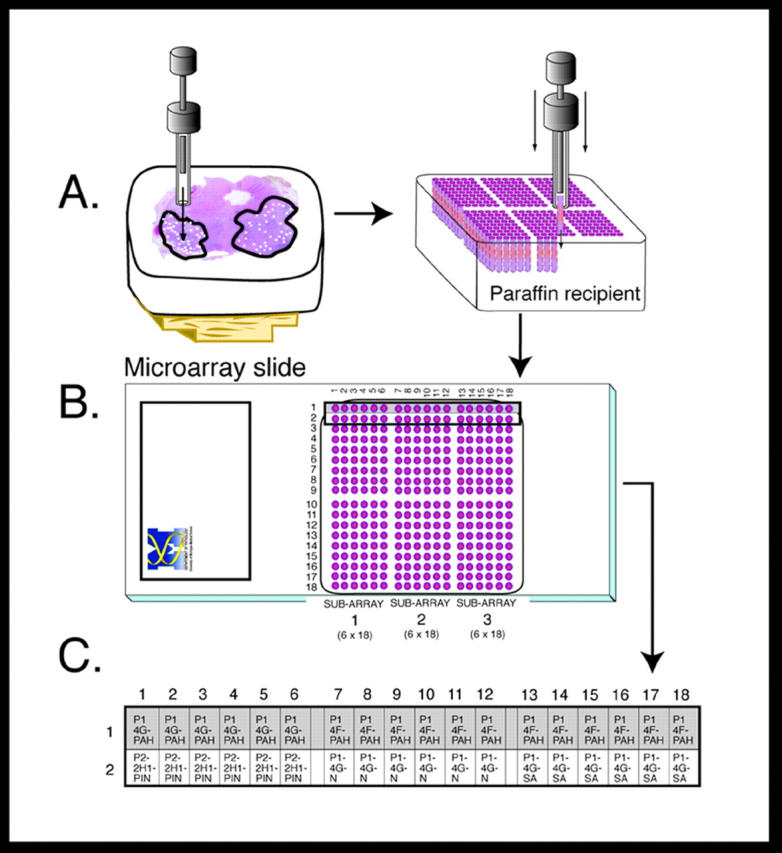
TMA construction and sample identity. A: Tissue construction showing transfer of sample cores from donor block to recipient block—TMA block 01. B: H&E-stained TMA slide of block TMA 01. C: Detail of specimen, diagnosis, and array location information associated with each sample for the first two rows.
TMA DBs
A relational TMA DB was created in Microsoft Access 2000 (Microsoft, Redmond, WA) to organize and link all levels of sample-related information and to allocate an array ID for each core in a given TMA block (Figure 2) ▶ . This type of database solution eliminates having to enter redundant information as one would in a single spreadsheet. The TMA DB is comprised of four main tables containing patient, block, diagnosis, and array location information linked to each other via unique autogenerated numbers (ie, primary keys) that are hidden beneath the user interface during data entry process (Table 1 ▶ , column 2). Although certain database fields are unique to prostate cancer-related research, this data structure could be adapted to include other tissue-specific data.
Figure 2.

Relationships between TMA database tables. TMA data resides in four main tables: 1) patient information, 2) block information, 3) diagnosis information, and 4) core location. These tables are linked to each other and clinical results and image (histology) assessments via unique identifiers (labeled 1 to 6).
Table 1.
Field Names of All Database Tables
| Clinical and pathology DB tables | TMA DB tables | TMA image DB table |
|---|---|---|
| Clinical and pathology | Patient | Histology results |
| Registration no. | Registration no. | TMA block name |
| Surgical specimen no. | Surgical specimen no. | Image stain |
| Surgery date | Unique patient ID no. | Image file name |
| Race | Unique array ID no. | |
| Age | Tissue | |
| Gland weight | Block | Confirmed tissue diagnosis |
| Digital rectal exam result | Unique patient ID no. | % Evaluation |
| Preoperative PSA result | Block | +/− Evaluation |
| Hormone treatment (yes/no) | Tissue | Score evaluation |
| Radiation treatment (yes/no) | Unique tissue ID no. | Stain pattern |
| PSA recurrence (yes/no) | Comment | |
| Multifocal tumor (yes/no) | Diagnosis | |
| Major Gleason grade | Unique tissue ID no. | |
| Minor Gleason grade | Targeted tissue diagnosis | |
| Gleason sum | Major Gleason grade | |
| Pathologic stage | Minor Gleason grade | |
| Lymph node stage | Gleason sum | |
| Unique Diagnosis ID no. | ||
| Array location | ||
| Unique diagnosis ID no. | ||
| TMA block name | ||
| X-coordinate | ||
| Y-coordinate | ||
| Unique array ID no. | ||
| Note |
To prevent duplicate entries of any patient and biopsy core location information on a given TMA block, duplicate entries of the surgical specimen number, registration number, and array IDs bring up an error message. In addition, the array ID is also automatically generated when the array and X and Y coordinates are entered as is the Gleason sum. These are examples of some of the precautions that were taken to eliminate possible data entry errors. Also, for ease of statistical analysis for a given TMA study, all field values are associated with numerical codes as opposed to text. With this relational database approach, all data can be easily accessed via query generation because of the commonality of the unique identifiers among the TMA DB tables.
All data entry is performed manually on a main form comprised of fields from three subforms. Specifically, the main form is based on a query that extracts data from the patient table. The three subforms originate from queries that extract designated data fields from the block, diagnosis, and array location tables, respectively. Basing the forms on sorted query tables instead of original data tables allows for more efficient data handling and speeds up searches. Using Microsoft Access 2000 as opposed to Microsoft Access 97 has the advantage of visually presenting hierarchically organized subnested data sets. This feature allows one to expand a single row of data in a datasheet and view all other related data. Before the single expandable datasheet was used, separate forms were used, making data entry less efficient. With a single form, all relevant patient, block, diagnosis, and array location information can be entered in one location, improving the efficiency of data entry. Microsoft Access 2000 also offers the data access page (DAP) feature that accommodates the visual assessment of stained TMA sample images through a web-based interface (described below).
TMA Sample Image Acquisition and Management
Digital images are acquired using the Bacus Labs Incorporated imaging system (BLISS; Bacus Labs. Inc., Lombard, IL). This system utilizes the matrix array scan segment with customizable features that were developed in collaboration with the Prostate SPORE Tissue Microarray Working Group (University of Michigan, Baylor College of Medicine, and Johns Hopkins University School of Medicine). This imaging system overlays a grid on each TMA slide for which the user can specify the slide size. The system automatically captures high-resolution composite images at the vertices of all grid lines that correspond to the location of TMA samples on the slide. The system permits the operator to reposition imaging targets for TMA samples out of alignment the regular grid pattern. The final composite images are comprised of six separate ×20 objective microscope fields stitched together to form a single image of ∼×100 final magnification. Images are saved in jpeg format and they are between 200 and 300 KB in size. The BLISS software automatically assigns a unique name to each image of each sample. This naming convention consists of numeric variable for lab ID, TMA block number, X position, Y position, treatment code (ie, H&E = 1), and sequential image number. Hence, the image name 390_01_05_06_1_105.jpeg comes from lab number 390, TMA block 01, positioned at x-coordinate 05 and y-coordinate 05, treated with H&E (numerical code 1), and that was the 105th composite image acquired from the array. A directory is created on a networked image file server that holds these jpeg images and would be named as follows: TMA01_treatment_date_operator initials.
Final composite images can be evaluated in any number with image review utility applications such as I-View MultiMedia (Crystal Bay, NV; www.scriptsoftware.com). Using this utility, a list of all composite image file names can be generated and used to link images to other data fields.
TMA-I DB and DAP
The TMA-I DB is used to capture all pathological visual assessments made from TMA sample images. This DB utilizes the latest Microsoft Access 2000 feature called a DAP. This component is essentially a database form prepared as an HTML document for publishing over the Internet. Each TMA image file name is given a URL extension that specifies the computer path to the image file location. This permits image viewing, entering, and editing data over the Internet. The DAP opens a live link to the TMA-I DB when accessed by an authorized user. It presents images and database fields over the Internet and permits the pathology expert to enter data into these fields that is automatically returned to the database on the home-server (Figure 3) ▶ .
Figure 3.

TMA DAP allows for the direct pathological assessment of TMA sample images and the return of this results in data to a central database over the Internet. On the left is a menu that allows one to select from image composite sets stained with multiple biomarkers. On the right are fields available for entry of histological assessment of a particular image. These fields include diagnosis, score value, stain pattern, and percent evaluation. Shown are representative sample images from TMA 01 stained with H&E (original effective magnification, ×100). This particular image set consists of 288 samples of which the first image is displayed.
The DAP uses the image file name to present the corresponding images for all treated samples within an array. The TMA DAP presents data that is based on a query that selectively pulls array number, treatment code, image file name, and array ID’s (generated from the file name list) into a single table in the TMA-I DB. These fields are given in column 3 of Table 1 ▶ . Because the TMA-I DB maintains live links to all four tables in the TMA DB, an update query can be run to fill in the corresponding tissue information in this table by linking the array ID fields. Images of individual TMA samples are presented on the computer screen, usually on a 19 to 21 inch monitor for optimal high resolution. Figure 3 ▶ shows TMA 01 stained with H&E.
Because the DAP is available on the Internet, two levels of security are in place to access the page. The first level of security involves Windows NT authentication where the user is prompted for a login name and password. The next level of security follows Access 2000 database-level security where the specified login name has distinct privileges for entering or reading data. For instance, a designated pathologist will have full data-entry rights whereas a co-worker may have read-only rights. For a detailed discussion on how to make a DAP secure and Internet ready, refer to DAP articles in the Microsoft Knowledge Base (article ID no. Q253754). Notably, all data presented on the World-Wide Web is anonymous. There is no information that can be traced back to patients.
Prostate Clinical and Pathology Database
Thus far it has been shown that the TMA DB and TMA-I DB can communicate with one another via linking of the array ID. Hence, for any given array ID, the patient, block, tissue, or diagnosis origin can easily be obtained by use of a simple query. In addition, the histology diagnosis information for a given array ID and stain is attainable. However, to do a worthwhile study, the clinical and pathology information needs to also be accessible for the patients in the TMA construct. The true value of the TMA DB lies in the ability to link clinical outcome to TMA data.
The Prostate Clinical and Pathology Microsoft Access 1997 Databases have existed since 1995 and contain clinical and pathology information on >1300 prostate cancer radical prostatectomy patients. These databases can obtain information from one another because of the commonality of the patient registration number in all their tables. Live links of all of the tables between the databases are maintained to allow for query extraction of desired information. Note that each database is maintained separately and it is the collaboration of the pathology and urology department that allows such sharing of information to be possible. There are plans to convert the Access 1997 databases into Access 2000 format in the near future.
Because we are only interested in specific information, additional fields were created in the radical prostatectomy table in the pathology database to download relevant clinical information from the clinical database. Examples include digital rectal examination results, preoperative prostate-specific antigen (PSA) results, hormone and radiation treatment, postsurgical PSA follow-up data, and race (column 1 of Table 1 ▶ ). This eliminates the need to create several queries every time such information is desired. More importantly, this allows direct access of both relevant clinical and pathology data for the TMA studies in a single step. The surgical specimen number entered in the patient table in the TMA DB can be linked to the surgical specimen number entered in the radical prostatectomy table. A full diagram showing the interaction between all of the databases is shown in Figure 2 ▶ . Note that neither surgical specimen number nor registration number are ever shown in the query results. They are used for linking purposes only. As a final step, the query results are given to a statistician for analysis.
Results
The model TMA map (TMA 01) in Figure 1B ▶ is an example of a medium-sized array made up of 324 biopsy cores from 11 prostate cancer patients. Only the first two rows of this TMA map will be used for subsequent explanation purposes. This row encompasses biopsy cores taken from two prostate tissue blocks (1D; 1F) of a single patient (P1). Each sample has been assigned a targeted tissue diagnosis (T = tumor, N = normal, PIN = prostatic intraepithelial neoplasia) and an array identification number to describe its location within the TMA. An X and Y coordinate system is used to identify samples within a TMA block such that an array ID (array number + x-coordinate + y-coordinate) is assigned to each biopsy core. A sample at position x = 1, y = 1would be located in the upper left. Hence, array ID’s 01-01-01 through 01-01-06 represent the first six cores assembled in the upper left hand corner of the TMA 01 block (Figure 1C) ▶ . The concept of the TMA sample identification code, or array ID, is key to being able to effectively track the identity of cores within a TMA and link relevant clinical data to final histological results.
There are 19 fields in the TMA DB (column 2 of Table 1 ▶ ). Prostate cancer patients (n = 336) are entered in the TMA DB, which translates to 19 TMA blocks with 5451 TMA biopsy cores. There are 1695 normal, 3171 tumor, 464 prostatic intraepithelial neoplasia, and 121 miscellaneous (eg, stroma, atrophy) cores.
The TMA-I DB contains 11 fields (column 3 of Table 1 ▶ ). All 19 TMA blocks have been analyzed with several molecular markers with E-CAD, MIB-1, and PSA. Image stain selection depends on the particulars of the study (Figure 4) ▶ .
Figure 4.

Examples of TMA-immunostained samples as seen using the DAP. A: Prostate cancer stained with the proliferation marker Ki-67 demonstrates nuclear staining. B: Benign prostate tissue stained with the cell-cycle inhibitor p27 demonstrates uniform nuclear staining. Data can be entered into the relational database by using the drop-down fields (see Figure 3 ▶ ).
The clinical DB contains 115 fields including family history, demographics, hormone or radiation treatment, PSA, digital rectal, PSA follow-up, and consent status information. The pathology DB contains 122 fields on needle biopsy and radical prostatectomy results. The most common fields from both databases are given in first column of Table 1 ▶ (Figure 4) ▶ .
Of the 1300 prostate cancer patients available for statistical analysis, 336 pertain to the TMA study sets. The mean age was 61.5 years; the mean pre-operative PSA level was 8.7 ng/ml; 60.7% had positive digital rectal examinations; 13.1% are African-American, 74.5% Caucasian, and 12.5% are of unknown ethnic background; 92.1% of these cases had a Gleason score of 6 or 7; and 73.4% had multifocal tumors. The majority of cases had organ-confined disease (pT2 56.4%). Nearly all (96.7%) cases had surgery as a monotherapy (eg, no hormone or radiation treatment). Of the 336 patients, 325 can be evaluated for PSA recurrence data after surgery with a median follow-up time of 3.7 years for all patients. Seventy-two of the 253 patients had a PSA elevation of >0.2 ng/ml (biochemical failure) after radical prostatectomy.
Discussion
This model data management system was developed using commercially available software packages and computer workstations. Once developed, training for usage of the database is reasonable for any laboratory personnel. Operation does not require any specific computer-programming knowledge. The database has tremendously increased the efficiency of the preparation of data for biostatistical analysis. This data infrastructure is adaptable to TMA-based studies in most any organ system. The majority of work performed with this system has been related to prostate cancer. However, this system has been used in breast cancer, sarcomas, and head and neck cancers.
A further benefit of this system is that the review of TMA sample images can be done on the World-Wide Web with adequate high-speed Internet access. With the increasing availability of bandwidth, this mode of pathology review is becoming increasingly more used. This web-based review feature frees the pathologist not only from the microscope, but also from a single computer workstation and permits the assessment of TMA images from any suitable terminal on the Internet. This is critical for performing multi-institutional studies. This system as described is being used to share and evaluate research data. This makes collaborations between laboratories in different buildings, cities, and countries practical. The only limitation to this has been the speed of Internet connections. In practice the rate of image transfer speed depends on the time of day. The quality of the images has recently been assessed in an intra- and interobserver study with the goal of Gleason grading PCA over the Internet. 2 The image quality was subjectively evaluated as excellent. We have also been evaluating immunostained tissues with a similar level of viewer satisfaction. 3-6
TMA data has been successfully used in combination cDNA expression array data in a high-throughput manner to help validate biomarkers. 7,8 We believe that linking cDNA to TMA data will be valuable. As the TMA data grows, queries could be performed based on cDNA expression results. For example, if a set of tumor cases cluster together discretely from other tumors, in addition to looking for similarities based on clinical or pathology results, one could also display TMA images to look for a similar phenotype. TMA samples that have no overlap with the ones used for cDNA analysis can also serve as a validation step for cDNA expression array findings. In recent work, we have used the TMA database to confirm cDNA expression array data (unpublished results). The same clustering algorithms used for cDNA microarray data can be used for TMA data.
We have also recently used this approach to validate putative biomarkers. 4,5 Using the described system we are able to perform outcome analysis, looking for associations between protein expression levels as determined by immunohistochemistry of TMAs and adverse pathological features (extraprostatic extension, positive surgical margins, Gleason pattern 4/5 PCA) or PSA recurrence. This powerful tool allows us to perform efficient translation outcomes studies that will facilitate the evaluation of multiple biomarkers while conserving tissue-using TMAs.
One concern regards the use of an Internet browser to review immunohistochemistry as opposed to performing standard light microscopy. Light microscopy is the gold standard allowing for the absolute best optical evaluation with the best detail. However, one draw back is the potential to make mistakes as to the sample location on the TMA. This is especially true when the pathologist reviewing the slide has limited familiarity with TMAs, which may be the case in a collaborative research setting. By evaluating a linked digital image, there is a built-in set of quality controls, which obviates the need to determine the x-y coordinates of a 0.6-mm diameter tissue sample among 400 to 600 samples. Another important byproduct of this system is that we have established a true databank. This structure facilitates the return of research data into the database. This will prevent duplication of studies on the same samples. It will also allow for computer-based experiments, where research questions can be asked by analyzing data from multiple studies. As the database becomes rich with experimental data, we will be able to search for associations that may not be apparent by examining data from individual studies. The use of digital images compromises image quality for flexibility in review and facility in data entry. However, we feel that the loss of resolution is minimal. As discussed above, the quality of the H&E images has recently been assessed in an intra- and interobserver study with the goal of Gleason grading prostate cancer over the Internet. 2 Our subjective assessment is that most immunostains can be evaluated over the Internet. Examples from two recent projects are presented in Figure 4 ▶ . Limitations to an Internet review would include monitor quality and Internet speed.
The eventual development of common data elements will facilitate the sharing or results between research groups and the expansion of results to evaluate. We would anticipate that working groups would come up with common naming conventions to facilitate the sharing of data. The National Cancer Institute has set up a commondata elements web-site tool to help with this type of work (http://ciiserver4.nci.nih.gov:85/cde_tool/cde_tool.home).
The complexity of these data sets contributes to further complication for statistical analysis. Standardized solutions for the biostatistical analysis of these complex final data sets is yet another frontier for potential exploration. This DB is extremely valuable for dealing with the increasing amount of data generated by high-throughput technologies. Perhaps the use of bar code labels on such items as donor-specimen blocks and slides and as codes for various tissue diagnoses is one way to further increase the efficiency of entering voluminous data. Further robotic tissue arrayers, automated digital imaging systems (slide scanners), and automated slide stainers may offer integrated solutions for such studies.
Acknowledgments
We thank Drs. G. Steven Bova and Thomas Wheeler for their insight on Internet-based assessment of histology images; Robin Kunkel for preparing the figures; and Shelton H. Manley Jr., our computer programmer/network manager, on making the DAP Internet ready, enabling security, and providing valuable support on database-related issues.
Footnotes
Address reprint requests to Mark A. Rubin, M.D., University of Michigan, Department of Pathology, 1500 E. Medical Center Dr., CCGC 7314 Box 0946, Ann Arbor, MI 48109-0946. E-mail: marubin@umich.edu.
Supported by the National Cancer Institute Specialized Program of Research Excellence in Prostate Cancer (grant P50CA69568 to University of Michigan) and Specialized Program of Research Excellence in Prostate Cancer (grant P50CA58236 to Johns Hopkins University School of Medicine).
References
- 1.Kononen J, Bubendorf L, Kallioniemi A, Barlund M, Schraml P, Leighton S, Torhorst J, Mihatsch MJ, Sauter G, Kallioniemi OP: Tissue microarrays for high-throughput molecular profiling of tumor specimens. Nat Med 1998, 4:844-847 [DOI] [PubMed] [Google Scholar]
- 2.Bova G, Parmigiani G, Epstein J, Wheeler T, Mucci N, Rubin M: Web-based tissue microarray visual image data analysis: initial validation testing through prostate cancer Gleason grading. Hum Pathol 2001, 32:417-427 [DOI] [PubMed] [Google Scholar]
- 3.Mucci NR, Akadas G, Manley S, Rubin MA: Neuroendocrine expression in metastatic prostate cancer: evaluation of high throughput tissue microarrays to detect heterogeneous protein expression. Hum Pathol 2000, 31:406-414 [DOI] [PubMed] [Google Scholar]
- 4.Chaib H, Rubin M, Mucci N, Li L, Taylor J, Rhim J, Macoska J: Activated in prostate cancer (AIPC): a PDZ domain-containing protein highly expressed in human primary prostate tumors. Cancer Res 2001, 61:2390-2394 [PubMed] [Google Scholar]
- 5.Rubin M, Mucci N, Figurski J, Fecko A, Pienta K, Day M: E-Cadherin expression in prostate cancer: a broad survey using high density tissue microarray technology. Hum Pathol 2001, 32:690-697 [DOI] [PubMed] [Google Scholar]
- 6.Perrone EE, Theoharis C, Mucci NR, Hayasaka S, Taylor JM, Cooney KA, Rubin MA: Tissue microarray assessment of prostate cancer tumor proliferation in African-American and white men. J Natl Cancer Inst 2000, 92:937-939 [DOI] [PubMed] [Google Scholar]
- 7.Bubendorf L, Kolmer M, Kononen J, Koivisto P, Mousses S, Chen Y, Mahlamaki E, Schraml P, Moch H, Willi N, Elkahloun AG, Pretlow TG, Gasser TC, Mihatsch MJ, Sauter G, Kallioniemi OP: Hormone therapy failure in human prostate cancer: analysis by complementary DNA and tissue microarrays. J Natl Cancer Inst 1999, 91:1758-1764 [DOI] [PubMed] [Google Scholar]
- 8.Bubendorf L, Kononen J, Koivisto P, Schraml P, Moch H, Gasser TC, Willi N, Mihatsch MJ, Sauter G, Kallioniemi OP: Survey of gene amplifications during prostate cancer progression by high-throughout fluorescence in situ hybridization on tissue microarrays. Cancer Res 1999, 59:803-806 [PubMed] [Google Scholar]