Abstract
Skeletal muscle (SM), the body’s main structural support, has been implicated in metabolic, physiological, and disease processes in humans. Despite being the largest tissue in the human body, its assessment remains difficult and indirect. However, being metabolically active it contains over 50% of the total body potassium (TBK) pool. We present our preliminary results from a new system for measuring partial body K (PBK) that presently are limited to the arm yet provide a direct and specific measure of the SM. This uniquely specific quantification of the SM mass in the arm, which is shielded from the body during measurement, allows us to simplify the assumptions used in deriving the total SM, thereby possibly improving the modeling of the human body compartments. Preliminary results show that PBK measurements are consistent with those from the TBK previously obtained from the same subjects, thus offering a simpler alternative to computed tomography and magnetic resonance imaging used for the same purposes. The PBK system, which can be set up in a physician’s office or bedside in a hospital, is completely passive, safe, and inexpensive; it can be used on immobilized patients, children, pregnant women, or other at-risk populations.
Keywords: body composition, in vivo, gamma ray spectroscopy
ELEMENTAL POTASSIUM (K), essential to all living organisms, is a dominant cation almost entirely (>97%) intracellular (4). The 70-kg reference man, for example, contains ~140 g K of which ~84 g (60%) is located in the skeletal muscle (SM) with the rest distributed unevenly among other organs (2, 11). SM, the largest tissue in the human body, is actively involved in energy metabolism and multiple biochemical and physiological processes, and, consequently, in many diseases, such as sarcopenia (3). Its vital role is evidenced by the fact that a loss of 40% of SM may significantly increase a person’s mortality risk. Thus an accurate determination of the SM mass is of great clinical interest and for body composition research.
Although many strides have been made, SM remains a difficult component to assess quantitatively in vivo and to relate to other compartments in the human body. The situation is further exacerbated by the limited knowledge of the SM distribution in healthy adults (6). Lee et al. (8) recently outlined the advantages and drawbacks of several methods, such as computerized tomography (CT), magnetic resonance imaging (MRI), dual-energy X-ray absorptiometry (DXA), and total body K (TBK). They surmised that the TBK-whole SM model is preferable to other models, albeit the instrumentation is prohibitively expensive. Wang and colleagues (12), in attempting to derive better estimates of SM, also proposed a model based on TBK. Systems offering direct and better estimates of the SM undoubtedly would be very beneficial in the early detection of deficiencies and imbalances in K levels and its distribution and might well result in better understanding of the functionality of SM and the role K plays in reducing potential risks to patients.
K, because of its physical characteristics, is the only element in the human body that can be determined noninvasively in completely passive ways. TBK is widely recognized as the best indicator of the intracellular compartment, i.e., the body cell mass. As an index of body composition, it has a long history in nutritional research, and probably the simplicity of its measurement contributed significantly to the quantification of TBK vs. the many other published body indexes. However, we emphasize that TBK is not only a measure of K in the SM, which contains 60% of the TBK, but also includes the remaining 40% distributed among other muscles and organs. Thus as TBK represents a total body integral response it may conceal or dilute small regional changes in the K content.
To partially remediate this situation by gaining direct insight into the SM, we have introduced an innovative methodology that measures regional K in the SM. We designed a system that measures gamma radiation emanating from the40K located in the arm alone, thus providing an independent and direct indication of partial body K (PBKarm) in the SM. We demonstrated in an earlier study the feasibility of determining K in the brain (13). Our preliminary results from a PBKarm system in conjunction with those from a TBK system obtained earlier from the same subjects clearly demonstrate the complementarities of both systems and the unique and distinct advantages of the PBKarm system in enabling new approaches to developing new models and verifying old ones in the compartmental analysis of the human body. This report points out the basic capabilities of performing partial body measurement of the SM and does not purport to provide in-depth comparison between SM determination by PBK and that by CT, MRI, or DXA, which naturally is of greater interest and should be performed in future work. The reported results demonstrate initial feasibility of using PBK for measurements in humans.
METHODS
Subjects
Volunteers were drawn from three different study groups [2G (normal), 3L (normal and aging), and 5N (renal)], that represented two distinct cohorts: normal individuals, 87 women and 58 men, and renal patients, 20 women and 19 men. Some members of these groups were obese, with a body mass index larger than 30 kg/m2. Figure 1 shows the mean values and standard deviations (SD) of the PBKarm and TBK, and the data spread in the original study groups separated by sex. Except for the systematic differences between sexes wherein men have higher PBKarm and TBK values, there were no significant differences within the same sex groups (including normal individuals and renal patients). Because the objective of this study was to observe the basic relationship between the PBKarm and TBK and because there were few subjects in each individual group, they were combined, giving us a group of 107 women and one of 76 men. All renal subjects were identified in the graph, and because they did not differ substantially from the rest of these two cohorts, they were not removed from the study. Table 1 summarizes the parameters’ mean value ±SD and minimum and maximum values for the groups. Not all of the parameters were measured on every subject, so the graphs may contain fewer points than the groups’ sizes.
Fig. 1.
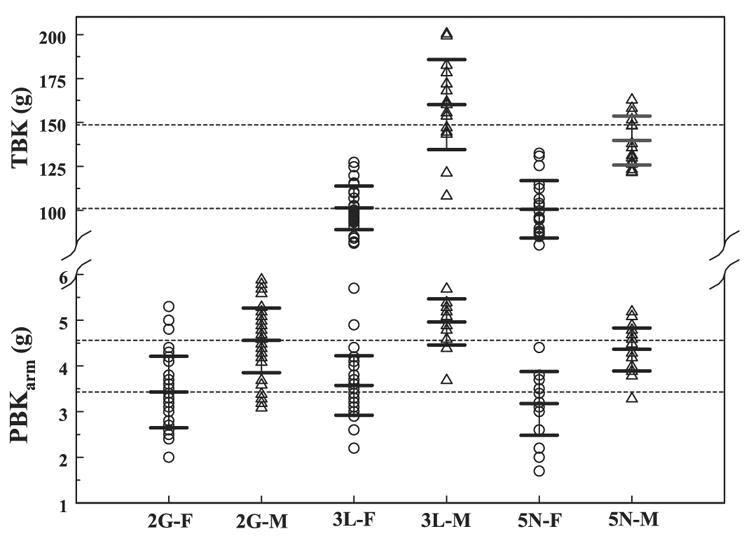
Measured female (F) and male (M) potassium distributions in the arm [partial body potassium (PBKarm)] and in the whole body [total body potassium (TBK)]. Dashed lines represent the mean PBK and TBK values in all women and men from the 3 study groups (2G, normal; 3L, normal and aging; and 5N, renal cohorts). Mean values and ±SD for each group are marked.
Table 1.
Group parameters included in the study
|
Women, n = 104
|
Men, n = 76
|
|||||
|---|---|---|---|---|---|---|
| Mean | SD | Min-Max | Mean | SD | Min-Max | |
| Age, yr | 45.0 | 16.5 | 18–87 | 46.0 | 16.3 | 18–82 |
| Weight, kg | 70.5 | 14.8 | 43.2–116.1 | 83.0 | 15.5 | 45.5–128.0 |
| BMI | 26.7 | 5.70 | 17.2–46.5 | 26.7 | 4.60 | 16.6–40 |
| PBKarm, g | 3.43 | 0.73 | 1.7–5.7 | 4.59 | 0.64 | 3.1–5.9 |
| TBK, g | 101.1 | 13.9 | 78.8–132.5 | 148.6 | 23.2 | 105.8–200.9 |
BMI, body mass index; PBKarm, partial body potassium measured in the
arm; TBK, total body potassium.
Potassium measurement and analysis
K measurement is based on the presence of the long lived, ~109 years half-life, natural radioisotope40K that is in a dynamic equilibrium of 0.0117% with the other two stable isotopes,39K and41K. A complex decay scheme to the ground state of40K yields a single 1.46 MeV monoenergetic gamma ray that is emitted isotropically at a rate of ~200 gamma rays per second per gram of natural K. These gamma rays can be detected by using standard detectors as for example in the case of a whole body counter, a 4πliquid scintillation counter that completely surrounds a subject placed supine inside the counter. This system, used for determination of TBK, and the calibration correction factors for body size were described by Pierson et al. (9). Solid NaI crystal scintillation detectors are used to measure K in the arm. The PBKarm system consisted of four NaI detectors, 7.5 cm × 7.5 cm and 40 cm long, arranged in the form of a cross creating a 7.5 cm × 7.5 cm and 40-cm-long cavity and standard gamma ray spectroscopy electronics coupled to a multichannel analyzer. Subjects insert their whole arm into the cavity where it is counted for 15 min. The coefficient of variation of the PBKarm system of 12 measurements of a 1.5 liter water phantom containing 5 g of K was ~5.7%. The error of a single measurement on an individual is ~4%. A more detailed PBKarm system description is provided by Ramirez (10).
System stability and reproducibility were followed for 3 years and included 335 measurements. The background in the region of interest (ROI) of the K photopeak averaged total 5,607 counts over 15 min counting time with a SD of 3.6%. Notice that this ROI also includes K signal from the environment. One hundred fifty-one measurements of a 20-g K in a phantom, over the same period of time, averaged 14,529 net number of counts in the ROI with a 3.0% SD. However, 19 measurements of an individual over 3 different days within a 3-mo period averaged 2,100 net counts in the ROI with a SD of 5.0%, thus suggesting reasonable reproducibility in subject positioning in the system. Further studies of the system reproducibility with various individuals would provide a more precise assessment of the percentage contribution of subject variability within the coefficient of variation.
On the basis of calibrations obtained from water phantoms with known amounts of K, the TBK and PBKarm measurements were converted from number of counts to grams. The PBKarm measurement, being first of its kind, could not be compared directly with any published values in the literature. Instead, we compared our results with a related quantity of the arm appendicular SM mass that was estimated independently by alternative techniques. A detailed system evaluation should further clarify the system calibration and address the relationship of SM from PBK compared with SM from other methods.
To assess the total skeletal mass from PBKarm measurement it was assumed that K is uniformly distributed within the SM at concentration of 3 g K/kg SM (2). Therefore, the ratio of the K content in the upper appendicular SM to that in the lower appendicular SM is the same as the ratio of the weights of the respective SM masses. Thus, using weight- and age-averaged ratios of the appendicular SM masses of arms to legs of 0.28 for women and 0.34 for men (6) and the total appendicular SM K to total SM K factor of 1/0.75 reported by Gallagher for both sexes (7), we obtain conversion factors of 4.06 for women and 3.5 for men. To account for both arms, we doubled the PBKarm values. Finally, the total skeletal muscle K was converted to total skeletal muscle mass in kilograms by multiplying kilograms SM per gram K by one-third.
RESULTS
The basic relationships between measured PBKarm and TBK for male and female cohorts are shown in Fig. 2 with the corresponding regression lines. The regression parameters with the errors, r2, and P values are summarized in Table 2. Data points marked by a cross denote obese individuals with body mass index over 30, and although some of them appear to be outliers, they were not removed from present analysis.
Fig. 2.
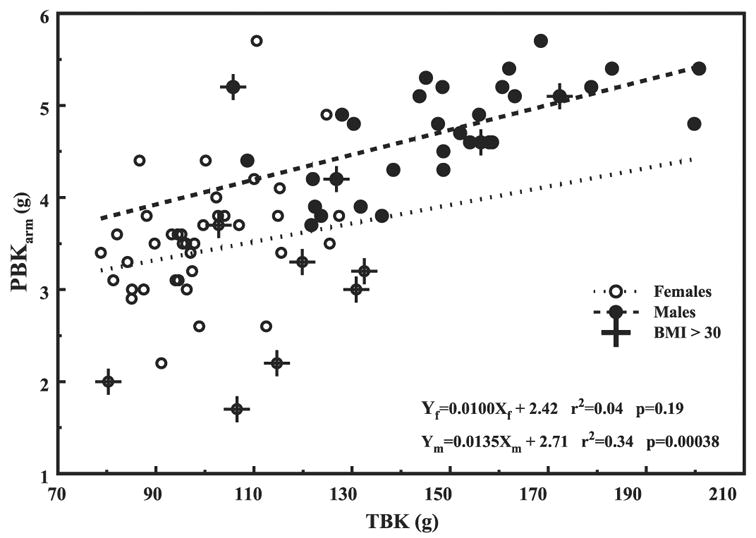
PBKarm vs. TBK for women (○ with dotted line) and men (● with dashed line). Crosses indicate subjects with body mass index > 30. The regression lines parameters are summarized in Table 2.
Table 2.
Summary of the regression lines parameters
| Group | Slope3SEE | Intercept±SEE | r2 | P | |
|---|---|---|---|---|---|
| PBK-TBK | Women | 0.01030.0075 | 2.42±0.77 | 0.04 | 1.9e-1 |
| Men | 0.01430.0034 | 2.71±0.51 | 0.34 | 3.8e-4 | |
| TSM-TBK | Women | 0.001630.0008 | 9.83±2.08 | 0.04 | 1.9e-1 |
| Men | 0.001830.0003 | 9.48±1.19 | 0.34 | 4.0e-4 | |
| PBK/TBK-TBK | Women | −0.000230.0001 | 0.057±0.0074 | 0.18 | 4.0e-3 |
| Men | −0.000130.0000 | 0.051±0.0040 | 0.42 | 5.0e-5 | |
| PBK/TBK-TBW | Women | −0.000330.0001 | 0.056±0.0043 | 0.37 | 1.0e-5 |
| Men | −0.000230.0000 | 0.046±0.0032 | 0.40 | 1.0e-4 | |
| PBK/TBK-Age | Women | −0.000030.0001 | 0.034±0.0038 | 6e-8 | 9.9e-1 |
| Men | −0.000030.0000 | 0.030±0.0019 | 0.03 | 3.6e-1 | |
| PBK-Age | Women | −0.011930.0043 | 3.97±0.21 | 0.07 | 7.0e-3 |
| Men | −0.012030.0043 | 5.16±0.21 | 0.10 | 7.0e-3 | |
| TBK-Age | Women | −0.47530.10 | 125.8±5.64 | 0.32 | 4.0e-5 |
| Men | −0.84430.19 | 191.6±9.77 | 0.40 | 1.0e-4 |
SEE, standard error of the estimate.
In Fig. 3, we converted the Fig. 2 x-axis from TBK (g) to TBK (mmol) by multiplying it by 25.64 (1,000/39), and the y-axis from PBKarm (g) to total skeletal muscle mass (TSM) in kilograms by multiplying it by 4.06 for women and by 3.5 for men. The data with converted axes were replotted in Fig. 3 with the resulting slopes for the regression lines of 0.0016 kg SM/mmol K for women and 0.0018 kg SM/mmol K for men. The TSM masses estimated from the PBKarm for men, ~17 kg, appear to be lower than that from a standard man of 28 kg, whereas ~15 kg for women is much closer to the reported value of 18 kg (5). Furthermore, although the trends are similar, the slopes’ sex-combined regression differ by about a factor of 4 from that of 0.0085 kg SM/mmol K reported by Wang et al. (12). From both graphs in Figs. 2 and 3 we see that the arm K and the total SM increase with increasing TBK. However, the difference between the sexes is considerably lessened when using TSM, which could be associated with using joint values during transformation for both sexes.
Fig. 3.
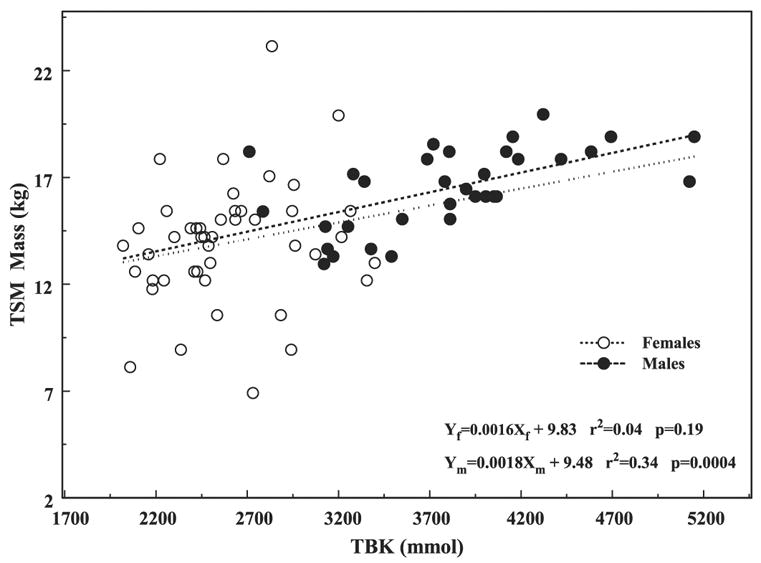
Total skeletal muscle (TSM) mass based on PBKarm vs. TBK in the combined cohorts separated by sex.
The rate at which the partition of K between PBKarm and TBK (PBKarm/TBK ratio) occurs differs for men and women and decreases when plotted vs. TBK and total body weight in Figs. 4, A and B, respectively. The arrangement of the data points in Fig. 4B is quite distinct from that in Fig. 4A, suggesting that because of the different transformations and the assumptions involved in each one, it is critically important which quantity is chosen as an independent variable. It is also interesting to note that whereas the ratio of the arm SM to leg SM increases with weight (6), that of the arm SM to total weight declines with weight, which, in general, is consistent with Gallagher and Heymsfield’s (6) observation. However, when this ratio is plotted vs. age, Fig. 4C, it remains constant in contrast to the arm-to-leg SM ratio reported by Gallagher that increases with age. When PBKarm and TBK are plotted individually vs. age in Fig. 5, they very closely agree with the slopes for arm SM and TBK vs. age derived by Gallagher et al. (7).
Fig. 4.
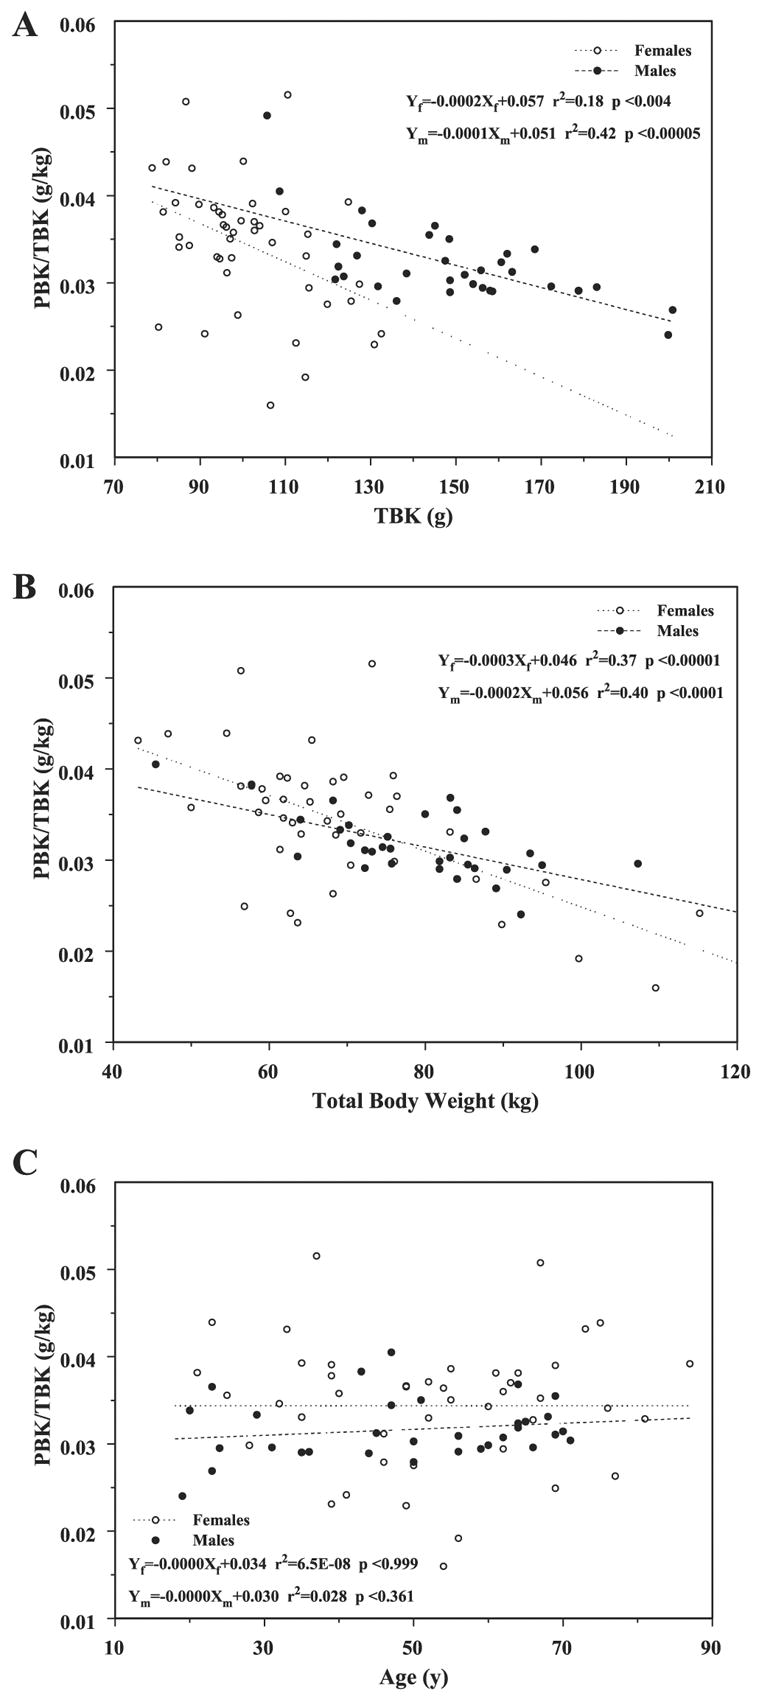
Changes in the PBKarm-to-TBK ratio vs. TBK (A), vs. total body weight (B), and vs. age (C).
Fig. 5.
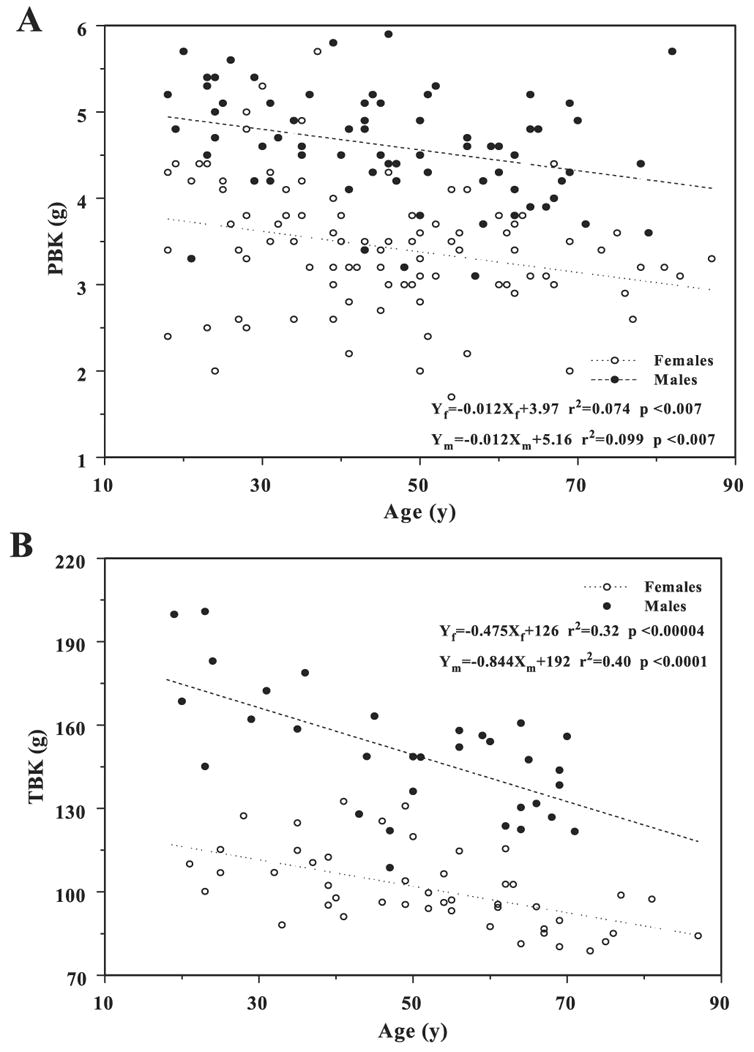
Variations in PBKarm (A) and TBK (B) vs. age.
Finally, in addition to Table 1 that summarizes all the basic information about the two sex groups, Fig. 6, A and B, shows the TBK and PBKarm density distributions, respectively, wherein the area under each curve equals one. This is a more detailed description of the basic data indicating that any skew in it could occur naturally or reflect erroneous calculations.
Fig. 6.
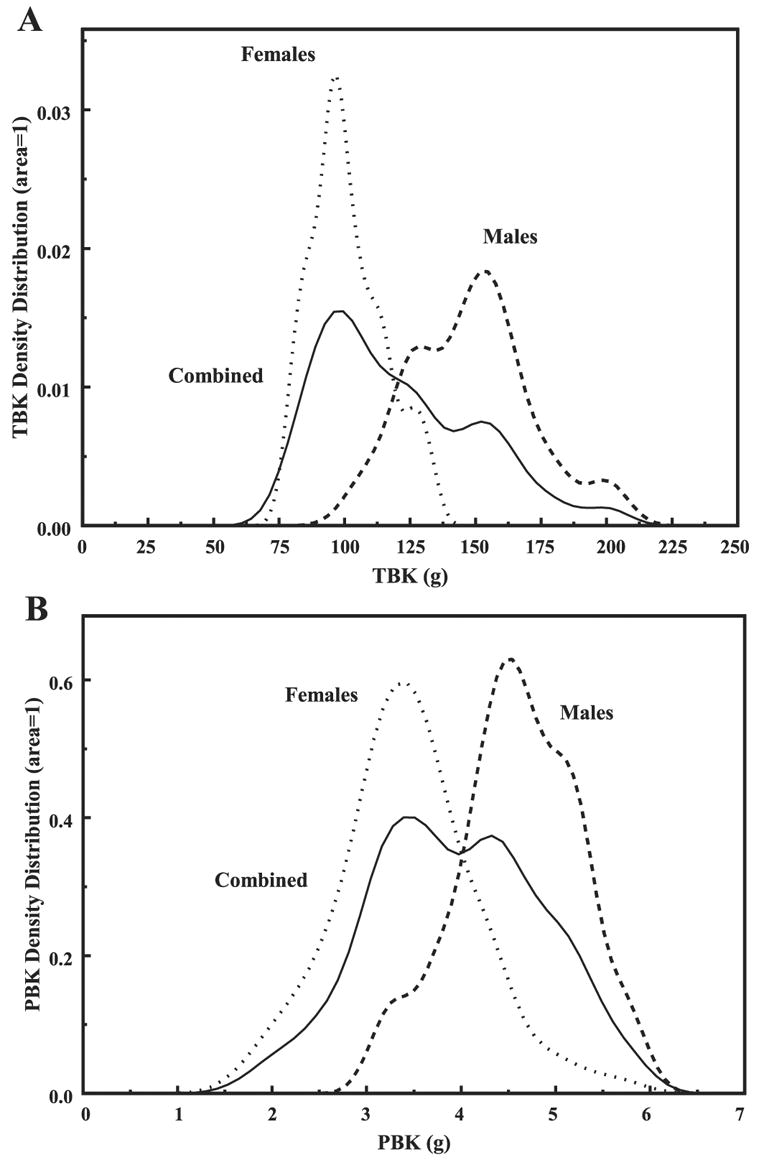
TBK (A) and PBKarm (B) density distributions for the individual and sex-combined groups. The area under each curve is 1.
DISCUSSION
In this study we demonstrated the viability of PBKarm in body composition studies, and, in particular, we suggest that it may offer a direct measure of the long-sought SM compartment. Until now, any attempt to quantify SM rested on a combination of several methods, or on transforming a single measure, as for example TBK into SM, by using several underling assumptions that inherently may be oversimplifications. PBKarm directly measures SM with the single assumption that within that organ the K concentration per kilogram of SM is constant.
Because the objective of this study was to evaluate the utility of the PBKarm, and because there were few people in the various cohorts, we combined the data and analyzed it by sex alone. Removing individuals with renal disease would not have affected the general conclusions; for example, inclusion or exclusion of renal men changed the regression line PBKarm vs. TBK from 0.0135 to 0.0083 and the intercept from 2.708 to 1.771, small effects. However, women affected the regression slope from 0.01 to −0.0059 and the intercept from 2.421 to 3.776. Nevertheless, these are not large differences considering the female scattered data that requires further investigation. Some of the obese subjects, body mass index > 30, not shown here, constitute some of the outliers but were not removed from the study. The same obese subjects appear consistently in all the other graphs. With more volunteers, and when deriving definite parameters relating different compartments, these cohorts should not be mixed.
In this limited study we demonstrated the similarity in trends and slopes of PBKarm, which is part of TBK, and SM mass derived from PBKarm vs. TBK (Figs. 2 and 3). Lacking published data for PBKarm, we transformed it into SM for that purpose. Thus derived SM masses for men and women on the basis of PBKarm appear to underestimate the reported values for which at present we suspect that ~10 cm of the arm from the shoulder down was shielded from the detectors. Work is in progress to standardize the arm positioning and to account properly for the shielded volume of the arm. We also noticed that the sex differences in Fig. 3 were considerably less than those in Fig. 2. We attribute these changes to the effects of averaging and smoothing and to the assumptions adopted for the transformation. The same assumptions are also required when evaluating SM from TBK measurements. We also pointed out that the regression line for the combined sex cohorts is biased by about a factor of two relative to the slopes of the individual regression lines; this simply reflects differences in the mean values of the groups.
The similar downward trends in the slopes of the PBKarm/TBK ratio vs. TBK and total body weight (Figs. 4 and 5, respectively) suggest, first, that the arm’s PBKarm or the TSM ratio to total TBK does not remain constant as Wang et al. (12) suggested, and second, the slopes in Figs. 2 and 4 mathematically cannot at the same time both be linear vs. TBK, suggesting more complicated relationships that include some hidden variables. For example, the TBK, in its simplest form, has contributions from the SM and from the remaining fat-free mass compartments between which there is no constant portioning of K. This is also confirmed by the opposite trends of PBKarm/TBK ratio (Fig. 4), and the ratio of the upper to lower appendicular SM that increased with weight as Gallagher and Heymsfield (6) demonstrated. Although these are not the same quantities, they should behave similarly. From Fig. 6, the PBKarm/TBK ratio appears independent of age again in contrast to Gallagher’s findings in which she showed a downward trend. Cohn et al. (1) also reported a decline of TBK and lean body mass ratio with age.
There are similar losses in PBKarm and TBK with age for women and men (Fig. 5). K loss in the arm occurs at the same rate for both sexes, although its value is offset by ~2 g higher for men than for women; however, the loss in TBK for men is faster than that for women, with ~70 g offset. Thus the K in the arm, as measured by PBKarm, and, consequently, the arm’s appendicular SM fraction of the total TBK representing total fat-free mass is not constant and depends on the subject’s weight rather than age.
In summary, we demonstrated the viability of PBKarm measurement and its basic relationship with TBK. The direct measurements of the SM compartment by PBKarm offer new information that may change our conventional wisdom about assumptions pertaining to body composition and subsequent changes. With further measurements involving the lower extremities, PBK will afford a unique picture of the SM compartment. Because the PBK is a relatively small, inexpensive instrument, compared with a TBK system, it should be possible to implement it in a clinical setting on a par with DXA. Determining FFM from DXA measurements entails using companies’ proprietary information for solving for three compartments based on two equations, which has led to disagreements in the literature. PBKarm offers the third equation required for proper resolution of the issue and, being a direct measurement, may provide the gold standard against which the DXA system might be calibrated. The specific relationships between TBK and lean mass tissue and body waters are being summarized.
Acknowledgments
We express thanks to Avril Woodhead for assisting in preparation of the manuscript.
Footnotes
GRANTS
This work was partially supported by NIH PO1-DK42618 and by Brookhaven Science Associates, LLC under Contract no. DE-AC02-98CH10886 with the US Department of Energy.
References
- 1.Cohn SH, Vaswani AN, Yasumura S, Yuen K, Ellis KJ. Assessment of cellular mass and lean body mass by noninvasive nuclear techniques. J Lab Clin Med. 1985;105:305–311. [PubMed] [Google Scholar]
- 2.Elia M. Organ and tissue contribution to metabolic rate. In: Kinney JM, Tucker HN, editors. Energy Metabolism: Tissue Determinants Cellular Corollaries. New York: Raven; 1992. pp. 19–60. [Google Scholar]
- 3.Ellis KJ. Human body composition: in vivo methods. Physiol Rev. 2000;80:649–680. doi: 10.1152/physrev.2000.80.2.649. [DOI] [PubMed] [Google Scholar]
- 4.Ellis KJ. Total body potassium: a reference measurement for the body cell mass. In: Pierson RN Jr, editor. Quality of the Body Cell Mass Body Composition in the Third Millennium. New York: Springer; 2000. p. 119. [Google Scholar]
- 5.Gallagher D, Allen A, Wang ZM, Heymsfield SB, Krasnow N. Smaller organ tissue mass in the elderly fail to explain lower resting metabolic rate. Ann NY Acad Sci. 2000;904:449–455. doi: 10.1111/j.1749-6632.2000.tb06499.x. [DOI] [PubMed] [Google Scholar]
- 6.Gallagher D, Heymsfield SB. Muscle distribution: variations with body weight, gender, and age. Appl Radiat Isot. 1998;49:733–734. doi: 10.1016/s0969-8043(97)00096-1. [DOI] [PubMed] [Google Scholar]
- 7.Gallagher D, Visser M, De Meersman RE, Sepulveda D, Baumgartner RN, Pierson RN, Harris T, Heymsfield SB. Appendicular skeletal muscle mass: effects of age, gender, and ethnicity. J Appl Physiol. 1997;83:229–239. doi: 10.1152/jappl.1997.83.1.229. [DOI] [PubMed] [Google Scholar]
- 8.Lee RC, Heymsfield SB, Shen W, Wang ZM. Total-body and regional skeletal muscle mass measurement methods: an overview. Int J Body Comp Res. 2003;1:1–10. [Google Scholar]
- 9.Pierson RN, Jr, Wang J, Thornton JC, Van Itallie TB, Colt EW. Body potassium by four-pi40K counting: an anthropometric correction. Am J Physiol Renal Fluid Electrolyte Physiol. 1984;246:F234–F239. doi: 10.1152/ajprenal.1984.246.2.F234. [DOI] [PubMed] [Google Scholar]
- 10.Ramirez LM. Feasibility study of in vivo partial body potassium determination in the human body using gamma ray spectroscopy (PhD dissertation) Austin, TX: University of Texas at Austin; 2005. p. 69. [Google Scholar]
- 11.Snyder WS, Cook MJ, Karhausen LR, Nasset ES, Parry Howells G, Tipton IH. Report of the Task Group on Reference Man. Oxford, UK: Pergamon, International Commission on Radiological Protection no. 23; 1975. [Google Scholar]
- 12.Wang ZM, Zhu S, Wang J, Pierson RN, Jr, Heymsfield S. Whole-body skeletal muscle mass: development and validation of total-body potassium prediction models. Am J Clin Nutr. 2003;77:76–82. doi: 10.1093/ajcn/77.1.76. [DOI] [PubMed] [Google Scholar]
- 13.Wielopolski L, Ramirez LM, Coyle PK, Wang ZM, Heymsfield SB. Proof-of-principle to measure potassium in the human brain: a feasibility study. Int J Body Comp Res. 2004;2:37–43. [PMC free article] [PubMed] [Google Scholar]


