Abstract
Activating transcription factor 3 (ATF3) is a member of the CREB/ATF family of transcription factors. Previously, we demonstrated that the expression of the ATF3 gene is induced by many stress signals. In this report, we demonstrate that expression of ATF3 is induced by cardiac ischemia coupled with reperfusion (ischemia-reperfusion) in both cultured cells and an animal model. Transgenic mice expressing ATF3 under the control of the α-myosin heavy chain promoter have atrial enlargement, and atrial and ventricular hypertrophy. Microscopic examination showed myocyte degeneration and fibrosis. Functionally, the transgenic heart has reduced contractility and aberrant conduction. Interestingly, expression of sorcin, a gene whose product inhibits the release of calcium from sarcoplasmic reticulum, is increased in these transgenic hearts. Taken together, our results indicate that expression of ATF3, a stress-inducible gene, in the heart leads to altered gene expression and impaired cardiac function.
Heart failure is a complex syndrome that can result from virtually any disorder affecting the myocardium, 1 such as ischemic heart disease, hypertension, valvular disease, and primary cardiomyopathy. One common feature of these etiologies is the imposition of an abnormal load on the myocardium. This overload induces complex humoral, mechanical, and neural responses that initially compensate systolic function by increasing heart rate, contractility, and the size of sarcomeres (hypertrophy). 2 Despite these compensatory mechanisms, however, if the inciting diseases are left untreated, heart failure ensues with dilated cardiomyopathy—the end-stage phenotype of heart failure—regardless of etiology. Therefore, one critical area for heart failure research is to elucidate the responses of cardiomyocytes to the stress of abnormal load.
We have been investigating a stress-inducible gene, activating transcription factor 3 (ATF3). It is a member of the CREB/ATF family of basic region-leucine zipper (bZip) transcription factors. 3-8 Overwhelming evidence from us and others indicates that ATF3 is induced by a variety of stress signals in different cell types. 7,8 Previously, we demonstrated that the mRNA level of ATF3 greatly increases in the heart after myocardial ischemia, and ischemia coupled with reperfusion (ischemia-reperfusion), in the kidney after renal ischemia-reperfusion, in the skin after wounding, in the brain after seizure, and in the liver after chemical toxicity and partial hepatectomy (unpublished results). 9,10 In addition to the above animal experiments, in vitro experiments using cultured cells also indicate that ATF3 is induced by stress signals, including cytokines, 11,12 genotoxic agents such as ionizing radiation, 13 and agents known to induce cell death or the JNK/SAPK signaling pathway such as anisomycin 14 and cycloheximide. 15 Therefore, ATF3 is induced in a variety of cell types by many different stress signals, suggesting that it may be a key regulator in cellular stress responses. One common theme of all of the signals that induce ATF3 is that they also induce cellular damage. Therefore, the induction of ATF3 seems to correlate with cellular damage. In this report, we describe our recent studies on the roles of ATF3 in cardiac stress responses. We present evidence indicating that ectopic expression of ATF3 in the heart leads to conduction abnormalities and contractile dysfunction, suggesting that induction of ATF3 by stress signals may play a role in the pathogenesis of stress-associated cardiac diseases.
Materials and Methods
Ischemia-Reperfusion Models
In Vivo Model
Two-month-old male Sprague-Dawley rats were anesthetized, intubated by tracheotomy, and ventilated using a pressure-controlled ventilator. The heart was exposed by the left intercostal approach and the left coronary artery was ligated with an 18-gauge needle tied against it. Ischemia was confirmed by ST segment elevation in electrocardiography (ECG). After 2 hours of ischemia, the ventricle was reperfused by removal of the needle. At 1 hour after reperfusion, the heart was excised from the surviving animals (∼50%) and frozen immediately for in situ hybridization.
In Vitro Model
Cardiomyocytes from Sprague-Dawley rats at 1 to 2 days of age were prepared as described previously 16 with minor modifications. Cells were incubated with buffer containing 20 mmol/L HEPES (pH 6.6), 125 mmol/L NaCl, 4.9 mmol/L KCI, 1.2 mmol/L MgSO4, 1.2 mmol/L NaH2PO4, 1.8 mmol/L CaCl2, 8 mmol/L NaHCO3, 5 mmol/L NaCN, and 20 mmol/L deoxyglucose for 2 hours to deplete ATP. Cardiomyocytes were then allowed to recover in normal media for 2 hours before the isolation of total RNA.
Generation of the Myosin Heavy Chain Promoter (MyHC)-ATF3 Transgenic Mice
The human ATF3 gene was targeted to the heart using the α-MyHC promoter (from Dr. J. Robbins, University of Cincinnati). Transgenic mice were generated in the FVB/N background, and mice containing the transgene were identified by polymerase chain reaction (PCR) using the upstream primer 5′-GACTTCACATAGAAGCCTAGCC-3′ complementary to the α-MyHC region, and the downstream primer 5′-AACCACAACTAGAATGCAGTG-3′ complementary to the SV40 polyA region.
In Situ Hybridization and Immunohistochemistry
In situ hybridization and immunohistochemistry were performed as detailed previously. 9
RNA Isolation, Reverse Transcriptase (RT)-PCR, and Dot Blot
Total RNA was isolated using Trizol reagent (Life Technologies, Inc., Rockville, MD). Reverse transcription was performed using avian myeloblastosis virus reverse transcriptase (Promega, Madison, WI) and the resulting cDNA was subjected to PCR. Rat ATF3 mRNA was analyzed by the upstream primer 5′-GCTCTAGAAAAAAAGAGAAGACRGAGTGC-3′ and the downstream primer 5′-TCTCCAATGGCTTCAGGGTT-3′. Human ATF3 transgenic mRNA was analyzed by the upstream primer 5′-GAGGTAGCCCCTGAAG-3′ complementary to the ATF3 coding region, and the downstream primer complementary to the SV40 polyA region as above. Glyceraldehyde-3-phosphate dehydrogenase (GAPDH) mRNA was analyzed by the upstream primer 5′-CCGGATCCTGGGAAGCTTGTCATCAACGG-3′ and the downstream primer 5′-GGCTCGAGGCAGTGATGGCATGGACTG-3′. Quantitative RNA dot-blot analysis was performed as described previously 43 with modifications. Briefly, RNA was resuspended in diethyl pyrocarbonate-treated water, and denatured by heating to 95°C. Three μg of total RNA per dot was blotted onto nitrocellulose filters using a dot-blot filtration manifold (Bio-Rad, Melville, NY). All samples were analyzed in duplicate. The synthetic oligonucleotides used as transcript-specific probes are as follows: atrial natriuretic factor 5′-AATGTGACCAAGCTGCGTGACACACCACAAGGGCTTAGGATCTTTTGCGATCTGCTCAAG-3′, α-skeletal actin 5′-TGGAGCAAAACAGAATGGCTGGCTTTAATGCTTCAAGTTTTCCATTTCCTTTCCACAGGG-3′, β-myosin heavy chain (β-MyHC) 5′-GCTTTATTCTGCTTCCACCTAAAGGG-CTGTTGCAAAGGCTCCAGGTCTGAGGGCTTC-3′,myosin light chain 2 ventricular isoform (MLC2v) 5′-CACAGCCCTGGGATGGAGAGTGGGCTGTGGGTCACCTGAGGCTGT-GGTTCAG-3′, sarcoplasmic reticulum calcium channel (SERCA2a) 5′-AGGTGTGTTGCTAACAACGCAGATGCAC-GCACCCGAACACCCTTATATTTCTGCAAATGG-3′, and GAPDH 5′-GGAACATGTAGACCATGTAGTTGAGGTCAATGAAG-3′. All oligonucleotide probes were 5′ end-labeled with γ[32P]-ATP using T4 polynucleotide kinase (Promega). The sorcin probe was a random-primed probe derived from an ∼300-bp fragment of the mouse sorcin cDNA. The cDNA clone was generated by ligating pBSSK vector with an RT-PCR product derived from mouse mRNA using the upstream primer 5′-AACTGCAGCTGAATGGCTGGAGACAACAC-3′ and downstream primer 5′-CCCAAGCTTTTAGACGGTCATGACACACTG-3′. Italics indicate the PstI and HindIII sites for cloning. Sequence analysis confirmed that the clone contains a fragment of the mouse sorcin cDNA, and the probe was found to hybridize to a single band on a Southern blot using mouse genomic DNA under hybridization conditions identical to those used for dot-blot hybridization. Quantitation of hybridization signals was accomplished using a Storm 860 PhosphorImaging system and Imagequant software (Molecular Dynamics, Sunnyvale, CA). The signal intensity of each dot was normalized to that of GAPDH after correcting for background.
Histology, Morphometric Analysis, and Electron Microscopy
Hearts were fixed in 10% buffered formalin for 24 to 48 hours, dehydrated, and embedded in paraffin. Five-μm sections were stained with hematoxylin and eosin (H&E) or with Masson’s trichrome. For the analysis of ventricular dilation, mice were anesthetized and heparinized via inferior vena cava; hearts were then excised, cannulated via aorta, and perfused with cardioplegic solution (phosphate-buffered saline containing 25 mmol/L KCl and 5% glucose) before fixation. For morphometric analysis, connective tissues around the heart were trimmed from the heart after fixation. Atria were separated from ventricles under the dissection microscope. Organized thrombus, if present, was removed from the atrium. Atria and ventricles were weighed separately. Electron microscopic studies of the hearts were carried by the methods described previously. 17
Echocardiography and ECG
Mice were placed under light anesthesia with halothane inhalation (0.5 to 1% halothane in a mixture of 95% O2 and 5% CO2) and warmed to maintain body temperature. Two-dimensional and M-mode echocardiographic images were recorded and analyzed by a Sonos 1000 echocardiograph and a 7.5 MHz pediatric ultrasonic probe (Hewlett-Packard Co., Andover, MA) as described previously. 18 ECGs were acquired (sampling rate, 2000 Hz) for 30 seconds with a Biopac MP100 system (Biopac Systems Inc., Santa Barbara, CA) interfaced with a Pentium computer. Data were stored for off-line analysis with Acqknowledge (Biopac Systems, Inc.). All normal sinus rhythm records were signal-averaged before measurement of electrocardiographic intervals. Records with high-degree atrioventricular blocks were analyzed by measuring and averaging consecutive beats. The QTc interval was calculated by dividing the QT interval by the cube root of the R-R interval.
Preparation of Ventricular Myocytes and Measurement of Contractile Function in Vitro
Mice were anesthetized and heparinized via inferior vena cava. Hearts were rapidly excised, cannulated via aorta, and perfused at 37°C with 25 ml of the perfusion buffer: 118 mmol/L NaCl, 4.8 mmol/L KCl, 1.2 mmol/L MgSO4, 1.2 mmol/L KH2PO4, 0.68 mmol/L glutamine, 11 mmol/L glucose, 25 mmol/L NaHCO3, 5 mmol/L pyruvic acid, 20 μmol/L EGTA, 1% minimal essential medium amino acids solution (Life Technologies, Inc.), 1% minimal essential medium nonessential amino acids solution (Life Technologies, Inc.), and 1% minimal essential medium vitamin solution (Life Technologies, Inc.). Hearts were then perfused at 37°C for 15 minutes with the enzyme solution: perfusion buffer with 1 mg/ml collagenase (Worthington, Lakewood, NJ), and 1 mg/ml bovine serum albumin. CaC12 was added slowly during perfusion to make a final concentration of 0.75 mmol/L. The ventricles were minced and the cells were dissociated in the enzyme solution. Viable cardiomyocytes were obtained by settling in the incubation buffer (perfusion buffer with 25 mmol/L HEPES, 1 mmol/L CaC12, 1 μmol/L insulin, 2% bovine serum albumin, and penicillin-streptomycin without NaHCO3). Isotonic shortening of individual myocytes in response to electrical field stimulation was analyzed as described previously. 19
Swimming Exercise
Mice at 8 weeks of age were made to swim in a water tank with a surface area of 2200 cm 2 according to the protocol described by Geisterfer-Lowrance and colleagues. 20 The temperature of the water was kept at 30 to 32°C throughout the experiment. Two swimming sessions were held daily with a 30-minute interval. The duration of the session was 10 minutes on the first day with an increase of 10 minutes everyday up to 90 minutes each session. Drowning mice were rescued from the water and resumed swimming in the next session. The purpose for rescuing the mice was to avoid death from drowning rather than a cardiac problem. The swimming exercise continued for 22 days.
Statistical Analysis
Statistical analyses include analysis of variance and t-test. A P value of <0.05 was considered statistically significant.
Results and Discussion
Induction of ATF3 by Ischemia-Reperfusion both in Vivo and in Vitro
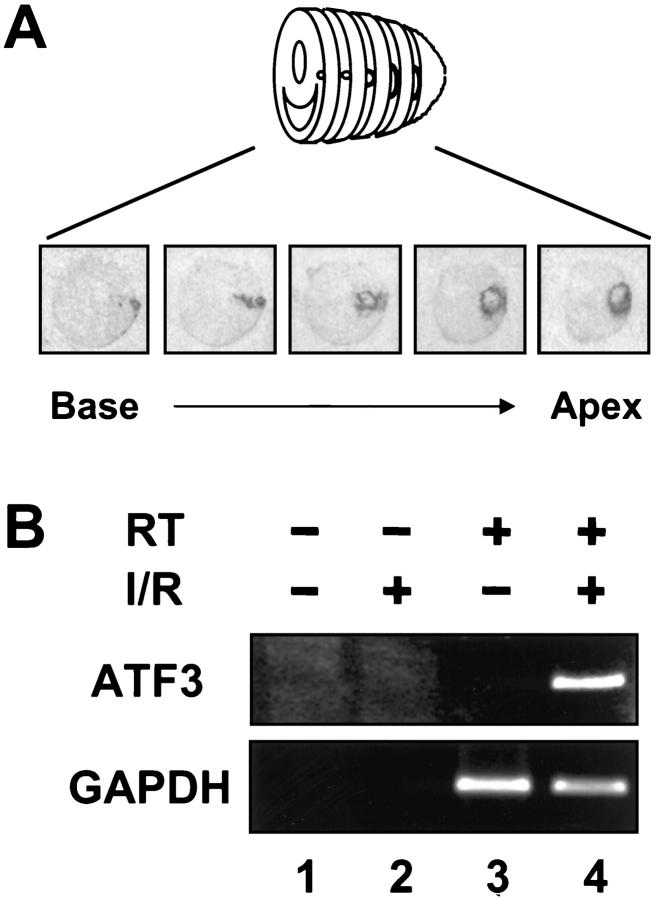
Although we demonstrated previously that ATF3 is induced in the heart by ischemia-reperfusion, 9 in those experiments we examined only a wedge of the left ventricle. To obtain a more complete picture, we examined serial cross sections of the heart derived from rats treated with coronary artery ligation coupled with reperfusion as detailed in the Material and Methods. As shown in Figure 1A ▶ , ATF3 was induced in a loop pattern as shown previously; reconstruction of serial sections revealed a cone of ATF3 expression. Control experiments using sham-operated rats showed no induction of ATF3 (data not shown). To determine whether this stress-induced expression of ATF3 can be recapitulated in vitro, we isolated cardiomyocytes from newborn rats and treated the cells with a widely used procedure to mimic ischemia-reperfusion in vitro. 21,22 Incubation with NaCN and deoxyglucose to deplete ATP was followed by the removal of these metabolic inhibitors. As shown in Figure 1B ▶ , the ATF3 mRNA level greatly increased (compare lanes 3 and 4 in Figure 1B ▶ ) as indicated by reverse transcription coupled with polymerase chain reaction (RT-PCR). The specificity of the band was demonstrated by the lack of signal if reverse transcriptase was deleted in the RT reaction (the minus RT control; Figure 1B ▶ , lane 2). The lack of ATF3 signal in untreated cells was not because of a lack of RNA in the sample, because signals for the control mRNA GAPDH were similar between uninduced and induced cells (Figure 1B ▶ , lanes 3 and 4, bottom panel).
Figure 1.
ATF3 is induced by myocardial ischemia-reperfusion. A: Heart sections from rats subjected to coronary artery ligation followed by reperfusion were analyzed by in situ hybridization. B: Cardiomyocytes isolated from newborn rats were incubated with cyanide and deoxyglucose followed by the removal of these metabolic inhibitors. ATF3 and GAPDH mRNA levels were analyzed by RT-PCR. I/R, ischemia-reperfusion; RT, reverse transcriptase.
Generation of Transgenic Mice Ectopically Expressing ATF3 in the Heart
To investigate the significance of ATF3 induction by cardiac stress, we took a gain-of-function approach and generated transgenic mice expressing ATF3 using the α-myosin heavy chain (α-MyHC) promoter. The transgenic construct contains the human ATF3 open reading frame and the SV40 polyA signal (Figure 2A) ▶ . For the convenience of discussion, we will refer to these mice as MyHC-ATF3 mice in the rest of the report. The 5-kb fragment of the MyHC promoter used in this experiment has been demonstrated to drive the expression of transgenes as follows: in atria and in striated muscle surrounding pulmonary veins constitutively starting at embryonic day 10 (e10), and in the ventricles constitutively starting 12 hours before birth. 23,24 Thus far, we have generated five transgenic founders. Postmortem analyses showed that they can be divided into two groups: group I (no. 83, no. 85, and no. 92) with dramatically enlarged atria, and group II (no. 89 and no. 100) with mildly enlarged hearts. Only founders no. 85 and no. 100 gave rise to transgenic progeny before death. RT-PCR analysis using primers specific to ATF3 and the SV40 polyA region showed a specific band of the expected size from RNA isolated from no. 85 (TG1) hearts (Figure 2B) ▶ . In contrast to the easily detectable signal from no. 85 mice, the signal from no. 100 (TG2) mice was faintly visible. Although the assay was not quantitative, the difference in the signal level was dramatic and reproducible, suggesting that the expression level of the transgene was lower in no. 100 mice than that in no. 85 mice. Consistent with this interpretation, the phenotypes in no. 100 mice were much weaker than that in no. 85 mice (see below). In the rest of this report, we will refer to no. 85 mice as TG1 and no. 100 mice as TG2.
Figure 2.
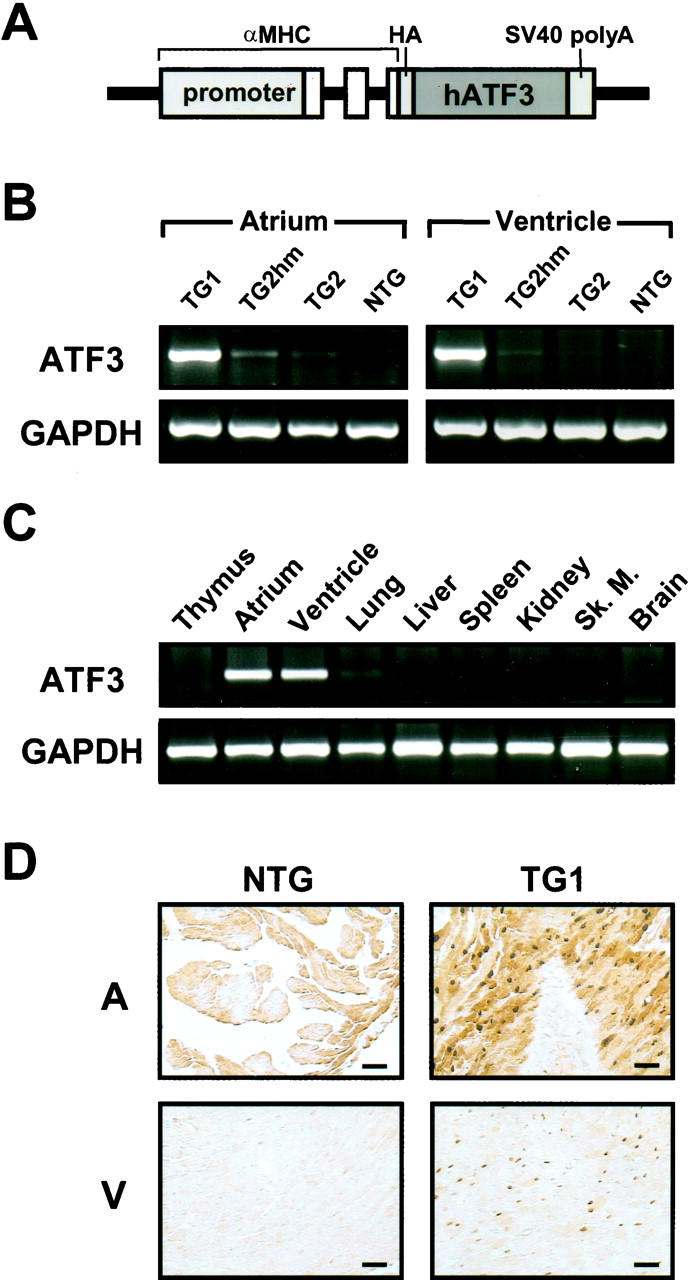
MyHC-ATF3 transgenic mice express the transgene in the heart. A: A schematic of the MyHC-ATF3 construct. Open boxes indicate noncoding exons of the α-MyHC gene. HA, hemagglutinin tag. B: Atrial and ventricular total RNAs were isolated from NTG, no. 85 heterozygous (TG1), no. 100 heterozygous (TG2), and no. 100 homozygous (TG2hm) mice. ATF3 and GAPDH mRNA levels were assayed by RT-PCR. C: Indicated tissues from TG1 mice were analyzed as in B. D: Atrial and ventricular sections derived from TG1 mice were analyzed by immunohistochemistry using antibodies against ATF3. A, atrium; V, ventricle. Scale bar, 50 μm.
Despite the easy detection of the ATF3 expression in TG1 by RT-PCR, we consistently failed to detect it by in situ hybridization (data not shown), a technique we used to detect the induction of endogenous ATF3 by ischemia-reperfusion. This suggests that the level of transgene expression in TG1 is lower than that of endogenous ATF3 induced by ischemia-reperfusion. This relatively low expression of the transgene argues against the interpretation that the cardiac dysfunction we describe below was because of a nonspecific effect of overexpressing any foreign protein in the heart. The tissue specificity of transgene expression in TG1 was demonstrated by the lack of transgene expression in thymus, liver, spleen, kidney, skeletal muscle, and brain (Figure 2C) ▶ . The slight expression in the lung is consistent with a previous report that the promoter is active in pulmonary veins. 23 Immunohistochemistry using antibodies against ATF3 confirmed that ATF3 protein is produced in the transgenic heart (Figure 2D) ▶ .
Bi-Atrial Enlargement, Cardiac Hypertrophy, and Dilation
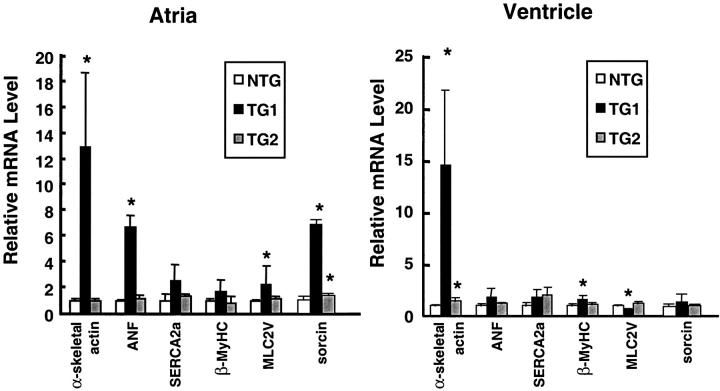
The TG1 mice showed obvious bi-atrial enlargement starting at 3 weeks of age, with a consistently greater enlargement of the right atrium than the left atrium. Figure 3A ▶ shows a representative picture. The reason for the difference between the left and right atria is not clear at present. Because bi-atrial enlargement was observed in three founders (no. 83, no. 85, and no. 92), it strongly suggests that this phenotype was because of the expression of the transgene rather than the sites of integration. Consistent with atrial enlargement, transgenic mice showed a dramatic increase in the heart-to-body weight ratio (data not shown). The majority of the weight increase was because of the increase in atrial weight as shown in Table 1 ▶ . The increase in ventricular weight was small, but statistically significant. This increase in heart weight is suggestive of cardiac hypertrophy. Therefore, we compared the transgenic hearts with nontransgenic (NTG) hearts by quantitative RNA dot-blot analysis for altered steady-state mRNA levels indicative of a hypertrophic response. As shown in Figure 4 ▶ , in mice at 15 to 20 weeks of age, α-skeletal actin was up-regulated in the ventricles of both transgenic lines (TG1 versus NTG), 1460 ± 72 versus 100 ± 18, P = 0.002; TG2 versus NTG, 149 ± 33 versus 100 ± 18, P = 0.007), and in the atria of TG1 mice (1300 ± 56 versus 100 ± 23, P = 0.0051). Atrial natriuretic factor, although not significantly up-regulated in the ventricles of either line, was up-regulated in the aria of TG1 mice (680 ± 87 versus 100 ± 10, P = 0.00001). β-MyHC was significantly up-regulated in the ventricles of TG1 mice (155 ± 51 versus 100 ± 25, P = 0.049). Up-regulation of these three markers (α-skeletal actin, atrial natriuretic factor, and β-MyHC) to varying extent is typical of cardiac hypertrophy in human cardiomyopathy and in various murine models of cardiac hypertrophy. Therefore, these results indicate a significant hypertrophic response in TG1 hearts. Consistent with this notion, TG1 ventricles had significant down-regulation of myosin light chain 2 ventricular isoform (MLC2V) (63 ± 19 versus 100 ± 17, P = 0.0116), a down-regulation also observed in tissues from hypertrophic human hearts and in hypertrophic and hypertensive primate and rodent models. 25-28 SERCA2a, a marker of heart failure 29-31 was not significantly different in the ventricles or atria of either line. It is apparent from the literature that different patterns of dysregulation for hypertrophic markers characterize specific murine models; importantly, although some markers may not be up-regulated in specific models, an increase in α-skeletal actin is always observed. Therefore, taken together our dot-blot results indicate a relatively severe hypertrophic response in TG1 ventricles and atria, and a mild hypertrophic response in TG2 ventricles. This is in agreement with the observation of a significant increase in heart-to-body weight ratio in TG1 but not TG2 (Table 1) ▶ . Because of the large significant increase in both α-skeletal actin and atrial natriuretic factor in TG1 atria, it is possible that the bi-atrial enlargement represents an atrial hypertrophic response.
Figure 3.
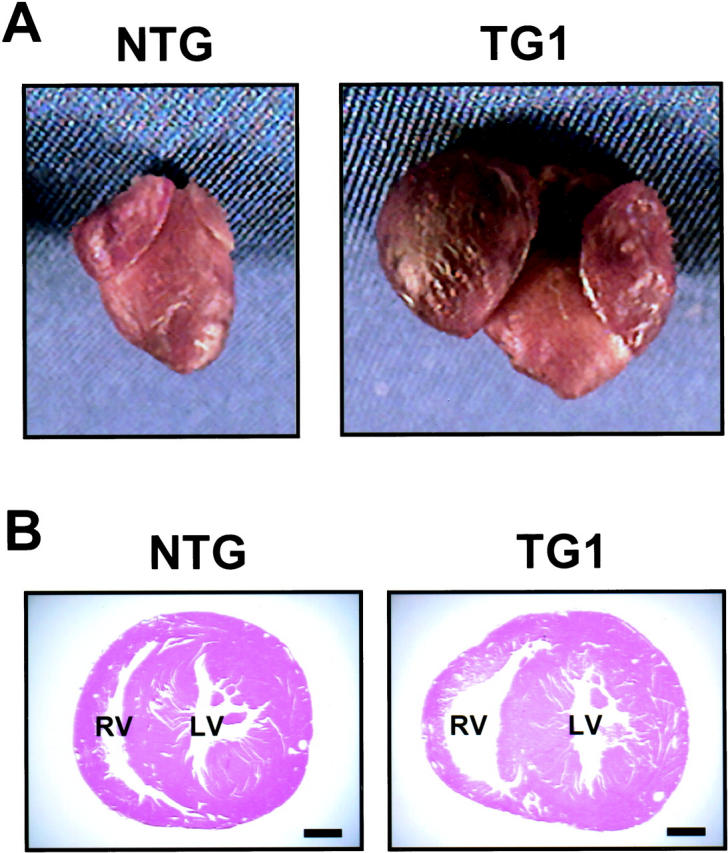
TG1 transgenic mice have enlarged atria and dilated right ventricles. A: Hearts were removed from NTG and TG1 mice at 20 weeks of age and photographed. B: Transverse sections of NTG and TG1 mice at 30 weeks of age were stained by H&E. RL, right ventricle; LV, left ventricle. Scale bar, 1 mm.
Table 1.
Morphometric Analysis of Mice
| NTG | TG1 | TG2 | |
|---|---|---|---|
| AW/BW | |||
| 6W | 0.477 ± 0.050 (n = 9) | 2.105 ± 0.562† (n = 7) | 0.543 ± 0.039 (n = 7) |
| 35W | 0.442 ± 0.045 (n = 6) | 2.434 ± 0.423† (n = 8) | 0.428 ± 0.053 (n = 7) |
| VW/BW | |||
| 6W | 3.838 ± 0.242 (n = 9) | 4.421 ± 0.293* (n = 7) | 3.872 ± 0.143 (n = 7) |
| 35W | 3.410 ± 0.373 (n = 6) | 4.145 ± 0.221* (n = 8) | 3.611 ± 0.365 (n = 7) |
Atrial weight (AW) or ventricular weight (VW) from NTG, TG1, TG2 mice at 6 weeks (6W) or 35 weeks (35W) of age was normalized to body weight (BW). Values are mean ± SE.
*P < 0.005 versus NTG.
†P < 0.0005 versus NTG.
Figure 4.
MyHC-ATF3 transgenic mice have increased gene expression indicative of hypertrophy. Total atrial and ventricular RNAs were isolated from NTG, TG1, and TG2 mice at 15 to 20 weeks of age, and analyzed by dot blot for the indicated mRNA. All assays were performed in duplicate, and individual signal intensities were normalized against GAPDH signals. Relative mRNA levels were calculated by arbitrarily defining the normalized signals from NTG hearts as 1. Data represent mean ± SD from multiple samples (NTG: 4 atria, 6 ventricles; TG1: 4 atria, 4 ventricles; TG2: 5 atria, 8 ventricles). *, P < 0.05 versus NTG.
In summary, these observations—macroscopic enlargement, relative heart weight increase, and altered gene expression—clearly demonstrate cardiac hypertrophy in TG1 mice. However, the hypertrophy was more obvious in the atria than in the ventricles. We speculate that this difference may be because of an earlier expression of the transgene in the atria than in the ventricle, because the MyHC promoter is active in the atria starting on embryonic day 10 but not active in the ventricles until shortly before birth. 23,24 In addition to hypertrophy, the TG1 transgenic mice showed dramatic atrial dilation (data not shown) and right ventricular dilation. Figure 3B ▶ shows a representative result from mice at 30 weeks of age. However, the left ventricle did not show obvious dilation. Although the reason for this difference is not clear, one possibility is that right ventricular dilation is a secondary effect of atrial dysfunction, thus reflecting the different degrees of atrial enlargement described above.
Myocyte Disarray, Degeneration, and Fibrosis
Because myocyte disarray is a cellular response that typically accompanies the development of hypertrophy, 20 we examined whether the transgenic hearts displayed myocyte disarray. As shown by H&E staining, at 30 weeks of age the TG1 atria were disorganized (Figure 5D) ▶ . This myocyte disarray was visible as early as 2 weeks of age (Figure 5, compare A and B ▶ ), but was more obvious in the atria than in the ventricles (data not shown), consistent with the greater atrial phenotypes described above. As evident in Figure 5, B and D ▶ , the transgenic hearts also showed karyomegaly, anisokaryosis, and abnormally shaped nuclei, indicative of myocyte degeneration and atrophy. 32 To further compare the structural differences between the TG1 mice and the NTG mice, we examined the myocytes by electron microscopy. Figure 6A ▶ shows three degenerating myocytes in the transgenic atria (derived from mice at 25 weeks of age) as diagramed in Figure 6C ▶ . Within the myocytes, many abnormal structures were evident, including disoriented myofibrils, degenerating mitochondria, abnormal Z-lines, vacuoles, granules, and degenerating intercalated disks. In addition, electron microscopy analysis showed large cells (consistent with the hypertrophy described above), variation in cell size, inclusion of abnormal material in the nuclei, and accumulations of dense material in the cytoplasm (data not shown). All these are indications of myocyte degeneration, and are in contrast to the normal myocytes from NTG mice, where well-organized myofibrils and Z lines were evident (Figure 6B) ▶ . Because another feature of heart failure is fibrosis of the heart wall, we performed Masson’s trichrome staining. As shown in Figure 5F ▶ , at 20 weeks of age, the TG1 mice had excess interstitial collagen (blue stain) in the atria, indicating extensive fibrosis. The extent of fibrosis in the ventricles was much lower (data not shown), again consistent with the less severe ventricular phenotypes described above. In summary, microscopic examination indicated that the myocytes were degenerating and the hearts fibrotic in the TG1 transgenic mice. We also performed all of the analyses on TG2 mice and did not find any obvious microscopic abnormalities (data not shown).
Figure 5.
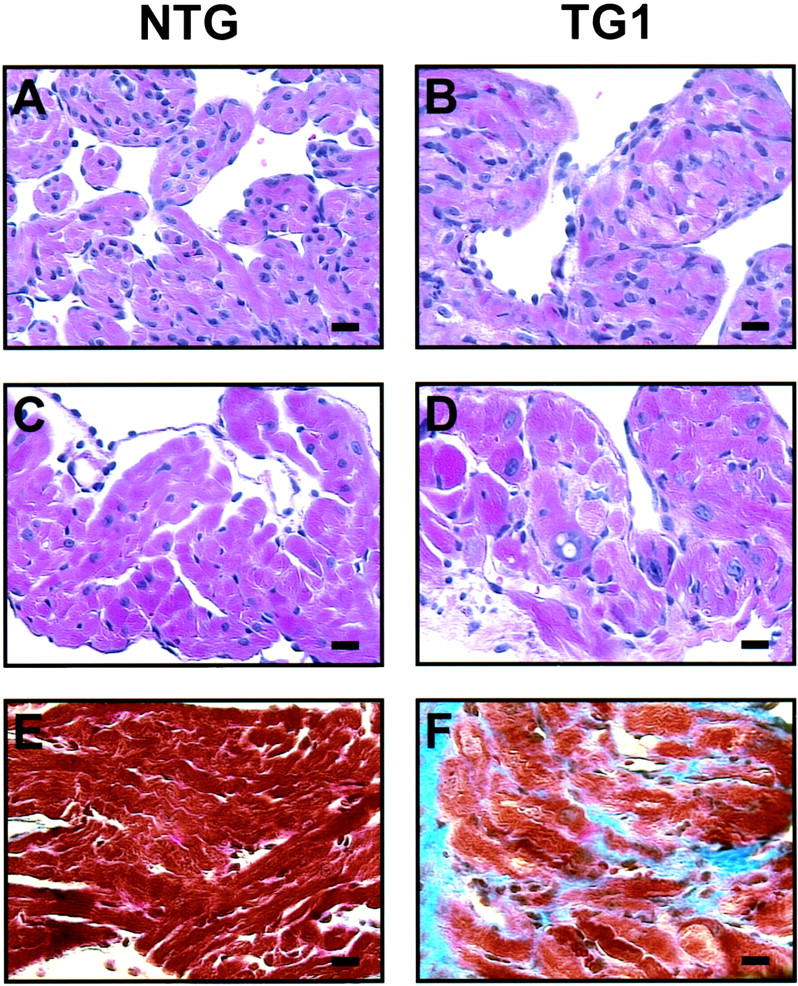
Histological analyses indicate myocyte disarray and fibrosis in TG1 hearts. A–D: Atrial sections from NTG and TG1 mice at 2 weeks of age (A and B), or 30 weeks of age (C and D) were stained by H&E. E and F: Atrial sections from NTG and TG1 mice at 20 weeks of age were stained by Mason trichrome. Scale bar, 20 μm.
Figure 6.
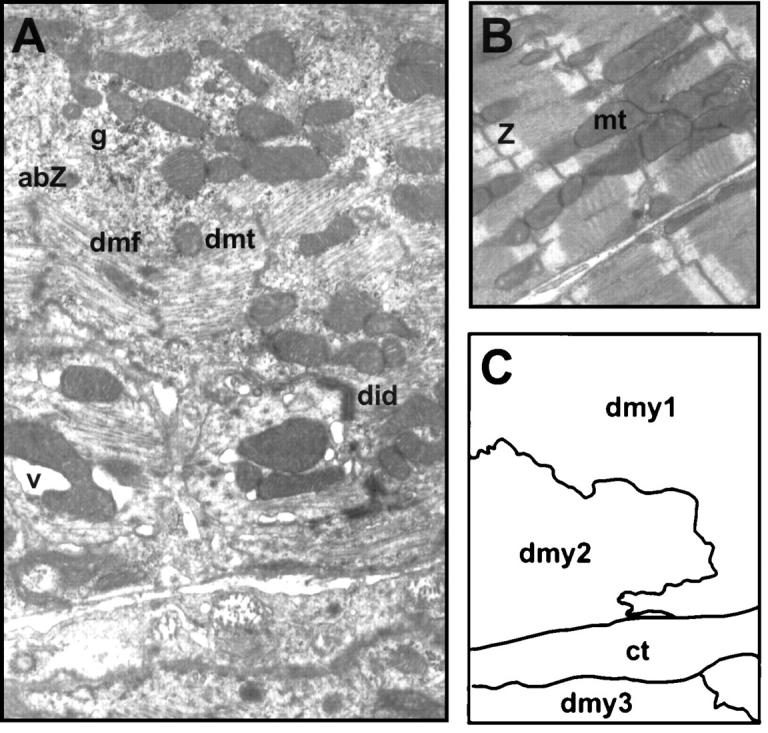
Ultrastructural analyses indicate myocyte degeneration in TG1 hearts. A and B: Atria from TG1 and NTG mice at 25 weeks of age were analyzed by electron microscopy [original magnifications: ×10,000 (A) and ×7000 (B)]. C: A schematic diagram delineates three myocytes shown in A. abZ, abnormal Z-line; ct, connective tissue; dmf, disoriented myofibril; dmt, degenerative mitochondria; did, degenerating intercalated disks; dmy, degenerating myocytes; g, granule; mt, mitochondria; v, vacuole; Z, Z-line.
Ventricular Contractile Dysfunction
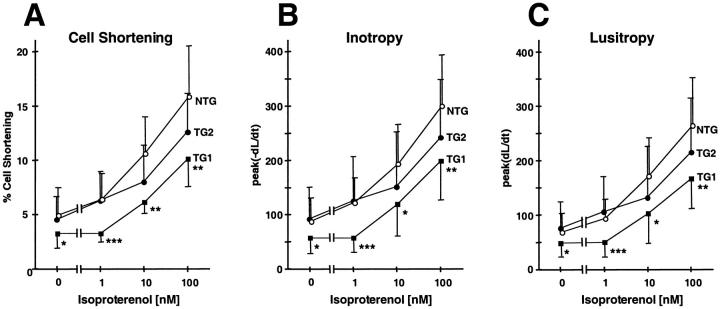
The findings described for TG1 are consistent with a nonspecific cardiomyopathy likely to be associated with ventricular dysfunction. To examine the ventricular function, we performed echocardiographic analyses. Consistent with Figure 3A ▶ , the echocardiographic images showed enlarged atria; in addition, they showed an apparent rotation of heart in vivo (data not shown). These structural and positional changes blocked the clear resolution of left ventricular wall motion for further analysis. Therefore, we performed an in vitro assay to assess the contractile function of the cardiomyocytes. We isolated ventricular cardiomyocytes from mice at 15 to 20 weeks of age, and measured their isotonic shortening after stimulation in the electrical field. As shown in Figure 7A ▶ , myocytes derived from TG1 mice showed a statistically significant reduction in percent cell shortening when compared to myocytes from NTG mice. The reduction was observed either in the absence or presence of the β-agonist isoproterenol. In addition, the rate of contraction (inotropy) and the rate of relaxation (lusitropy) were significantly slower in TG1 than in NTG mice either in the absence or presence of isoproterenol (Figure 7, B and C) ▶ . Taken together, these results indicate that the TG1 transgenic myocytes were less contractile and less responsive to β-adrenergic receptor stimulation, a finding consistent with cardiomyopathy.
Figure 7.
Cardiomyocytes derived from MyHC-ATF3 transgenic ventricles have decreased contractile function. Ventricular cardiomyocytes were isolated from NTG, TG1, or TG2 mice at 15 to 20 weeks of age. Their percentage of cell shortening, lusitropy, and inotropy were measured after stimulation in the electrical field in the absence or presence of isoproterenol. Percent of cell shortening = (L0 − Li)/L0, where L0 is the length of resting cells and Li is the length of the electrically stimulated cells. There was no statistically significant difference in the resting cell length between TG and NTG cells: NTG 104 ± 3 μm (n = 26), TG1 101 ± 5 μm (n = 24), TG2 109 ± 4 μm (n = 28). Data represent mean ± SD from 11 to 28 cells derived from five to seven mice. *, P < 0.05 versus NTG; **, P < 0.005 versus NTG; ***, P < 0.0005 versus NTG.
We also examined the TG2 myocytes by these analyses. Echocardiographic analyses of mice from 6 weeks to 30 weeks of age in a longitudinal study showed statistically significant reductions in left ventricular contractile performance, as evidenced by ∼10% reduction in fractional shortening and 15% reduction in stroke volume when compared to NTG mice (Figure 8) ▶ . Using similar methods, we demonstrated recently that severe left ventricular failure in mice (doxorubicin-induced cardiomyopathy) is associated with ∼30 to 35% reductions in fractional shortening and stroke volume relative to corresponding control values. 18 Therefore, the reductions observed in TG2 mice indicate that they had a moderate decrease in left ventricular contractile performance. This moderate decrease is consistent with the mild phenotypes in the TG2 mice described above. M-mode images of the echocardiographic analyses also demonstrated increased left ventricular internal dimension during systole in transgenic animals versus age matched controls (1.83 ± 0.04 mm at 14 weeks and 1.73 ± 0.08 mm at 22 weeks, versus 1.58 ± 0.02 mm control, P < 0.05). No change in diastolic dimension was observed. In vitro analysis of the myocytes indicated that they had reduced cell shortening, inotropy, and lusitropy (Figure 7) ▶ . However, the reduction was apparent only at high concentrations of isoproterenol; in the absence of isoproterenol, there was no significant reduction. Because the echocardiographic analysis that showed a statistically significant reduction in fractional shortening was performed in the absence of isoproterenol, this suggests that the in vivo echocardiographic analysis is more sensitive for detecting ventricular dysfunction than the in vitro cell-shortening assay.
Figure 8.
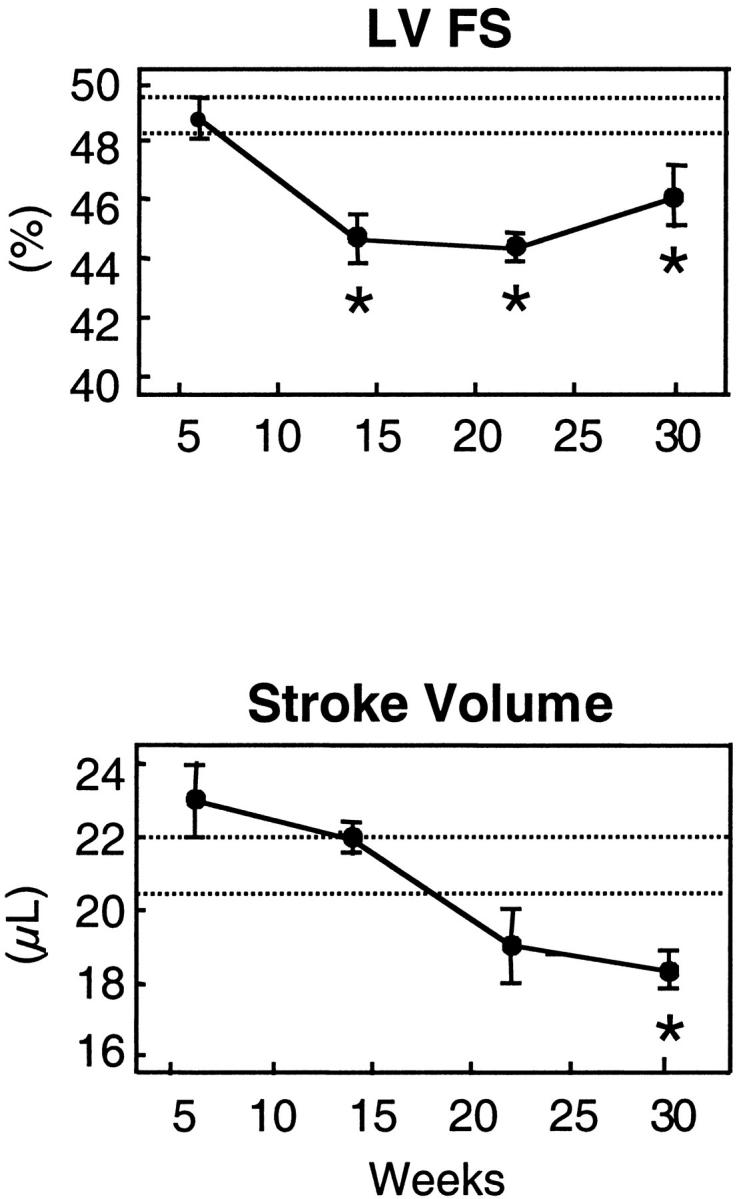
TG2 transgenic mice have time-dependent cardiac performance deficits. NTG and TG2 mice were examined by echocardiographic analyses in a longitudinal manner from 6 weeks to 30 weeks of age. Data represent means ± SE for transgenic mice (n = 8 to 12) and NTG mice (n = 10 to 15). Dotted lines represent 95% confidence intervals for age-matched NTG mice that did not show any significant age dependencies. *, P < 0.05 TG versus NTG.
Conduction Abnormalities
The gross hypertrophy and structural degeneration of atria in TG1 mice prompted us to examine the mice by electrocardiography. We examined mice at ∼6 weeks or 20 weeks of age (Table 2) ▶ . In many of the recordings, the QRS and the T wave were not discrete. Therefore, the QRS duration is not reported. The NTG controls had an age-dependent reduction in the PR interval. This is in contrast to the age-related increase in PR interval reported previously in wild-type 129SvEv inbred mice. 33 The difference may be because of differences in age, strain, or anesthetic regimen. In the young animals (∼6 weeks of age), there were no statistically significant differences between transgenic and NTG animals with respect to any ECG intervals. In the older animals (∼20 weeks of age), there were significant differences between the transgenic and NTG animals in both heart rate and the QT interval. However, the rate-corrected QT interval (QTc) was not significantly different. In addition, two of the five older transgenic animals demonstrated sinus rhythm with Wenckebach periodicity (data not shown), indicating altered atrioventricular node conduction. In summary, the transgenic mice have ECG changes consistent with the increased fibrosis and fiber disarray or altered autonomic balance, a potential consequence of the pathology described above.
Table 2.
Electrophyiological Analysis of Mice
| Age 6 weeks | 20 weeks | |||
|---|---|---|---|---|
| Genotype | NTG (n = 3) | TG1 (n = 6) | NTG (n = 6) | TG1 (n = 5) |
| Heart Rate (bpm) | 525 ± 76 | 466 ± 81 | 498 ± 43 | 650 ± 76† |
| PR (msec) | 34.8 ± 4.2 | 32.2 ± 3.6 | 25.8 ± 5.0* | 33.1 ± 5.4 |
| QT (msec) | 64.3 ± 5.6 | 66.2 ± 6.7 | 62.9 ± 4.0 | 49.7 ± 10.6‡ |
| QTc (msec) | 132 ± 17.5 | 132 ± 19.5 | 127 ± 8.5 | 110 ± 19.9 |
ECG intervals for NTG, TG1, and TG2 at indicated age are tabulated. Values are mean ± SE.
*, Reduced compared to 6-week-old NTG mice (P < 0.05).
†, Increased compared to all other groups (P < 0.05).
‡, Reduced compared to all other groups (P < 0.05).
Decrease in Cardiac Functional Capacity
To examine whether the transgenic mice have a diminished cardiac functional capacity, we examined the mice during exercise. We trained six TG1 and six NTG mice at 8 weeks of age to swim as detailed in the Material and Methods. All six NTG mice tolerated the exercise protocol and resumed normal activity immediately after swimming. However, five of the six transgenic mice displayed obvious struggle during swimming and recovered to normal activity slowly afterward. Two transgenic mice were drowning and required rescue in two swimming sessions. One mouse died soon after rescue 12 days into the protocol. Therefore, the transgenic mice had less functional capacity than the NTG mice, consistent with their cardiac contractile dysfunction and conduction abnormalities.
Altered Expression and a Potential Role of ATF3 in G-Protein Signaling
Interestingly, expression of sorcin, a gene whose product inhibits the release of calcium from sarcoplasmic reticulum, 34-36 was increased in these transgenic hearts. We examined sorcin, because it was identified in a DNA microarray screen in cultured cells ectopically expressing ATF3 (A. E. Allen-Jennings, L. Gang, K. L. Gardner, and T. Hai, unpublished results). As shown by quantitative dot-blot analysis, sorcin mRNA was significantly higher in TG1 than NTG atria (Figure 4) ▶ . Because calcium release from sarcoplasmic reticulum plays a pivotal role in cardiac function, the increased expression of sorcin, an inhibitor of this process, may contribute to the cardiac dysfunction observed in the transgenic mice. Recently, Redfern and colleagues 37 generated transgenic mice expressing a modified Gi-coupled receptor (Ro1) in the heart in an inducible manner. They showed elegantly that expression of Ro1 causes ventricular conduction delay and a lethal cardiomyopathy. 37 Intriguingly, ATF3 was identified in their study as a gene up-regulated in the transgenic hearts by a DNA array analysis, suggesting a role for ATF3 in G-protein signaling. 37
The Role of ATF3 in Cardiac Stress Response
As described in the Introduction, ATF3 is a member of the CREB/ATF family of transcription factors. Because these transcription factors are involved in the regulation of a variety of genes, they have been used as a paradigm for studying regulation of gene expression by many investigators. CREB, a widely studied member of this family, was implicated to play a role in the heart. When a dominant-negative form of CREB was expressed in the heart, mice carrying this transgene developed four-chamber dilated cardiomyopathy. 38,39 Because the dominant-negative form of CREB interferes with the normal function of CREB, these results indicate that CREB is important for some normal functions of the heart. Our work suggests that another member of this family, ATF3, may also play a role in the heart, although most likely a role different from that of CREB. Because ATF3 is not detectable in the heart under nonstressed conditions, we suspect that it does not play a role in cardiac function under normal conditions. However, it plays a role in cardiac stress response, because it is induced in the heart by stressors such as myocardial ischemia-reperfusion.
The phenotypes we observed in the MyHC-ATF3 transgenic mice suggest that ATF3 is a detrimental stress-inducible gene. This notion is consistent with our preliminary results suggesting that stress signals may induce ATF3 by activating the JNK/SAPK and p38 stress kinases (J. Chen and T. Hai, unpublished results). Activation of these stress kinases in cardiomyocytes has been implicated to lead to detrimental effects. 40-42 If ATF3 is indeed a downstream target gene for the JNK/SAPK and p38 signaling pathways, it may be one of the mediators for the stress pathways to elicit detrimental effects. In summary, our results are consistent with the interpretation that expression of ATF3 in the heart leads to cardiac dysfunction. Because ATF3 is a stress-inducible gene, our results may help to understand the roles of gene regulation in stress-associated cardiac diseases.
Acknowledgments
We thank J. Robbins for the α-MyHC vector; G. Liang and D. Marsee for their initial participation in the project; A. E. Allen-Jennings for performing the immunohistochemistry experiment; R. Gottlieb, H. He, R. Kitsis, and L. Castillo for advice and protocols on the preparation of cardiomyocytes; and Dr. J. Parker-Thomburg at the KECK Genetic Research Facility, Ohio State University for generating the MyHC-ATF3 mice.
Footnotes
Address reprint requests to Tsonwin Hai, Room 148, Rightmire Hall, 1060 Carmack Rd., Ohio State University, Columbus, OH 43210. E-mail: hai.2@osu.edu.
Supported by grants RO1 ES08690 from the Central Ohio Cancer Research (to T. H.), and RO1 HL59791 (to J. B.), and the Ohio State University Post-Doctoral Fellowship (to Y. O.).
References
- 1.Francis GS, McDonald K, Chu C, Cohn JN: Pathophysiologic aspects of end-stage heart failure. Am J Cardiol 1995, 75:11A-16A [DOI] [PubMed] [Google Scholar]
- 2.Cooper G, IV: Basic determinants of myocardial hypertrophy: a review of molecular mechanisms. Annu Rev Med 1997, 48:13-23 [DOI] [PubMed] [Google Scholar]
- 3.Meyer TE, Habener JF: Cyclic adenosine 3′, 5′-monophosphate response element binding protein (CREB) and related transcription-activating deoxyribonucleic acid-binding proteins. Endocr Rev 1993, 14:269-290 [DOI] [PubMed] [Google Scholar]
- 4.Brindle PK, Montminy MR: The CREB family of transcription activators. Curr Opin Genet Dev 1992, 2:199-204 [DOI] [PubMed] [Google Scholar]
- 5.Ziff EB: Transcription factors: a new family gathers at the cAMP response site. Trends Genet 1990, 6:69-72 [DOI] [PubMed] [Google Scholar]
- 6.Sassone-Corsi P: Goals for signal transduction pathways: linking up with transcriptional regulation. EMBO J 1994, 13:4717-4728 [DOI] [PMC free article] [PubMed] [Google Scholar]
- 7.Hai T, Wolfgang CD, Marsee DK, Allen AE, Sivaprasad U: ATF3 and stress responses. Gene Express 1999, 7:321-335 [PMC free article] [PubMed] [Google Scholar]
- 8.Hai T, Hartman MG: The molecular biology and nomenclature of the ATF/CREB family of transcription factors: ATF proteins and homeostasis. Gene, 2001 (in press) [DOI] [PubMed]
- 9.Chen BPC, Wolfgang CD, Hai T: Analysis of ATF3: a transcription factor induced by physiological stresses and modulated by gadd153/Chop10. Mol Cell Biol 1996, 16:1157-1168 [DOI] [PMC free article] [PubMed] [Google Scholar]
- 10.Yin T, Sandhu G, Wolfgang CD, Burrier A, Webb RL, Rigel DF, Hai T, Whelan J: Tissue-specific pattern of stress kinase activation in ischemic/reperfused heart and kidney. J Biol Chem 1997, 272:19943-19950 [DOI] [PubMed] [Google Scholar]
- 11.Drysdale B-E, Howard DL, Johnson RJ: Identification of a lipopolysaccharide inducible transcription factor in murine macrophages. Mol Immunol 1996, 33:989-998 [DOI] [PubMed] [Google Scholar]
- 12.Farber JM: A collection of mRNA species that are inducible in the RAW 264.7 mouse macrophage cell line by γ-interferon and other agents. Mol Cell Biol 1992, 12:1535-1545 [DOI] [PMC free article] [PubMed] [Google Scholar]
- 13.Amundson SA, Bittner M, Chen Y, Trent J, Meltzer P, Fornace AJ, Jr: Fluorescent cDNA microarray hybridization reveals complexity and heterogeneity of cellular genotoxic stress responses. Oncogene 1999, 18:3666-3672 [DOI] [PubMed] [Google Scholar]
- 14.Liang G, Wolfgang CD, Chen BPC, Chen TH, Hai T: ATF3 gene: genome organization, promoter and regulation. J Biol Chem 1996, 271:1695-1701 [DOI] [PubMed] [Google Scholar]
- 15.Weir E, Chen Q, DeFrances MC, Bell A, Taub R, Zarnegar R: Rapid induction of mRNAs for liver regeneration factor and insulin-like growth factor binding protein-1 in primary cultures of rat hepatocytes by hepatocyte growth factor and epidermal growth factor. Hepatology 1994, 20:955-960 [DOI] [PubMed] [Google Scholar]
- 16.Karwatowska-Prokopczuk E, Nordberg JA, Li HL, Engler RL, Gottlieb RA: Effect of vacuolar proton ATPase on pHi, Ca2+, and apoptosis in neonatal cardiomyocytes during metabolic inhibition/recovery. Circ Res 1998, 82:1139-1144 [DOI] [PubMed] [Google Scholar]
- 17.Yamaguchi M, Robson RM, Stromer MH: Evidence for actin involvement in cardiac Z-lines and Z-line analogues. J Cell Biol 1983, 96:435-442 [DOI] [PMC free article] [PubMed] [Google Scholar]
- 18.Weinstein DM, Mihm MJ, Bauer JA: Cardiac peroxynitrite formation and left ventricular dysfunction following doxorubicin treatment in mice. J Pharmacol Exp Ther 2000, 294:396-401 [PubMed] [Google Scholar]
- 19.Hohl CM, Livingston B, Hensley J, Altschuld RA: Calcium handling by sarcoplasmic reticulum of neonatal swine cardiac myocytes. Am J Physiol 1997, 273:H192-H199 [DOI] [PubMed] [Google Scholar]
- 20.Geisterfer-Lowrance AAT, Christe M, Conner DA, Ingwall JS, Schoen FJ, Seidman CE, Seidman JG: A mouse model of familial hypertrophic cardiomyopathy. Science 1996, 272:731-734 [DOI] [PubMed] [Google Scholar]
- 21.Webster KA, Discher DJ, Bishopric NH: Induction and nuclear accumulation of fos and jun proto-oncogenes in hypoxic cardiac myocytes. J Biol Chem 1993, 268:16852-16858 [PubMed] [Google Scholar]
- 22.Yao A, Takahashi T, Aoyagi T, Kinugawa K, Kohmoto O, Sugiura S, Serizawa T: Immediate-early gene induction and MAP kinase activation during recovery from metabolic inhibition in cultured cardiac myocytes. J Clin Invest 1995, 96:69-77 [DOI] [PMC free article] [PubMed] [Google Scholar]
- 23.Subramaniam A, Jones WK, Gulick J, Wert S, Neumann J, Robbins J: Tissue-specific regulation of the α-myosin heavy chain gene promoter in transgenic mice. J Biol Chem 1991, 266:24613-24620 [PubMed] [Google Scholar]
- 24.Jones WK, Sanchez A, Robbins J: Murine pulmonary myocardium: developmental analysis of cardiac gene expression. Dev Dyn 1994, 200:117-128 [DOI] [PubMed] [Google Scholar]
- 25.Kumar C, Saidapet C, Delaney P, Mendola C, Siddiqui MA: Expression of ventricular-type myosin light chain messenger RNA in spontaneously hypertensive rat atria. Circ Res 1988, 62:1093-1097 [DOI] [PubMed] [Google Scholar]
- 26.Zahringer J, Klaubert A, Pritzl N, Stangl E, Kreuzer E: Gene expression in cardiac hypertrophy in rat and human heart muscle. Eur Heart J 1984, 5(Suppl F):S199-S210 [DOI] [PubMed] [Google Scholar]
- 27.Chien KR, Knowlton KU, Zhu H, Chien S: Regulation of cardiac gene expression during myocardial growth and hypertrophy: molecular studies of an adaptive physiologic response. FASEB J 1991, 5:3037-3046 [DOI] [PubMed] [Google Scholar]
- 28.Henkel RD, Kammerer CM, Escobedo LV, VandeBerg JL, Walsh RA: Correlated expression of atrial myosin heavy chain and regulatory light chain isoforms with pressure overload hypertrophy in the non-human primate. Cardiovasc Res 1993, 27:416-422 [DOI] [PubMed] [Google Scholar]
- 29.LekanneDeprez RH, van den Hoff MJ, de Boer PA, Ruijter PM, Maas AA, Chamuleau RA, Lamers WH, Moorman AF: Changing patterns of gene expression in the pulmonary trunk-banded rat heart. J Mol Cell Cardiol 1998, 30:1877-1888 [DOI] [PubMed] [Google Scholar]
- 30.Aoyagi T, Yonekura K, Eto Y, Matsumoto A, Yokoyama I, Sugiura S, Momomura S, Hirata Y, Baker DL, Periasamy M: The sarcoplasmic reticulum Ca2+-ATPase (SERCA2) gene promoter activity is decreased in response to severe left ventricular pressure-overload hypertrophy in rat hearts. J Mol Cell Cardiol 1999, 31:919-926 [DOI] [PubMed] [Google Scholar]
- 31.Linck B, Boknik P, Eschenhagen T, Muller FU, Neumann J, Nose M, Jones LR, Schmitz W, Scholz H: Messenger RNA expression and immunological quantification of phospholamban and SR-Ca(2+)-ATPase in failing and nonfailing human hearts. Cardiovasc Res 1996, 31:625-632 [PubMed] [Google Scholar]
- 32.Iwase M, Bishop SP, Uechi M, Vatner DE, Shannon RP, Kudej RK, Wight DC, Wagner TE, Ishikawa Y, Homcy CJ, Vatner SF: Adverse effects of chronic endogenous sympathetic drive induced by cardiac Gs overexpression. Circ Res 1996, 78:517-524 [DOI] [PubMed] [Google Scholar]
- 33.Maguire CT, Bevilacqua LM, Wakimoto H, Gehrmann J, Berul CI: Maturational atrioventricular nodal physiology in the mouse. J Cardiovasc Electrophysiol 2000, 11:557-564 [DOI] [PubMed] [Google Scholar]
- 34.Lokuta AJ, Meyers MB, Sander PR, Fishman GI, Valdivia HH: Modulation of cardiac ryanodine receptors by sorcin. J Biol Chem 1997, 272:25333-25338 [DOI] [PubMed] [Google Scholar]
- 35.Meyers MB, Pickel VM, Sheu SS, Sharma VK, Scotto KW, Fishman GI: Association of sorcin with the cardiac ryanodine receptor. J Biol Chem 1995, 270:26411-26418 [DOI] [PubMed] [Google Scholar]
- 36.Valdivia HH: Modulation of intracellular Ca2+ levels in the heart by sorcin and FKBP12, two accessory proteins of ryanodine receptors. Trends Physiol 1998, 19:479-482 [DOI] [PubMed] [Google Scholar]
- 37.Redfern CH, Degtyarev MY, Kwa AT, Salomonis N, Cotte N, Nanevicz T, Fidelman N, Desai K, Vranizan K, Lee EK, Coward P, Shah N, Warrington JA, Fishman GI, Bernstein D, Baker AJ, Conklin BR: Conditional expression of a Gi-coupled receptor causes ventricular conduction delay and a lethal cardiomyopathy. Proc Natl Acad Sci USA 2000, 97:4826-4831 [DOI] [PMC free article] [PubMed] [Google Scholar]
- 38.Fentzke RC, Korcarz CE, Lang RM, Lin H, Leiden JM: Dilated cardiomyopathy in transgenic mice expressing a dominant-negative CREB transcription factor in the heart. J Clin Invest 1998, 101:2415-2426 [DOI] [PMC free article] [PubMed] [Google Scholar]
- 39.Leiden JM: The genetics of dilated cardiomyopathy: emerging clues to the puzzle. N Engl J Med 1997, 337:1080-1081 [DOI] [PubMed] [Google Scholar]
- 40.He H, Li HL, Lin A, Gottlieb RA: Activation of the JNK pathway is important for cardiomyocyte death in response to simulated ischemia. Cell Death Differ 1999, 6:987-991 [DOI] [PubMed] [Google Scholar]
- 41.Yue TL, Wang C, Gu JL, Ma XL, Kumar S, Lee JC, Feuerstein GZ, Thomas H, Maleeff B, Ohlstein EH: Inhibition of extracellular signal-regulated kinase enhances ischemia/reoxygenation-induced apoptosis in cultured cardiac myocytes and exaggerates reperfusion injury in isolated perfused heart. Circ Res 2000, 86:692-699 [DOI] [PubMed] [Google Scholar]
- 42.Turner NA, Xia F, Azhar G, Zhang X, Liu L, Wei JY: Oxidative stress induces DNA fragmentation and caspase activation via the c-Jun NH2-terminal kinase pathway in H9c2 cardiac muscle cells. J Mol Cell Cardiol 1998, 30:1789-1801 [DOI] [PubMed] [Google Scholar]
- 43.Jones WK, Grupp IL, Doetschman T, Grupp G, Osinska H, Hewett TE, Boivin G, Gulick J, Ng WA, Robbins J: Ablation of the murine myosin heavy chain gene leads to dosage effects and functional deficits in the heart. J Clin Invest 1996, 98:1906-1917 [DOI] [PMC free article] [PubMed] [Google Scholar]


