

Abstract
Previous research has established that naturally produced English clear speech is more intelligible than English conversational speech. The major goal of this paper was to establish the presence of the clear speech effect in production and perception of a language other than English, namely Croatian. A systematic investigation of the conversational-to-clear speech transformations across languages with different phonological properties (e.g., large versus small vowel inventory) can provide a window into the interaction of general auditory-perceptual and phonological, structural factors that contribute to the high intelligibility of clear speech. The results of this study showed that naturally produced clear speech is a distinct, listener-oriented, intelligibility-enhancing mode of speech production in both languages. Furthermore, the acoustic-phonetic features of the conversational-to-clear speech transformation revealed cross-language similarities in clear speech production strategies. In both languages, talkers exhibited a decrease in speaking rate and an increase in pitch range, as well as an expansion of the vowel space. Notably, the findings of this study showed equivalent vowel space expansion in English and Croatian clear speech, despite the difference in vowel inventory size across the two languages, suggesting that the extent of vowel contrast enhancement in hyperarticulated clear speech is independent of vowel inventory size.
I. INTRODUCTION
Talkers naturally and spontaneously adopt a distinct intelligibility-enhancing mode of speech production called “clear speech” when they are aware of a speech perception difficulty on the part of the listener due to background noise, a hearing impairment, or a different native language. It seems rather obvious that, in an attempt to make themselves more intelligible, most talkers will speak more slowly, more loudly, and in a more “exaggerated” manner, regardless of their language background. What is not so obvious is the extent to which the intelligibility-enhancing modifications that talkers adopt are driven by phonological, structural properties. In this paper, we report on a cross-linguistic study in which we test the hypothesis that clear speech production reflects the interaction of universal, auditory-perceptual factors, which serve to enhance the overall acoustic salience of the speech signal, and phonological, structural factors, which serve to enhance the acoustic “distance” between contrasting phonological categories.
A substantial body of previous work has provided us with important insights into the nature of high-intelligibility clear speech in English; however, there is a paucity of data on clear speech production and perception in any language other than English. Previous data on English clear speech perception have established that clear speech significantly, although to different degrees, enhances intelligibility for various listener populations, including normal-hearing and hearing-impaired adults, children with and without learning disabilities as well as non-native listeners, and under a variety of degraded listening conditions, including varying levels of noise and reverberation (Picheny et al., 1986; Payton et al., 1994; Uchanski et al., 1996; Bradlow and Bent, 2002; Bradlow et al., 2003; Ferguson, 2004). Regarding the articulatory modifications of naturally produced English clear speech, the accumulated results show that clear speech involves a wide range of acoustic/articulatory adjustments, including a decrease in speaking rate, which involves longer segments as well as more frequent and longer pauses, an increase in pitch range, greater sound-pressure levels, more salient stop releases, greater obstruent rms intensity, increased energy in the 1000–3000 Hz range of long-term spectra, and an expanded vowel space (Picheny et al., 1986, 1989; Krause and Braida, 2004; Bradlow et al., 2003; Liu et al., 2004; Moon and Lindblom, 1994; Ferguson and Kewley-Port, 2002; Johnson et al., 1993). However, the generalizability of these findings to clear speech production in other languages is unknown due to the lack of cross-linguistic clear speech research.
To our knowledge, there are only two studies of clear speech in languages other than English. Gagne and colleagues (2002) investigated the intelligibility of CV and VCV syllables in Canadian French clear and conversational speech in auditory, visual, and audiovisual modalities. Their results showed a clear speech intelligibility benefit in all three modalities; however, acoustic data for the two perceptually distinct speaking styles were not presented. Bradlow (2002) examined vowel production and CV coarticulation in clear and conversational speech in English and Spanish; however, the materials used in that study were rather limited (just high vowels, /i/ and /u/) and there were no accompanying intelligibility data that would show whether the clear speech intelligibility benefit was of similar magnitude in the two languages.
Given this almost exclusively monolingual focus of previous clear speech research, there is no direct evidence for the influence of phonological structure on clear speech production. Nevertheless, there are two independent sources of circumstantial evidence for the influence of phonological features on clear speech production. First, some of the acoustic-phonetic features of English clear speech are directly related to the sound structure of English. For example, Uchanski (1988, 1992) found that the duration contrast between tense/long and lax/short vowels was enhanced in English clear speech (by lengthening the tense/long vowels to a greater extent than the lax/short vowels). This finding suggests that the nonuniform increase in segment durations for clear speech reflects the temporal structure of the language at the segmental level. Similarly, Cutler and Butterfield (1990) found that preboundary syllable lengthening was exaggerated in clear speech relative to conversational speech, especially in cases where the preboundary syllable occurred before a word that began with a weak syllable. This suggests that clear speech production also reflects the temporal structure of the language at the suprasegmental level where the basic rhythmic structure of the language comes into play. The extra syllable lengthening before a word that begins with a weak/unstressed syllable makes the word boundary particularly salient in exactly the situation where the language-specific stress-group-based segmentation strategy will fail (Cutler et al., 1986; Cutler and Otake, 1994).
The second source of circumstantial evidence for a language-specific influence on clear speech production comes from studies of language-specific influences on slow-to-fast rate modifications, on adult-directed-to-infant-directed style modifications, and on broad versus narrow focus conditions. While these rate, style, and focus modifications differ from the conversational-to-clear speech transformation in that they are typically elicited in the laboratory with no explicit instruction to enhance intelligibility (and these studies usually do not include corresponding measures of intelligibility), they are similar to clear speech in that they involve a change from a relatively hypoarticulation style to a relatively hyperarticulation style (Lindblom, 1990). Solé (1992, 1995) found that in Spanish, vowels preceding nasal consonants are nasalized for approximately the same amount of time in an absolute sense across slow, normal, and fast speaking rates. In contrast, English vowels preceding nasal consonants are nasalized for approximately the same proportion of their total duration (virtually 100% of the vowel duration) across speaking rates. This difference is taken to reflect the different status of anticipatory vowel nasalization in the two languages: in Spanish, it is an unintended effect of constraints on vocal tract dynamics (the minimum amount of time for the velum to lower is constant regardless of speaking rate), whereas in English, vowels preceding nasals are intentionally nasalized by a process that adjusts to speaking rate variations. Similarly, a cross-linguistic comparison of infant- versus adult-directed speech demonstrated equivalent amounts of vowel space expansion for American English, Swedish, and Russian infant-directed speech relative to adult-directed speech (Kuhl et al., 1997). In contrast, Andruski, Kuhl, and Hayashi (1999) found dramatically reduced vowel space expansion for Japanese infant-directed speech. While it is difficult to determine whether this difference in vowel space expansion across Japanese and the other three languages reflects a property of the Japanese language, such as the relatively uncrowded vowel inventory (although note that Russian also has a relatively uncrowded vowel space and yet exhibited significant vowel space expansion for infant- versus adult-directed speech), or a property of the culture, such as a reduced tendency to use a distinct infant-directed style of speech, this finding suggests that the amount of vowel space expansion for hyperarticulated speaking styles may vary across languages.
Further evidence for a language-specific effect on vowel space expansion comes from a pair of studies aimed at testing predictions of the Theory of Adaptive Dispersion, which states that talkers seek to provide a sufficient degree of distinctiveness among contrasting categories while minimizing articulatory effort needed to achieve this distinctiveness (Lindblom 1986, 1990; Diehl and Lindblom 2002). Hay et al., (2003) and Coren and Heckmann (2004) tested the prediction that languages with large vowel inventories, such as English, French, and German, will exhibit greater vowel space expansion for words in narrow focus relative to the same words in broad focus than languages with small vowel inventories, such as, Japanese.1 The results supported their prediction, thereby providing additional evidence in favor of the claim that hyperarticulation in general is responsive to language-specific, phonological, structural properties. It is important to note, however, that none of these studies of hyperarticulation involves a mode of speech that is for the express purpose of enhancing intelligibility, nor do they present any accompanying intelligibility data which could help establish whether these hyperarticulations have any bearing on intelligibility.
Taken together then, the work on English clear speech production and cross-language studies of rate, speaking style, and focus variation suggest that the acoustic-phonetic features that characterize the conversational-to-clear speech transformation may vary across languages in a way that is related to language-specific phonological structure and patterns of phonetic implementation. However, only systematic cross-language comparisons of the conversational-to-clear speech transformation and its consequences for intelligibility would allow us to determine conclusively whether clear speech (i.e., global hyperarticulation for the express purpose of enhancing intelligibility) is or is not an English-specific phenomenon, and whether phonological contrast enhancement is likely to be a significant mechanism for the clear speech intelligibility benefit. To this end, we conducted a comparative study of Croatian and English clear speech. These two languages are well-suited for this comparison because of the structural differences between their phonologies. Although they are both Indo-European languages, they come from different language families (Slavic versus Germanic) and are typologically very different along multiple sound-based parameters. For example, in terms of rhythmic structure and phonotactics, English is stress timed, with complex consonant clusters in both onset and coda positions and extensive vowel reduction in unstressed syllables. In contrast, Croatian remains unclassified in terms of the three most common rhythm classes (stress-, syllable-, or mora-timed), since it allows complex consonant clusters in both onset and coda positions (like canonical stress-timed language), yet does not exhibit vowel quality reduction (i.e., centralization towards schwa) in unstressed syllables (like canonical syllable-timed languages). Most relevant for our investigation is that English has a large vowel inventory with 14 contrasting vowel quality categories, while Croatian has a relatively small vowel inventory with just 5 contrasting vowel quality categories.
In this paper, we set out to establish first, whether the clear speech effect is present in both production and perception of a language other than English, namely Croatian. That is, do talkers from both languages respond similarly to the instruction to “speak clearly for the sake of a listener with speech perception difficulties,” and if so, does the conversational versus clear speech mode difference in the two languages correlate with an intelligibility difference in both languages? The second goal of the present study is to perform a systematic acoustic-phonetic comparison of the conversational-to-clear speech mode transformation in the two languages. This comparison is based on productions of comparable materials by several talkers in each language who were recorded under comparable conditions, and focuses on global, signal enhancing modifications, including speaking rate and pitch range, and on phonological contrast enhancement as reflected in vowel space expansion. In this regard, we ask specifically whether the vowel space is expanded (equally) in both English and Croatian, languages with large (14) and small (5) vowel inventories, respectively. The results will allow us to identify the talker characteristics that likely contribute to the characteristically high intelligibility of clear speech in two unrelated languages, as well as to investigate the interaction of general auditory-perceptual and phonological factors in promoting the clear speech intelligibility benefit.
II. METHODS
A. Participants
1. Production
Five native talkers of Croatian (two female and three male) and five native talkers of English (three female and two male) served as participants in the production study. Age range was between 18 and 25 for Croatian talkers and between 28 and 48 for English talkers. Croatian talkers came to the United States from Croatia within the last 5 years to pursue undergraduate degrees at Northwestern University. They were all from the same region on the coast of Croatia. English talkers were graduate students in the Linguistics Department at Northwestern University. They were native talkers of general American English. None of the talkers had any known speech or hearing impairment at the time of recording. They were not aware of the purpose of the recordings. All participants were paid at the end of the recording session.
2. Perception
Twenty Croatian and 30 English listeners participated in Croatian and English sentence-in-noise perception tests, respectively. The Croatian listeners were undergraduate students in the English Department at the University of Zagreb, Croatia. The age of Croatian listeners ranged between 18 and 28 years. They were paid for their participation. Undergraduate students at Northwestern University received class credit for their participation in the English listening test. The English listeners’ ages ranged between 18 and 22 years. None of the listeners had any known speech or hearing impairment at the time of the test.
B. Stimuli
Twenty sentences were designed in each language to investigate the effect of clear speech production and perception in Croatian and English. In order to minimize the signal-independent contextual cues available to listeners in the perception tests, we constructed semantically anomalous sentences. The particular words used in these sentences were selected to allow for measurement of various specific phonological features of each language, such as duration of long versus short vowels in Croatian and of tense versus lax vowels in English, voice onset time, and vowel quality, etc., in both languages. In this paper, we focus on speaking rate, pitch range, and the vowel space characteristics. We will explore the effect of clear speech on other language-specific phonological contrasts in a future paper. Example sentences are given in (1) for each language. Keywords used for identification scores in the listening test are underlined.
-
(1)
-
Croatian: Nada æe dobiti tri dokaza i puni mjesec.
“Nada will get three proofs and a full moon.”
English: Peter and his chief ticket were hooded by their bed.
-
Croatian and English sentences were of similar length: the mean number of syllables was 12.8 (range 10–16) and 11.7 (range 9–14) in Croatian and English, respectively. Each sentence contained 4 keywords, giving a total of 80 keywords per set for scoring in the listening test. In order to ensure that the perception was not confounded by the listeners’ lack of familiarity with some words, the average familiarity rating of the English keywords used in the perception experiment was 6.87/7, ranging from 5.5 to 7. These familiarity ratings were taken from the Hoosier Mental Lexicon (Nusbaum et al., 1984). No parallel familiarity ratings were available for Croatian. However, all five native talkers were asked after the recording sessions if they thought any of the words were unusual or unfamiliar to them. They reported no such words. Therefore, we were confident that any possible differences in the results between the two languages could not be attributed to differences in the familiarity of the test words.
C. Procedure
1. Production
All English and Croatian talkers were recorded producing all 20 semantically anomalous sentences in their native language in a sound-attenuated booth in the phonetics laboratory in the Department of Linguistics at Northwestern University. The participants read the sentences, which were written on index cards, into a microphone directly to disk at 24-bit accuracy using an Apogee PSX-100 A/D D/A converter at a sampling rate of 16 kHz. Participants read 20 sentences in their native language once in conversational and once in clear speech. For the conversational style, the talkers were instructed to read as if they were talking to someone familiar with their voice and speech patterns. For the clear speaking style, the talkers were instructed to read as if they were talking to a listener with a hearing loss or a non-native speaker.2 Sentences were randomized for each reading. This yielded a total of 40 sentences per speaker and 200 per language. The acoustic analyses of the recorded sentences were done using PRAAT software for speech analysis (Boersma, 1996).
2. Perception
After the recordings were made, the digital speech files were segmented into sentence-length files. In order to obtain equivalent overall amplitude levels, all speech files were equated for rms amplitude and then mixed with broadband white noise at a 0 dB signal-to-noise ratio. The signal-to-noise ratio used in this study was chosen based on pilot testing. Each sentence was preceded by a 400 ms leading silence and a 500 ms noise interval, and followed by a 500 ms noise interval.
Each participant in the perception experiment heard a total of 20 sentences in their native language produced by only one of the talkers. Half of the sentences heard were in conversational style and half in clear style for each talker condition. The listeners never heard the same sentence twice. In each talker condition, clear speech sentences preceded conversational sentences so that any clear speech benefit obtained could not be explained by the subject’s adaptation to the task or to the talker’s speech patterns. Furthermore, the sentences were counterbalanced for style, i.e., for each talker the ten sentences that were presented in the conversational style in one condition (in which half of the listeners participated) were presented in the clear speaking style in another condition (in which the other half of the listeners participated). Four Croatian listeners per talker (20 altogether) and six English listeners per talker (30 altogether) participated in the experiment. English subjects were seated in front of a computer in a sound-attenuated booth in the phonetics laboratory in the Department of Linguistics at Northwestern University. Croatian subjects were tested in a quiet room in the English Department at the University of Zagreb. Stimulus presentation was controlled by SUPERLAB PRO 2.01. The audio files were played through the computer sound card over headphones at a comfortable listening level set by the experimenter before the start of the experiment. Three practice sentences (from a different talker) were presented first so that the subjects could get used to the nature of the stimuli mixed with noise and the procedure of advancing to the next trial. After each trial, the subject pressed the space bar on the keyboard to initiate the next trial. Each trial was presented only once but the duration of the pause between two trials was controlled by the subjects themselves. They could take as long as they needed to record their responses. The listeners were instructed to write down every word they heard. The experimenter left the room/booth after the practice sentences.
D. Data analysis
1. Production
In order to investigate what articulatory modifications talkers adopted in clear speech production, we performed a series of comparable acoustic analyses in both languages. Previous research has established that in English, clear speech involves a wide range of acoustic/articulatory adjustments, such as a decrease in speaking rate, an increase in pitch range, as well as an increase in the acoustic distance between vowels (Picheny et al., 1986; Moon and Lindblom, 1994; Johnson et al., 1993; Ferguson and Kewley-Port, 2002; Bradlow et al., 2003). Following these findings, the specific acoustic-phonetic parameters that we targeted in this analysis were speech rate (overall sentence duration and number and duration of pauses), pitch range (difference between the highest and lowest tonal targets in the sentence), and vowel space expansion. All the acoustic measurements were performed on the exact same sentences that were used in the sentence-in-noise perception tests, i.e., the comparisons were made between the conversational and clear speech styles for each talker.
2. Perception
Each participant in the sentence-in-noise perception test received a keyword-correct score out of 40 for the 10 sentences they heard in each style (conversational versus clear). We adopted a strict scoring criterion for both languages. A keyword was counted as correct only if all morphemes of the target word were present and transcribed correctly, e.g., if the target word was “keeping,” “keep, keeps, or kept” were scored as incorrect. Percentage-correct scores were calculated and then converted to rationalized arcsine transform units (RAU) (Studebaker, 1985). The transformed scores where then coded as RAU scores for 0 dB signal-to-noise ratio conversational style and for 0 dB signal-to-noise ratio clear style for each talker in each language. It has to be noted that the strict scoring criterion that we adopted might have penalized Croatian listeners more, since there are seven nominal cases and three grammatical genders in Croatian (in addition to two numbers) that often differ only in the word-final vowel. Therefore, the opportunity for transcribing a wrong affix was larger in Croatian. Nevertheless, we adhered to the strict scoring criterion as it was easy to apply consistently and objectively across both languages. Furthermore, our primary interest here was in clear versus conversational speech intelligibility within each language, rather than the absolute levels of intelligibility across the two languages.
III. RESULTS
A. Perception
The average sentence perception scores (in RAU) as well as the average intelligibility gain (as a difference between clear and conversational scores and as a proportional increase relative to the conversational score) for all English and Croatian talkers are given in Table I. The talkers in all tables are ordered by the amount of conversational-to-clear speech intelligibility gain as a proportion of the conversational intelligibility score (clear-conversational/ conversational). Letters E and C in talker labels stand for English and Croatian languages, respectively. The following F or M designates a female or male talker. The numbers refer to the recording order.
TABLE I.
The average sentence perception scores (RAU) for each talker in two speaking styles in English and Croatian. The talkers in this and all subsequent tables are ordered by the amount of conversational-to-clear speech intelligibility gain as a proportion of the conversational intelligibility score (clear-conversational/conversational).
| Intelligibility (RAU)
|
||||
|---|---|---|---|---|
| Talker | Conv. | Clear | Cl-Conv. | Diff (proportion conv.) |
| EF3 | 37.38 | 72.65 | 35.27 | 0.94 |
| EF2 | 41.72 | 59.83 | 18.11 | 0.43 |
| EF1 | 47.62 | 66.69 | 19.07 | 0.40 |
| EM2 | 46.09 | 59.43 | 13.35 | 0.29 |
| EM1 | 58.68 | 52.42 | −6.26 | −0.11 |
| Average | 46.30 | 62.20 | 15.91 | 0.39 |
| CM1 | 39.38 | 65.19 | 25.81 | 0.66 |
| CM2 | 52.34 | 77.57 | 25.23 | 0.48 |
| CM3 | 60.79 | 71.21 | 10.42 | 0.17 |
| CF2 | 53.50 | 61.23 | 7.73 | 0.14 |
| CF1 | 42.37 | 47.08 | 4.71 | 0.11 |
| Average | 49.68 | 64.46 | 14.78 | 0.31 |
As seen in the table, the effect of style is quite robust overall. That is, in both languages listeners performed better in the clear speech condition than in the conversational speech condition. This pattern was consistent for all talkers except for EM1. Talker EM1 already received the highest intelligibility score of all English talkers in conversational speech, and the clear speech modifications did not result in a further intelligibility gain. The results, furthermore, showed that there was substantial variability across the talkers, both in the level of intelligibility in conversational style and in the amount of benefit afforded by the clear speaking style. ANOVA results for the effect of language (English versus Croatian) and style (conversational versus clear) on RAU scores supported these impressions. There was a main effect of style [F(1,8) =14.611, p<0.01]. The effect of language and the language by style interaction were not significant. In summary, these results show that listeners recognized words more accurately in clear than in conversational speech in their native language. These findings expand our knowledge about clear speech by showing that the clear speech intelligibility effect is not specific to English.
B. Acoustic analyses: Global characteristics
1. Speaking rate
An increase in sentence duration typically accompanies the change in speaking style from conversational to clear (e.g., Picheny et al., 1986; Bradlow et al., 2003). It is not clear, however, how much or even whether speaking rate correlates with intelligibility. In studies of inter-talker variability in English conversational speech intelligibility, overall speaking rate either showed no correlation with overall intelligibility (Bradlow et al., 1996) or correlated with overall intelligibility for some but not all talkers (Hazan and Markham, 2004). Furthermore, Krause and Braida (2002) demonstrated that English clear speech can be produced at normal/conversational speaking rates with the concomitant intelligibility benefit. However, only a slight intelligibility benefit for hearing-impaired listeners was obtained from English clear speech at conversational speaking rates when compared with clear speech at slow speaking rates (Krause, 2001). These findings suggest that, while not crucial, the decrease in speaking rate typical of English clear speech production could be an important contributing factor to the intelligibility of clear speech. We also expect that any intelligibility benefit associated with a decrease in overall speaking rate for clear speech should be independent of the phonological structure of the language, and therefore should be similar across languages.
In order to assess the contribution of pause insertion and of individual segment lengthening to the difference in speaking rate for clear versus conversational speech, we counted the number of pauses and measured their duration. Next, we calculated the number of syllables produced per second after the pauses were excluded. A pause was defined as a period of silence of at least 5 ms in duration excluding silent periods before word-initial stop consonants where it would be impossible to determine the end of a pause and the beginning of the stop closure (similar to Bradlow et al., 2003). Table II shows speaking rate and pause results for all talkers in each speaking style.
TABLE II.
The total number of pauses, average pause duration (s), speaking rate (syll/s), and pitch range (semitones) results for each talker in two speaking styles in English and Croatian.
| # of pauses
|
Pause duration (s)
|
Speaking rate (syll/s)
|
Pitch range (semitones)
|
|||||||||||
|---|---|---|---|---|---|---|---|---|---|---|---|---|---|---|
| Talker | Conv. | Cl. | Diff. | Conv. | Cl. | Diff. | Conv. | Cl. | Cl-Con. | Diff. (prop. conv.) | Conv. | Cl. | Cl-Con. | Diff. (prop. conv.) |
| EF3 | 0 | 8 | 8 | 0 | 0.11 | 0.11 | 5.98 | 4.22 | −1.76 | 0.29 | 8.89 | 11.35 | 2.46 | 0.28 |
| EF2 | 0 | 3 | 3 | 0 | 0.05 | 0.05 | 5.43 | 4.21 | −1.22 | 0.22 | 12.06 | 13.34 | 1.28 | 0.11 |
| EF1 | 0 | 18 | 18 | 0 | 0.21 | 0.21 | 5.64 | 4.07 | −1.57 | 0.28 | 13.96 | 14.86 | 0.90 | 0.06 |
| EM2 | 0 | 8 | 8 | 0 | 0.18 | 0.18 | 5.13 | 3.59 | −1.54 | 0.30 | 11.44 | 11.34 | −0.10 | −0.01 |
| EM1 | 0 | 5 | 5 | 0 | 0.12 | 0.12 | 4.90 | 3.71 | −1.19 | 0.24 | 5.77 | 6.18 | 0.42 | 0.07 |
| Average | 0 | 8.4 | 8.4 | 0 | 0.13 | 0.13 | 5.42 | 3.96 | −1.46 | 0.27 | 10.42 | 11.41 | 0.99 | 0.10 |
| CM1 | 0 | 18 | 18 | 0 | 0.17 | 0.17 | 5.85 | 3.56 | −2.28 | 0.39 | 9.57 | 11.82 | 2.25 | 0.24 |
| CM2 | 2 | 19 | 17 | 0.14 | 0.19 | 0.05 | 5.59 | 4.10 | −1.48 | 0.27 | 9.27 | 12.90 | 3.63 | 0.39 |
| CM3 | 0 | 8 | 8 | 0 | 0.12 | 0.12 | 5.45 | 4.43 | −1.02 | 0.19 | 7.72 | 8.91 | 1.19 | 0.15 |
| CF2 | 5 | 17 | 12 | 0.14 | 0.22 | 0.08 | 4.68 | 4.00 | −0.68 | 0.15 | 10.01 | 11.53 | 1.52 | 0.15 |
| CF1 | 5 | 3 | −2 | 0.07 | 0.20 | 0.12 | 5.80 | 4.14 | −1.66 | 0.29 | 6.90 | 7.05 | 0.14 | 0.02 |
| Average | 2.4 | 13 | 10.6 | 0.07 | 0.18 | 0.11 | 5.47 | 4.05 | −1.43 | 0.25 | 8.69 | 10.44 | 1.75 | 0.19 |
All talkers but one (CF1) increased the number of pauses in clear speech as well as their duration. Most talkers, in fact, made no pauses in conversational speech. The average increase in the total number of pauses in clear speech (excluding CF1) ranged from 3 for EF2 to 18 for EF1 and CM1, with the average across all talkers being 9.5. Additionally, for all talkers the average pause duration was longer in clear speech than in conversational speech: the average pause duration increase in clear speech was 0.12 s, ranging from 0.052 s for CM2 and EF2 to 0.205 s for EF1. As an exception, CF1 had fewer pauses (3) in clear speech when compared to conversational speech (5). However, even for this talker the average duration of pauses in clear speech was longer than in conversational speech. The average increase in pause duration in clear speech is 0.12 s for this talker. Furthermore, a review of the recordings suggested that the pauses in the conversational style, for this talker, were due to hesitations caused by unfamiliarity with the read sentences rather than by deliberate pausing due to the speaking style.
The speaking rate results showed that all talkers produced fewer syllables in clear speech when compared to conversational speech, indicating that the change in speaking rate was not due entirely to the insertion of pauses. On average, the talkers produced 1.44 syllables/s less in clear than in conversational speech. The decrease in the number of syllables produced in the clear speaking style when compared to the conversational speaking style ranged between 0.68 syll/s for CF2 and 2.28 syll/s for CM1. ANOVA results for the effect of language (English versus Croatian) and style (conversational versus clear) on speaking rate showed a significant main effect of style [F(1,8) =94.713, p<0.0001], but not of language. The language by style interaction was not significant either. Overall, the present results support previous findings that clear speech production is characterized by longer segmental durations as well as by insertion of more and longer pauses. Furthermore, the comparison between the languages shows that the change in overall speaking rate for clear speech relative to conversational speech is similar in both languages.
2. Pitch range
Fundamental frequency (F0) is another global acoustic-phonetic parameter that differs across talkers, genders, and speaking styles. Bradlow et al. 2003 and Picheny et al. 1986 have shown that F0 range is increased in clear speech for most talkers. However, similar to the speaking rate findings, it is not clear that F0 range directly affects intelligibility. Nevertheless, an increase in pitch range is a hyperarticulation feature that appears to be one of many English clear speech characteristics. We measured the range between the highest and lowest F0 points in hertz for each sentence in the two speaking styles. The hertz values were converted into semitones for ease of comparison across different pitch ranges. Mean pitch range results along with the pitch range increase/decrease in clear speech for all talkers in both speaking styles are given in Table II.
The average pitch range expansion was 21.22 Hz or 1.26 semitones for the female talkers, and 15.03 Hz or 1.48 semitones for the male talkers. However, there was considerable across-talker variability in the amount of pitch range expansion. Three out of ten talkers, CF1, EM1, and EM2, expanded pitch range less than 5 Hz (for EM2 the pitch range is even slightly reduced in clear speech, although the amount is negligible). Seven talkers, however, showed larger pitch range increases in clear speech. The average pitch range expansion for these talkers ranged between 9.151 and 40 Hz (for CM3 and CM2, respectively) or between 0.899 and 3.63 semitones (for EF1 and CM2, respectively). Closer examination of low and high F0 targets revealed that the strategy for achieving the pitch range expansion was similar across talkers in both languages, i.e., F0 high targets were raised while low F0 targets (the bottom of the talker’s pitch range) remained relatively fixed. ANOVA results for the effect of language (English versus Croatian) and style (conversational versus clear) on pitch range showed a significant main effect of style [F(1,8) =14.292, p<0.005], but not of language. The style by language interaction was not significant. The results showed that, in the clear speaking style, talkers tended to increase their pitch range, and they did so to a similar degree in both languages.
In summary, the results of this examination of clear speech in terms of global acoustic measures demonstrated that a decrease in overall speaking rate, as reflected by both the number and duration of interword pauses and syllables-per-second production rate, and an increase in pitch range were consistent features of the conversational-to-clear speech transformation across talkers and across languages.
C. Acoustic analyses: Vowel space characteristics
In addition to the global acoustic changes for clear speech relative to conversational speech, we wanted to investigate fine-grained, acoustic-phonetic characteristics of clear speech as well. The present vowel space analyses aim to assess the contributions of language-specific and general/ universal principles in the acoustic realization of vowel categories. In particular, we explore whether the language-specific phonological property of the number of vowel categories in a language influences the extent of clear speech vowel space expansion.
Vowel hyperarticulation in English has been associated with an intelligibility advantage on the basis of intertalker differences in overall intelligibility within normal, conversational speech (Byrd, 1994; Bond and Moore, 1994; Bradlow, Torretta, and Pisoni, 1996; Hazan and Markham, 2004) as well as on the basis of clear versus conversational style comparisons (Picheny et al., 1986; Moon and Lindblom, 1994; Bradlow et al., 2003; Krause and Braida, 2004). Thus, there is strong support for the claim that vowel space expansion is an intelligibility-enhancing strategy available to English talkers. However, in light of results concerning language-specific effects on vowel space expansion in infant- versus adult-directed speech and in narrow versus broad focus conditions discussed above (Andruski et al., 1999; Hay et al., 2003; Coren and Heckmann, 2004), we were not certain whether Croatian talkers would adopt this same vowel expansion strategy under clear speech production conditions since Croatian has a small (5) vowel inventory in contrast to the large (14) vowel inventory of English. In keeping with the infant-directed and narrow focus findings, and consistent with the Theory of Adaptive Dispersion (Lindblom, 1986; Diehl and Lindblom, 2002), one might predict that English clear speech will show greater vowel space expansion than Croatian. However, Bradlow (2002) found that the high vowels /i/ and /u/ in English and Spanish both showed similar peripheralization towards the vowel space extremes in the two languages, suggesting that clear speech production may involve hyperarticulation for all vowels regardless of the vowel inventory size. In the present comparison, we selected three peripheral vowels (i, a, u) to evaluate the vowel space characteristics in English and Croatian. These vowels can potentially show the largest amount of articulatory modification since making them more peripheral, i.e., expanding the vowel space, is not limited by encroaching on other vowel categories but only by the limits of the vowel space itself.
F1 and F2 frequencies were taken from the midpoint of each vowel. All formant measurements were made automatically using an LPC formant tracking algorithm in PRAAT. Values that differed by more than 200 Hz from the mean for the category were hand checked and corrected if necessary. Three measures of the relationship between the speaking style and vowel space were used: vowel space area, vowel space dispersion (both following Bradlow et al., 1996) and vowel peripheralization. Vowel space area was measured as the Euclidean area covered by the triangle defined by the mean of each vowel category. Vowel space dispersion was measured as the distance of each vowel from the central point in the talker’s F1×F2 space. An overall vowel space dispersion value for each talker was then calculated as the mean of these distances. Finally, the extent of peripheralization in clear speech relative to conversational speech was measured for each vowel category separately. Here, the Euclidean distance in the F1×F2 space between the average location of each vowel in conversational and in clear speech was calculated separately for each talker and each vowel category. Figures 1–3 illustrate these three measurements for the talker who exhibited the largest effects of vowel space expansion in each language.
FIG. 1.
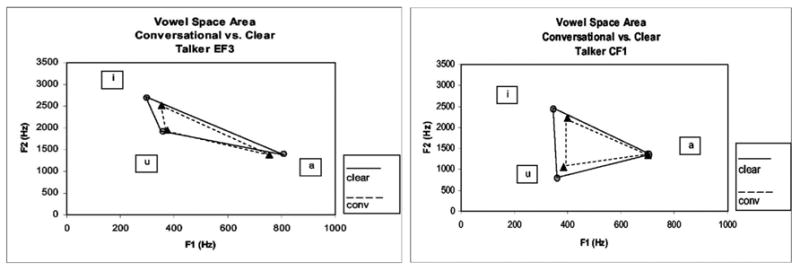
Vowel space area measured as the Euclidean area covered by the triangle defined by the mean of each vowel category for the talker who exhibited the largest effects of vowel space expansion in each language. Solid lines connect the clear speech vowels (circles) and dashed lines connect the conversational speech vowels (triangles).
FIG. 3.
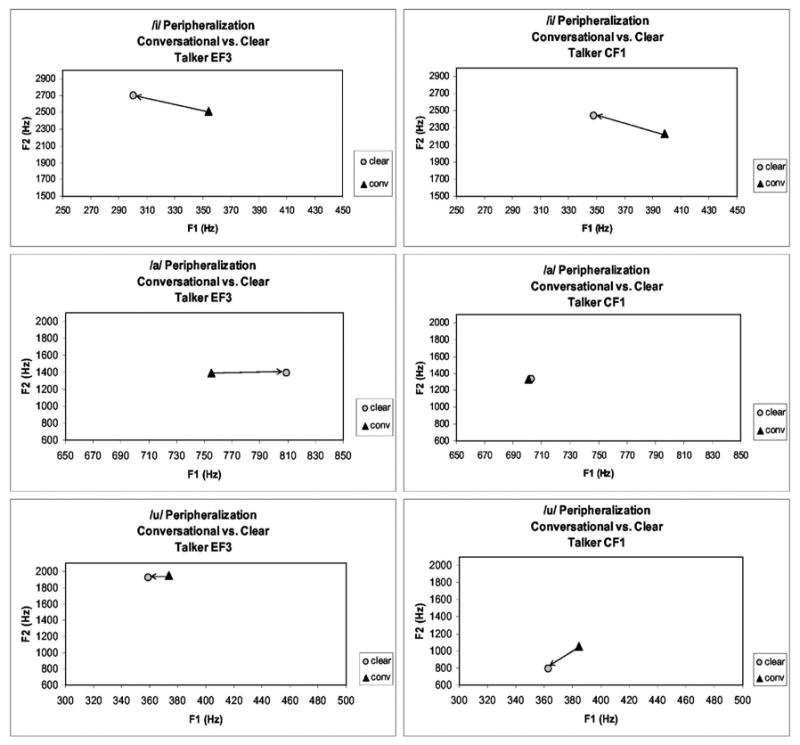
Vowel peripheralization measured as the Euclidean distance in the F1×F2 space between the average location of each vowel in conversational and in clear speech for the talker who exhibited the largest effects of vowel space expansion in each language. Peripheralization is given for each vowel separately so that the scale (in hertz) could be extended.
We included these three measures for several reasons. First, we wanted to see which measure would best capture vowel space expansion in the two languages. Conversational-to-clear vowel space modification could be of smaller magnitude in Croatian than in English. It is possible that this difference will only be evident in some but not all measures. Different measurements could also reveal if the two languages use similar or different strategies for vowel space expansion. For instance, both languages could overall cover a larger vowel space area in clear speech, but it could be the case that this is achieved through making /a/ more open in one language versus fronting /i/ and/or backing /u/ in another. Second, Bradlow et al. 1996 found that intelligibility scores correlated better with the vowel space dispersion measure than with the vowel space area measure, possibly due to the fact that the latter measure is based on category averages and not the individual vowel tokens produced, as is the case with the vowel dispersion measure. Finally, vowel space area and dispersion both capture the overall vowel space covered by the three point vowels in the two speaking styles. In order to assess the magnitude of peripheralization of each individual vowel category, we included the third measure as well. Since each of these measurements addresses a slightly different aspect of a talker’s clear speech production characteristics, we hoped to gain better insight into cross-language vowel space production strategies in different speaking styles.
The results for vowel space area, dispersion, and peripheralization for all talkers are given in Table III. We will discuss the results of each measurement beginning with the vowel space area. Although there is variability in the average vowel space area across the talkers in both speaking styles, talkers in both languages did indeed expand the vowel space in clear speech. ANOVA results for the effect of language (English versus Croatian) and style (conversational versus clear) on vowel space area showed a significant main effect of style [F(1,8) =48.691,p<0.0001], but not of language. The style by language interaction was almost significant [F(1,8) =5.218,p=0.052]. This almost-significant interaction was due to the one negative change, i.e., a decrease in the clear speech vowel area, in English, which was for the talker with the biggest conversational vowel space area (EF1). The statistical analysis thus supports previous findings that vowel space expansion is a correlate of the conversational-to-clear speech transformation. clear speech modifications, therefore, involve both global enhancements such as a decrease in speaking rate and pitch range expansion as well as the enhancement of phonological properties of a language, i.e., making the contrastive vowel categories more distinct from each other. In addition, these results show that talkers expanded the vowel space area equally in clear speech in both languages despite their different vowel inventories. In other words, in hyperarticulated clear speech the peripheral vowel categories were made more extreme, thereby utilizing a larger vowel space area even in a language with only five vowel categories.
TABLE III.
Vowel space area (Hz2), vowel space dispersion (Hz), and vowel peripheralization (Hz) results for each English and Croatian talker in two speaking styles. Negative sign indicates vowel space area reduction and a move towards the vowel space center rather than towards the periphery for talker EF1.
| Vowel space area (Hz2)
|
Vowel space dispersion (Hz)
|
Vowel space peripheralization (Hz) in clear speech (relative to conv.)
|
||||||||||
|---|---|---|---|---|---|---|---|---|---|---|---|---|
| Talker | Conv. | Clear | Cl-Conv. | Diff. (prop. conv.) | Conv. | Clear | Cl-Conv. | Diff. (prop. conv.) | a | i | u | Ave. |
| EF3 | 101 048.06 | 159 701.50 | 58 653.44 | 0.58 | 457.17 | 549.52 | 92.35 | 0.20 | 54.39 | 191.50 | 37.80 | 94.57 |
| EF2 | 116 190.42 | 167 536.05 | 51 345.63 | 0.44 | 513.62 | 595.70 | 82.09 | 0.16 | 67.01 | 144.98 | 35.80 | 82.60 |
| EF1 | 235 006.41 | 221 917.33 | −13 089.09 | −0.06 | 633.96 | 648.83 | 14.87 | 0.02 | 32.36 | 64.92 | −68.10 | 9.73 |
| EM2 | 157 295.10 | 203 727.19 | 46 432.09 | 0.30 | 444.15 | 508.21 | 64.06 | 0.14 | 21.00 | 86.42 | 85.15 | 64.19 |
| EM1 | 83 843.63 | 141 049.68 | 57 206.05 | 0.68 | 436.50 | 509.62 | 73.12 | 0.17 | 53.09 | 67.75 | 185.31 | 102.05 |
| Avg. | 138 676.72 | 178 786.35 | 40 109.62 | 0.39 | 497.08 | 562.38 | 65.30 | 0.14 | 45.57 | 111.12 | 55.19 | 70.63 |
| CM1 | 121 897.66 | 197 783.65 | 75 886.00 | 0.62 | 420.21 | 508.72 | 88.51 | 0.21 | 39.86 | 75.71 | 186.29 | 100.62 |
| CM2 | 164 867.28 | 246 607.29 | 81 740.00 | 0.50 | 489.70 | 549.09 | 59.38 | 0.12 | 67.94 | 65.14 | 91.64 | 74.91 |
| CM3 | 137 553.06 | 178 709.15 | 41 156.10 | 0.30 | 493.70 | 522.40 | 28.70 | 0.06 | 28.56 | 53.52 | 46.39 | 42.82 |
| CF2 | 488 133.66 | 585 893.24 | 97 759.58 | 0.20 | 791.85 | 815.35 | 23.50 | 0.03 | 81.52 | 54.71 | 110.12 | 82.12 |
| CF1 | 184 795.81 | 284 005.05 | 99 209.24 | 0.54 | 522.64 | 663.28 | 140.64 | 0.27 | 4.63 | 214.11 | 259.18 | 159.30 |
| Avg. | 219 449.49 | 298 599.68 | 79 150.18 | 0.43 | 543.62 | 611.77 | 68.15 | 0.14 | 44.50 | 92.64 | 138.72 | 91.95 |
Next, we turn to the second measurement of vowel space expansion, i.e., dispersion of individual vowels in the vowel space. The results of each individual talker’s vowel space dispersion in the two speaking styles are given in Table III. As expected, given the vowel space area results, for most talkers vowel space dispersion was greater in clear than in conversational speaking style. That is, vowels were more peripheral from the central point of the talker’s vowel space. Moreover, this greater vowel space dispersion for clear speech appears to be similar in both languages. ANOVA results for the effect of language (English versus Croatian) and style (conversational versus clear) on vowel space dispersion showed a significant main effect of style [F(1,8) =27.577,p<0.001], but not of language. The style by language interaction was not significant. These results corroborate the findings for vowel space area in that clear speech was characterized by greater vowel dispersion than conversational speech, and the effect was similar in both languages.
Finally, we looked at the amount of vowel peripheralization for each category separately in clear speech. This measure differs from the previous two in that it calculates the Euclidean distance in the F1×F2 space between the average token of a single vowel in conversational and clear speech styles. The results are shown in Table III. ANOVA showed no significant effect of language (English versus Croatian) or vowel (/a/ versus /i/ versus /u/) on the amount of vowel peripheralization in clear speech. The language by vowel interaction was also not significant. Overall, all three point vowels were peripheralized to a similar degree in both languages, despite the fact that the potential for perceptual confusion between separate vowel categories is smaller in Croatian with 5 vowels than in English with 14 vowels. This measurement, therefore, shows that talkers in both English and Croatian made all of their vowel productions more extreme in hyperarticulated clear speech. Furthermore, all of the vowel space results combined demonstrate that the three measurements adequately and similarly captured the vowel space expansion patterns in both languages. However, it is not clear that any of the three measurements was a better indicator of talker intelligibility (see the discussion below).
If we look more carefully at the individual talker’s vowel spaces, we notice that talkers adopted somewhat different strategies in achieving the expansion. For instance, both EF3 and CF1, talkers with the largest amount of vowel space expansion in each language (as reflected in the clear-conversational difference score for the vowel space area measure in Table III), produced higher and more front /i/ vowels in clear speech (as reflected by the value for /i/ peripheralization in Table III). Only EF3, though, lowered her jaw more and produced a lower, more open vowel /a/. CF1, on the other hand, produced a more retracted /u/ in clear speech. In general, there was a tendency for English talkers to retract /u/ in clear speech less than Croatian talkers. This is possibly due to the fact that /u/ in general American English is fairly fronted and making it more back would not necessarily make it a “better” realization of the vowel category. However, at least one English talker, EM1, retracted /u/ to a large degree (comparable to the amount of /u/ retraction in Croatian). Other talkers peripheralized vowels to different degrees. Unlike CF1, Croatian talkers CF2 and CM2, for example, produced a much more open vowel /a/. Similarly, English talkers EF3 and EF2 produced higher and more front /i/, but EF1 and EM1 did this to a lesser degree, etc. Although the articulatory strategies were different for different talkers, they all added up to the overall expansion of the vowel space with a larger distance between the contrastive categories. Most importantly for our present purposes, the overall expansion for clear speech relative to conversational speech and, in general, the strategies adopted to achieve this expansion, were language independent and seemed to be consistent regardless of the number of vowel categories in the language.
IV. DISCUSSION
In this paper, we set out to perform a cross-language comparison of clear speech perception and production in two typologically unrelated languages, namely Croatian and English. The overall goal was to identify acoustic-phonetic features that characterize the conversational-to-clear speech modifications in the two languages, and to establish whether these articulatory/acoustic adjustments are associated with an intelligibility gain.
The results showed that, although some talkers were more successful than others in improving their intelligibility, most talkers modified their speech production in clear speech in such a way that benefits the listener. Importantly, conversational-to-clear speech transformations in Croatian and English resulted in equal intelligibility benefits for Croatian and English listeners, respectively. These findings suggest that naturally produced clear speech is an effective way of enhancing speech perception under adverse speaking conditions regardless of the language involved.
We also found evidence that clear speech production is guided by both auditory-perceptual factors as well as by contrast enhancement mechanisms. Talkers of both languages enhanced the global salience of the speech signal by decreasing their speaking rate (both by producing longer segments and by inserting more frequent and longer pauses) and by expanding the pitch range. In addition, by producing more peripheral vowels in clear speech, the talkers enlarged the distance between the contrastive vowel categories which made them more distinct and perceptually less confusable. The results demonstrated that vowel space expansion was applied equally by talkers of both languages, suggesting that vowel contrast enhancement in hyperarticulated clear speech is independent of vowel inventory size.
These findings are consistent with the finding of Bradlow et al. 2003 that English and Spanish high vowels are more peripheral in clear than in conversational speech. However, these results differ from those obtained by Hay et al. 2003 and Coren and Heckmann (2004), who found no significant vowel space expansion in Japanese and substantial vowel space expansion in German for vowels in words in narrow focus versus in broad focus. These authors interpreted this cross-language difference in vowel space expansion as reflecting the cross-language difference in vowel inventory size, which is small for Japanese (5) and large for German (16). Their results were taken as evidence that hyperarticulation is sensitive to language-specific phonological properties. The question that the present data raise, then, is how can we explain the difference between Japanese and Croatian, two languages with similar and relatively small vowel inventories, in terms of their propensity to expand the vowel space under conditions of hyperarticulation?
It is possible that clear speech and narrow focus are two distinct speaking modes representing different types and/or degrees of hyperarticulation. Hyperarticulation in narrow focus is limited to one word, while clear speech affects the entire discourse. Furthermore, clear speech is specifically intended to enhance intelligibility, while narrow focus marks new or contrastive information. It is conceivable, then, that in narrow focus those cues that are already sufficiently distinct, such as F1×F2 vowel space characteristics in Japanese, are not enhanced. However, narrow focus and clear speech share numerous other enhancement characteristics, such as larger pitch excursions, vowel lengthening, vowel length contrast enhancement, etc. It therefore seems somewhat unlikely that vowel space expansion, if available as an enhancement strategy, would not accompany these other transformations (Smiljaniæ, 2004, 2005; Uchanski 1988, 1992; present study). If the difference between the two speaking styles is one of degree, i.e., if clear speech involves “stronger” hyperarticulation due to its intelligibility-enhancing nature, Japanese talkers may expand the vowel space in clear speech despite the absence of expansion in narrow focus. Conversely, Croatian talkers may show no vowel space expansion in narrow focus, in contrast to the vowel expansion of their clear speech productions. Such varied contrast enhancement strategies within a language also do not seem likely to us. We conducted a preliminary analysis of vowel space expansion in narrow focus in Croatian on data used in Smiljaniæ (2004). Although these data were designed and collected primarily for investigation of focus effects on vowel duration and pitch accents and are, therefore, not completely comparable to the data discussed here, the results indicated that talkers expanded the vowel space in narrow focus in much the same way as they expanded the vowel space in clear speech. Furthermore, based on the reported absence of vowel space expansion in Japanese infant-directed speech (Andruski et al., 1999), it is likely that Japanese talkers would not expand their vowel space in clear speech. If, indeed, we do find such consistent behavior within a language with regard to vowel space expansion, a cross-language comparison of Japanese, on the one hand, and Croatian (and possibly other languages with a five-vowel system such as Russian or Spanish) on the other, could provide further insight into the role played by inventory size in determining specific hyperarticulation strategies.
Although we have identified some acoustic-phonetic conversational-to-clear style transformations, in this study we have not attempted to relate these articulatory modifications directly to intelligibility. Our database of spoken sentences and intelligibility scores simply does not include enough talkers to provide for a meaningful assessment of the relationship between acoustic-phonetic variation and variability in intelligibility. Nevertheless, for the sake of future database development, we mention some tendencies that we observed in our database.
The two talkers who exhibited the highest intelligibility gain in clear speech were EF3 and CM1. For these talkers, conversational-to-clear speech modifications included a rather large speaking rate decrease and pitch range expansion compared to other talkers. Furthermore, both of these talkers exhibited a large vowel space area expansion. These modifications seem to conspire together to award these talkers the largest increase in intelligibility. It is equally informative to look at the two talkers with the smallest amount of intelligibility gain, namely EM1 and CF1. One would expect that the absence of the articulatory enhancements found for EF3 and CM1 will characterize EM1’s and CF1’s speech patterns. However, this is not quite what we found. EM1 did show a very small decrease in speaking rate as well as a rather small pitch range increase in clear speech. However, this talker showed a fairly large vowel space expansion. Moreover, this talker’s vowel space in conversational speech was the smallest of all English talkers and, despite the large amount of expansion, his vowel space remained rather small in clear speech in comparison to the other talkers. Similarly, CF1 showed a very small pitch range increase with a narrow pitch range in both speaking styles. This talker decreased the speaking rate quite a bit, but was still the second fastest talker in both speaking styles. Finally, despite showing the largest vowel space expansion, CF1 had very small vowel space areas in both speaking styles when compared to the other Croatian female talker. As expected, her conversational intelligibility score was second lowest and her clear speech intelligibility score was the lowest. For this set of talkers, then, the largest expansion of the vowel space does not result in an equivalently large improvement in intelligibility since all vowels remain more centralized, which seems to be detrimental for the listeners. Finally, a converse pattern can be seen for talker EF1, who showed the least amount of vowel space expansion in clear speech. In fact, for this talker, there was a slight reduction in the vowel space area for clear speech relative to conversational speech. However, this talker had the largest vowel space areas in both speaking styles and the second highest intelligibility scores in both speaking styles. For this talker, the intelligibility gain was not the largest but overall intelligibility was very high in both speaking styles. It is possible that this talker produced somewhat hyperarticulated speech in her conversational readings compared to other talkers, leaving very little “room for improvement” in clear speech.
These overall patterns provide further support for the claim that variation along multiple articulatory parameters, such as speaking rate, pitch range, and vowel space area, all contribute to variability in overall intelligibility (e.g., Bradlow et al., 1996; Hazan and Markham, 2004). Furthermore, within-talker enhancements of these various acoustic cues generally seem to result in improved intelligibility. However, the magnitude of the transformation is closely linked to the individual’s speech patterns within a speaking style. That is, talkers who are highly intelligible in the conversational speaking style might not modify their speech much, and therefore do not have a large intelligibility gain in clear speech. This suggests that there is a limit to the benefit afforded by these enhancement strategies. In other words, enhancing the acoustic-phonetic cues beyond a certain amount, such as slowing down further or expanding vowel space even more, might result in speech that sounds unnatural and is therefore less intelligible. Finally, the fact that talker EM1 shows the smallest vowel space area and the narrowest pitch range in the conversational speaking style and still receives the highest intelligibility score for this speaking style demonstrates that the acoustic cues discussed above are not the only cues relevant to high intelligibility. Indeed, other studies have pointed to various other cues not examined here (Picheny et al., 1986; Krause and Braida, 2004; Bradlow et al., 2003; Liu et al., 2004; Moon and Lindblom, 1994; Hazan and Markham, 2004).
V. CONCLUSIONS
The overall goal of this study was to confirm that the clear speech intelligibility effect was not an English-specific phenomenon, and in so doing to test the hypothesis that clear speech production is guided by both general, universal auditory-perceptual factors and phonological contrast enhancement factors. The data provided strong evidence that the general phenomenon of clear speech as a distinct, listener-oriented, intelligibility-enhancing mode of speech production exists in another language besides English. For the acoustic-phonetic features of the conversational-to-clear speech mode transformation examined here, we found that English and Croatian look remarkably similar. In both languages, talkers generally showed a decrease in speaking rate, an increase in pitch range, and an expansion of the vowel space in going from conversational to clear speech. Furthermore, despite the vastly different vowel inventory sizes (>10 for English, 5 for Croatian), the extent of vowel space expansion in the two languages was the same. These data have therefore revealed cross-language similarities in clear speech production. What remains for future research is the discovery of systematic, phonologically motivated cross-language differences in clear speech productions. To that end, we are currently conducting a series of further analyses of the materials in the present study to determine whether language-specific phonological contrast enhancement (such as enhancement of the phonemic vowel duration contrast of Croatian, the tense versus lax vowel duration contrast of English, and the two-way voicing category distinction of both Croatian and English) is indeed a guiding principle of clear speech production and a significant source of the substantial intelligibility gain for naturally produced clear speech.
FIG. 2.
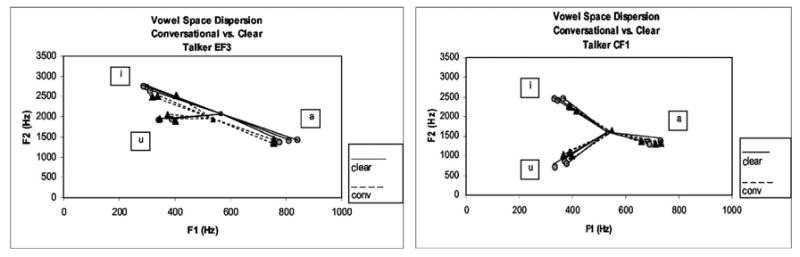
Vowel space dispersion measured as the distance of each vowel from the central point in the talker’s F1×F2 space for the talker who exhibited the largest effects of vowel space expansion in each language. Solid lines connect the clear speech vowels (circles) and dashed lines connect the conversational speech vowels (triangles).
Acknowledgments
We are grateful to Irena Zovko for help in recruiting Croatian subjects, and to Ken Konopka for assistance in running subjects. We thank Ben Munson and Robert Daland for help with PRAAT scripts. We also thank Randy Diehl and two anonymous reviewers for helpful suggestions concerning the research reported here. This research was supported by Grant No. NIH-R01-DC005794 from NIH-NIDCD.
Footnotes
Portions of this work were presented at the 147th and 148th meetings of the Acoustical Society of America in New York, NY (May 2004) and San Diego, CA (October 2004).
The difference between broad- and narrow-focused words reflects the difference in information content roughly corresponding to old (known to the listener) versus new (not previously known to the listener) information. Narrow focus can also refer to the added emphasis (contrastive information).
It is important to note that both “conversational” and “clear” speech terms refer to read laboratory speech elicited by specific instructions given to talkers rather than in a more naturalistic situation. Although, ultimately, we would like to investigate spontaneously produced clear and conversational speaking styles, we believe that data obtained in this study approximate this goal sufficiently since talkers implemented conversational-to-clear speech articulatory modifications which resulted in significant intelligibility benefits.
References
- Andruski JE, Kuhl PK, Hayashi A. Point vowels in Japanese mothers’ speech to infants and adults. J Acoust Soc Am. 1999;105:1095–1096. [Google Scholar]
- Boersma P. 1996 Available at: http://fonsg3.let.uva.nl/praat/praat.html.
- Bond ZS, Moore TJ. A note on the acoustic-phonetic characteristics of inadvertently clear speech. Speech Commun. 1994;14:325–337. [Google Scholar]
- Bradlow AR. Confluent talker- and listener-related forces in clear speech production. In: Gussen-hoven C, Warner N, editors. Laboratory Phonology. Vol. 7. Mouton de Gruyter; Berlin: 2002. pp. 241–273. [Google Scholar]
- Bradlow AR, Bent T. The clear speech effect for non-native listeners. J Acoust Soc Am. 2002;112:272–284. doi: 10.1121/1.1487837. [DOI] [PubMed] [Google Scholar]
- Bradlow AR, Kraus N, Hayes E. Speaking clearly for learning-impaired children: Sentence perception in noise. J Speech Lang Hear Res. 2003;46:80–97. doi: 10.1044/1092-4388(2003/007). [DOI] [PubMed] [Google Scholar]
- Bradlow AR, Torretta GM, Pisoni DB. Intelligibility of normal speech. I. Global and fine-grained acoustic-phonetic talker characteristics. Speech Commun. 1996;20:255–272. doi: 10.1016/S0167-6393(96)00063-5. [DOI] [PMC free article] [PubMed] [Google Scholar]
- Byrd D. Relations of sex and dialect to reduction. Speech Commun. 1994;15:39–54. [Google Scholar]
- Coren AE, Heckmann CL. Contrast enhancement of vowels in Modern Standard German. J Acoust Soc Am. 2004;114:2363. [Google Scholar]
- Cutler A, Butterfield S. Durational cues to word boundaries in clear speech. Speech Commun. 1990;9:485–495. [Google Scholar]
- Cutler A, Otake T. Mora or phoneme? Further evidence for language-specific listening. J Memory Lang. 1994;33:824–844. [Google Scholar]
- Cutler A, Mehler J, Norris D, Segui J. The syllable’s differing role in the segmentation of French and English. J Memory Lang. 1986;25:385–400. [Google Scholar]
- Diehl RL, Lindblom B. Speech Processing in the Auditory System. In: Greenberg S, Ainsworth W, Popper A, Fay R, editors. Explaining the structure of feature and phoneme inventories. Springer; New York: 2002. [Google Scholar]
- Ferguson SH. Talker differences in clear and conversational speech: Vowel intelligibility for normal-hearing listeners. J Acoust Soc Am. 2004;116:2365–2373. doi: 10.1121/1.1788730. [DOI] [PubMed] [Google Scholar]
- Ferguson SH, Kewley-Port D. Vowel intelligibility in clear and conversational speech for normal-hearing and hearing-impaired listeners. J Acoust Soc Am. 2002;112:259–271. doi: 10.1121/1.1482078. [DOI] [PubMed] [Google Scholar]
- Gagne JP, Rochette AJ, Charest M. Auditory, visual, and audiovisual clear speech. Speech Commun. 2002;37:213–230. [Google Scholar]
- Hay JF, Sato M, Coren AE, Diehl RL. A cross-language study of vowel sounds produced with and without emphasis: Testing the theory of adaptive dispersion. J Acoust Soc Am. 2003;111:2367. [Google Scholar]
- Hazan V, Markham D. Acoustic-phonetic correlates of talker intelligibility for adults and children. J Acoust Soc Am. 2004;116:3108–3118. doi: 10.1121/1.1806826. [DOI] [PubMed] [Google Scholar]
- Johnson K, Flemming E, Wright R. The hyperspace effect: Phonetic targets are hyperarticulated. Language. 1993;69:505–528. [Google Scholar]
- Krause JC. Properties of naturally produced clear speech at normal rates and implications for intelligibility enhancement. Department of Electrical Engineering and Computer Science, Massachusetts Institute of Technology; 2001. unpublished Doctoral dissertation. [Google Scholar]
- Krause JC, Braida LD. Investigating alternative forms of clear speech: The effects of speaking rate and speaking mode on intelligibility. J Acoust Soc Am. 2002;112:2165–2172. doi: 10.1121/1.1509432. [DOI] [PubMed] [Google Scholar]
- Krause JC, Braida LD. Acoustic properties of naturally produced clear speech at normal speaking rates. J Acoust Soc Am. 2004;115:362–378. doi: 10.1121/1.1635842. [DOI] [PubMed] [Google Scholar]
- Kuhl PK, Andruski JE, Chistovich L, Chistovich I, Kozhevnikova E, Sundberg U, Lacerda F. Cross language analysis of phonetic units in language addressed to infants. Science. 1997;227:684–686. doi: 10.1126/science.277.5326.684. [DOI] [PubMed] [Google Scholar]
- Lindblom B. Phonetic universals in vowel systems. In: Ohala JJ, Jaeger JJ, editors. Experimental Phonology. Academic; Orlando, FL: 1986. pp. 13–44. [Google Scholar]
- Lindblom B. Explaining phonetic variation: A sketch of the H&H theory. In: Hardcastle WJ, Marchal A, editors. Speech Production and Speech Modeling. Kluwer Academic; Netherlands: 1990. pp. 403–439. [Google Scholar]
- Liu S, Del Rio E, Bradlow AR, Zeng FG. Clear speech perception in acoustic and electrical hearing. J Acoust Soc Am. 2004;116:2374–2383. doi: 10.1121/1.1787528. [DOI] [PubMed] [Google Scholar]
- Moon SJ, Lindblom B. Interaction between duration, context, and speaking style in English stressed vowels. J Acoust Soc Am. 1994;96:40–55. [Google Scholar]
- Nusbaum HC, Pisoni DB, Davis CK. Research on Speech Perception: Progress Report No. 10. Indiana University; 1984. Sizing up the Hoosier Mental Lexicon: Measuring the familiarity of 20 000 words; pp. 357–376. [Google Scholar]
- Payton KL, Uchanski RM, Braida LD. Intelligibility of conversational and clear speech in noise and reverberation for listeners with normal and impaired hearing. J Acoust Soc Am. 1994;95:1581–1592. doi: 10.1121/1.408545. [DOI] [PubMed] [Google Scholar]
- Picheny MA, Durlach NI, Braida LD. Speaking clearly for the hard of hearing. II. Acoustic characteristics of clear and conversational speech. J Speech Hear Res. 1986;29:434–446. doi: 10.1044/jshr.2904.434. [DOI] [PubMed] [Google Scholar]
- Picheny MA, Durlach NI, Braida LD. Speaking clearly for the hard of hearing. III. An attempt to determine the contribution of speaking rate to differences in intelligibility between clear and conversational speech. J Speech Hear Res. 1989;32:600–603. [PubMed] [Google Scholar]
- Smiljaniæ R. Outstanding Dissertations in Linguistics. Routledge; New York: 2004. Lexical, Pragmatic, and Positional Effects on Prosody in Two Dialects of Croatian and Serbian: An Acoustic Study. [Google Scholar]
- Smiljaniæ R. Papers in Laboratory Phonology. Vol. 8. Yale University and Haskins Laboratories; 2005. Early vs. late focus: Pitch-peak alignment in two dialects of Serbian and Croatian. [Google Scholar]
- Solé MJ. Phonetic and phonological processes: The case of nasalization. Lang Speech. 1992;35:29–43. doi: 10.1177/002383099503800101. [DOI] [PubMed] [Google Scholar]
- Solé MJ. Spatio-temporal patterns of velopharyngeal action in phonetic and phonological nasalization. Lang Speech. 1995;38:1–23. doi: 10.1177/002383099503800101. [DOI] [PubMed] [Google Scholar]
- Studebaker GA. A ‘rationalized’ arcsine transform. J Speech Hear Res. 1985;28:455–462. doi: 10.1044/jshr.2803.455. [DOI] [PubMed] [Google Scholar]
- Uchanski RM. Spectral and temporal contributions to speech clarity for hearing impaired listeners. Department of Electrical Engineering and Computer Science, Massachusetts Institute of Technology; 1988. unpublished Doctoral dissertation. [Google Scholar]
- Uchanski RM. Segment durations in conversational and clear speech. 1992. unpublished manuscript. [Google Scholar]
- Uchanski RM, Choi SS, Braida LD, Reed CM, Durlach NI. Speaking clearly for the hard of hearing. IV. Further studies of the role of speaking rate. J Speech Hear Res. 1996;39:494–509. doi: 10.1044/jshr.3903.494. [DOI] [PubMed] [Google Scholar]