

Abstract
Meningiomas are common central nervous system neoplasms that exhibit remarkably diverse histopathology and biological behavior. Compared to astrocytomas, the most common central nervous system tumor, little is known about the molecular pathways critical for meningioma tumor formation and malignant progression. As an initial step toward characterizing the genetic basis of meningioma pathogenesis, we assessed cancer-related gene expression profiles of nonneoplastic leptomeningeal specimens and human meningiomas of varying World Health Organization (WHO) grade using high-density oligonucleotide microarrays. Although expression profile differences between nonneoplastic and meningioma specimens were readily discernible, the expression profile of a subset of genes could also distinguish WHO grade I from WHO grades II and III tumors. Altered expression levels of several genes identified in this study have been previously noted in meningiomas (eg, growth hormone receptor, IGFBP-7, endothelin receptor A, IGF2). However, we also identified a number of novel genes whose expression was associated with WHO grade and was confirmed by reverse transcriptase-polymerase chain reaction in a larger, independent set of meningeal tumors (n = 47). This report represents the first gene expression profiling studies of meningiomas and identifies some initial candidate genes that may provide further insights into the genetic basis for meningioma pathogenesis.
Meningiomas are among the most common central nervous system tumors, accounting for 26% of primary neoplasms. 1 Although often considered benign, as many as 20% of meningiomas display aggressive histological features and account for significant patient morbidity and mortality. 2,3 Their wide clinicopathological spectrum is reflected in the 13 histological variants and 3 malignancy grades recognized in the 2000 World Health Organization (WHO) classification scheme. 4 Recent improvements in histological grading have enhanced our abilities to predict biological behavior. 2-4 For example, in benign (WHO grade I) meningiomas, extent of surgical resection is an important prognostic variable, such that 5-year recurrence rates are 5% for totally resected versus 31% for subtotally resected cases. Mortality rates are negligible for such patients. In contrast, atypical (WHO grade II) meningiomas are associated with a 5-year recurrence rate of 40%, even when total resection is achieved. There is also a low, but statistically significant excess mortality when compared with age- and sex-matched controls. Anaplastic (WHO grade III) meningiomas are highly aggressive, rapidly growing neoplasms with a dismal prognosis and a median overall patient survival of <2 years. Despite these associations, there remains significant individual variability in terms of clinical behavior within each grade category that cannot be accounted for by clinical or pathological variables. Furthermore, accepted alternative therapies for patients that have failed surgical intervention are currently limited to radiation. For this reason, the molecular characterization of these diverse neoplasms could lead to improved prognostic accuracy and could provide highly sought after targets for the development of future therapeutic modalities.
Genetic studies of meningiomas have lagged behind those of other common central nervous system neoplasms, such as gliomas. Most molecular alterations are poorly characterized and the genetic classification of meningiomas is still in its infancy. For example, chromosomes 1p, 3p, 6q, 10, and 14q are currently suspected loci for tumor suppressor genes involved in malignant progression, because deletions in these regions are frequently found in aggressive meningiomas. 5-10 Gains of chromosomes 12q, 15q, 17q, and 20q have been identified using comparative genomic hybridization analysis, although the significance of such findings remains unclear. 7 Recently, the neurofibromatosis 2 (NF2) product, merlin, and a homologous protein 4.1 member, DAL-1 or protein 4.1B, have been implicated in meningioma tumorigenesis, whereas p16 (CDKN2A) inactivation and PS6K (17q23) amplification likely represent late alterations associated with anaplasia (grade III). 11-19
Gene expression profiling using nucleic acid microarrays is an effective method to obtain an unbiased survey of a tumor cell’s transcriptional landscape. This approach has been used to distinguish histologically ambiguous tumor types, 20 tumors arising from defined genetic predisposition syndromes, 21 and tumors with otherwise unascertainable clinical outcomes. 22 As such, we hypothesized that this method would also be particularly well suited for initial attempts to identify the molecular events involved in meningioma tumor progression. In this report, we used GeneChip microarrays representing ∼2000 human gene transcripts to generate expression profiles of 3 nonneoplastic meningeal specimens and 15 meningiomas of varying WHO grade. We have identified several groups of genes whose composite expression patterns correlate with tumor grade. In addition to genes whose altered expression has been previously reported in meningiomas, we have identified several unique genes that, on independent confirmation in a larger series of meningiomas, also demonstrated differential expression between tumor groups.
Materials and Methods
Specimen Acquisition and Processing
All tissue samples were collected by the Siteman Cancer Center Tissue Procurement Facility under an approved protocol from the institution’s Human Studies Committee. Resected meningioma tumor tissue was immediately snap-frozen in liquid nitrogen. Frozen tumor specimens were embedded in freezing medium, sectioned at 5 μm, and stained with hematoxylin and eosin. The histopathology of each collected specimen was reviewed to confirm that tissue used for RNA isolation was cellular, nonnecrotic, and contained at least 80% neoplastic cells. Subsequent 50-μm serial sections from each banked frozen specimen were then cut, placed immediately into Trizol reagent (Invitrogen, Carlsbad, CA), and homogenized. For each case used in the study, the corresponding paraffin-embedded surgical neuropathology material was also reviewed to assess grading. Tumors were classified and graded using the 2000 WHO scheme, 4 in accordance with previously proposed criteria from one of the authors (AP). 2,3 Tumors that just barely qualified for a designation of WHO grade II or just fell short of this designation were referred to as “borderline II” and “borderline I,” respectively. As a nonneoplastic control, postmortem meningeal specimens were also studied. Each was obtained within 24 hours of noncentral nervous system-associated patient death and consisted of leptomeninges stripped from the frontal poles and parasagittal regions of the brain. Resected tissue was snap-frozen and later homogenized in Trizol reagent as described above. Total RNA was isolated from Trizol homogenates using the manufacturer’s protocol. For GeneChip analysis, extracted RNA was then further purified using RNeasy spin columns (Qiagen, Valencia, CA) following the manufacturer’s protocol. Purified RNA was quantitated by UV absorbance at 260 and 280 nm and assessed qualitatively using an RNA LabChip and Bioanalyzer 2100 (Agilent, Palo Alto, CA).
Oligonucleotide Array Analysis
Analysis was performed by the Siteman Cancer Center GeneChip Facility. Ten μg of purified total RNA was converted to cDNA, purified, and then used as a template for in vitro transcription of biotin-labeled antisense RNA (aRNA). All protocols were performed as recommended by the manufacturer (Affymetrix, Santa Clara, CA) and have been described elsewhere. 23,24 Twenty μg of each biotinylated aRNA preparation was fragmented, assessed by gel electrophoresis, and placed in hybridization cocktail containing four biotinylated hybridization controls (BioB, BioC, BioD, and Cre) as recommended by the manufacturer. Samples were hybridized to Affymetrix HCG110 Human Cancer GeneChip arrays for 16 hours. GeneChips were washed and stained using the instrument’s standard Eukaryotic GE Wash 2′ protocol, using antibody-mediated signal amplification. The images from the scanned chips were processed using Affymetrix Microarray Analysis Suite 4.0. The image from each GeneChip was scaled such that the average intensity value for all arrays was adjusted to a target intensity of 1500. Scaled average difference value (SADV) and absolute call data from each GeneChip were exported as flat text files and used for further analysis. The absolute call data are a qualitative assessment generated by Affymetrix software and indicates whether the hybridization signal intensity from the oligonucleotide probe pair set is sufficiently robust to be reliably scored as detected (P). The SADV data are the quantitative hybridization signal value obtained from the probe pair set.
Microarray Data Analysis
Of the total 2059 gene sequences represented on the array, hybridization control sequences and sequences scored as “A” (not detected) in all 18 samples were excluded from initial analysis. For the remaining 1393 genes, all scaled average difference values of <1 were arbitrarily set to a baseline value of 1 to avoid 0 and negative numbers in subsequent normalization calculations. As a consequence of the signal-processing algorithm, negative scaled average difference values are routinely produced by Affymetrix Microarray Analysis Suite software version 4.0 and essentially represent background hybridization signal. Gene annotation data (http://www.netaffx.com/) was appended to expression data and the resulting flat text file was imported into DecisionSite 6.0 and Array Explorer software (Spotfire, Somerville, MA) for further data visualization and analysis. Unless otherwise noted, clustering and discriminant analysis (t-test) was performed using SADVs normalized to a mean of 0 and a SD of 1.0 (z-score). For identifying genes with the most significant differential expression between any two groups of specimens, the following general algorithm was followed. First, using normalized SADVs, a discriminant analysis using the t statistic was used to identify those genes whose relative expression was different between the two groups with an uncorrected P value of <0.01. Next, using absolute SADVs, genes were selected whose average SADV within the group differed by >2.5-fold between the two groups. Genes whose expression met both of these two criteria for any pairwise comparison were examined further.
Real-Time Reverse-Transcriptase-Polymerase Chain Reaction (RT-PCR)
Oligonucleotide sequences corresponding to the selected gene transcripts examined by RT-PCR were designed using Primer Express software (Applied Biosystems, Foster City, CA) and are available on request from the authors. One μg of total cellular RNA from the indicated tissue specimens was subjected to reverse transcription using Omniscript reverse transcriptase (Qiagen) and oligo-dT, following the manufacturer’s protocol. After first strand synthesis, an equivalent of 25 ng of starting total cellular RNA (1/40th of the cDNA reaction) was added to two duplicate PCR reactions containing 1× SybrGreen master mix (Applied Biosystems), 100 nmol/L forward primer, and 100 nmol/L reverse primer in a final volume of 20 μl. Each primer set for a single gene [including the glyceraldehyde 3-phosphate dehydrogenase (GAPDH) control] was used in a single reaction plate (47 duplicated samples and duplicate negative controls) that cycled at 95°C for 10 minutes (to activate enzyme), followed by 40 cycles of 95°C for 30 seconds, and 60°C for 1 minute on a GeneAmp 5700 sequence detection system (Applied Biosystems). Fluorescent data were converted into cycle threshold (CT) measurements using the 5700 system software and exported to Microsoft Excel. Samples in which CTs differed by more than 1.5 between duplicates (11 of 705 duplicate reactions performed) were excluded from further analysis. This included three samples for calreticulin, five samples for endothelin A receptor, one sample for histone H2A, one sample for E2F-4, and one sample for wee1. The ΔΔCT method 25 was used to calculate fold expression levels relative to the average value of four normal meningeal RNA specimens (the calibrator). Expression of each gene in each sample was normalized to the signal obtained for a GAPDH control performed on a separate plate. Although differential expression of GAPDH itself may sometimes render it an ineffective reference transcript, 26 we found from our initial microarray data that GAPDH expression varied by no more than twofold among differing WHO grades of meningioma and nonmalignant leptomeningeal samples, with no apparent correlation between WHO grade and GAPDH transcript level. For this reason, we elected to use GAPDH as our reference transcript in this study. Fold expression change for each sample was defined as 2−ΔΔCT where ΔΔCT was defined as the difference between the sample’s ΔCT (CTgene-CTGAPDH) and the average normal meningeal reference’s ΔCT (CTgene-CTGAPDH). Before this analysis, the performance of each primer pair was tested by making a reference RNA cocktail containing RNA from all 47 samples analyzed. One μg of this cocktail was converted to cDNA and a series of twofold serial dilutions were subjected to quantitative PCR analysis as described above. Plots of log (input cDNA) versus CT were examined to verify linearity. PCR products were evaluated by gel electrophoresis to ensure that only a single band was present and thermal dissociation plots were examined for biphasic melting curves, indicative of whether primer-dimer formation could be contributing to amplification signal. 27 Finally, all primers were tested with the RNA cocktail in the absence of reverse transcriptase (−RT control) to ensure that no signal was obtained from potentially contaminating genomic DNA.
Results and Discussion
A total of 18 patient samples were analyzed, including 3 samples of nonneoplastic postmortem (normal) leptomeninges. Tumor samples were selected to represent WHO grade I (six samples), grade II (six samples), and grade III (three samples) meningiomas, and were associated with a variety of other documented pathological and clinical features (Figure 1) ▶ . Two samples were included from patients with neurofibromatosis type 2 (NF2).
Figure 1.

Clustering of human meningeal tissues. The table lists the 18 tissue samples used in this study (columns) that include 3 nonmalignant specimens and 15 meningiomas. Clinical and pathological data are listed for each specimen where available. FL, Frontal lobe; PL, parietal lobe; SB, skull base; BS, brain stem; M, meningothelial variant; T, transitional variant; F, fibroblastic variant; NL, normal. Above the table, a dendrogram represents a typical hierarchical clustering pattern generated using the expression levels of 1393 gene transcripts. Consistent dendrogram features generated regardless of the algorithm used are labeled (A, B, C) and discussed in the text.
We initially performed unsupervised hierarchical clustering of the samples using the expression values of the 1393 filtered genes and several different clustering methods. A representative hierarchical relationship of the samples is depicted as a dendrogram in Figure 1 ▶ . Although the relationship of the samples varied slightly with the clustering method used, there were several basic groupings that were always preserved. One major grouping (Figure 1A) ▶ consisted of normal leptomeningeal tissue and a single benign fibroblastic and markedly hyalinized meningioma from a patient with NF2. This meningioma may have been sufficiently differentiated so that it more closely resembled normal meningeal tissue or recruitment of fibroblasts and other nonneoplastic elements may have artificially accounted for these similarities. Surprisingly, two other high-grade meningiomas (no. 1081 and no. 1082) also appeared more similar in expression profile to the nonneoplastic meninges than to the other meningiomas. Histological review of these specimens confirmed neoplastic cell content and that both tumors were meningothelial variants with similar histological parameters, including the proliferative index. Of the remaining 12 meningiomas (Figure 1B) ▶ , 5 WHO grade I and 1 borderline WHO grade II tumor showed a consistent subgrouping (Figure 1C) ▶ . Interestingly, this borderline WHO grade II tumor (no. 429) was originally classified as WHO grade I, but later upgraded based on strict histological criteria. The remaining WHO grade II and WHO grade III tumors grouped primarily according to histological variant, ie, meningothelial versus transitional. Although the total number of tumors analyzed in this study was small, the clustering pattern suggested that meningioma gene expression profiles are related to both histological type and WHO grade.
To identify specific transcripts potentially associated with neoplastic transformation, we first searched for genes that were differentially expressed between all three benign meningeal samples and all but one (no. 427) meningioma. Table 1 ▶ lists the genes that demonstrated the greatest differential expression between these two groups, sorted by functional category. It is important to consider that the cellular composition of normal meningeal tissue can differ substantially from meningioma tumor tissue. In particular, because meningothelial or arachnoidal cap cells comprise a relatively thin superficial layer, blood vessels would be expected to make up a proportionally higher percentage of the specimen than they do in most meningiomas, except perhaps the angiomatous (vascular) variant. This may explain why several potentially vascular-associated genes were found to be overexpressed in meninges, including smooth muscle myosin heavy chain, smooth muscle gamma actin, thrombospondin 2, and angiopoietins 1 and 2. In addition, although the molecular integrity of RNA isolated from postmortem normal meningeal tissue was high, it is possible that agonal antemortem ischemic responses could potentially perturb the expression profile of the nonneoplastic tissue specimens. This phenomenon could provide an explanation for the observed high expression levels of several apoptosis and hypoxia response-associated genes in nonneoplastic autopsy tissue relative to the surgically resected meningioma tissues. With these caveats, we hypothesized that several of the identified transcripts still represented tumor-specific changes in gene expression.
Table 1.
GenBank Accession Number, Gene Name, and Reported Chromosomal Localization of Gene Transcripts Differentially Expressed Between Nonmalignant Leptomeningeal Tissue and Meningiomas of All WHO Grades
| GenBank accession | Gene name | Chromosome | Fold difference (T versus N) | ||
|---|---|---|---|---|---|
| GC | RT-PCR 1 | RT-PCR 2 | |||
| Vascular/endothelial | |||||
| D10667 | Smooth muscle myosin heavy chain | 16q12 | −8431 | ||
| M55153 | Transglutaminase 2 (*) | 20q12 | −4136 | ||
| K02215 | Angiotensinogen | 1q42-q43 | −200 | ||
| D00654 | Enteric smooth muscle gamma-actin | 2p13.1 | −188 | ||
| AF001548 | Myosin heavy chain | 16p13.13-p13.12 | −160 | ||
| M10321 | von Willebrand factor precursor | 12p13.3 | −9.2 | ||
| M25897 | Platelet factor 4 | 4q12-q21 | −8.4 | ||
| M31210 | Edg-1 endothelial sphingolipid G-protein-coupled receptor | 1p21 | −7.4 | 2.5 | 2.0 |
| L34657 | Platelet/endothelial cell adhesion molecule CD31 antigen | 17q23 | −5.4 | ||
| AF004327 | Angiopoietin 2 | 8p23.1 | −5.3 | ||
| X60957 | Tie receptor tyrosine kinase | 1p34-p33 | −4.5 | ||
| AF035121 | KDR/flk-1 | 4q11-q12 | −3.8 | ||
| U83508 | Angiopoietin 1 | 8q22.3-q23 | −3.7 | ||
| Apoptotic | |||||
| S81914 | Immediate early response IEX-1 | 6p21.3 | −9.0 | ||
| U27467 | Bfl-1 (BCL2-related) | 15q24.3 | −4.8 | ||
| Y13620 | Bcl9 | 1q21 | −3.4 | ||
| AF005775 | Caspase-like apoptosis regulator 2 | 2q33-q34 | −3.4 | ||
| Hypoxia/stress | |||||
| U04636 | Cyclooxygenase-2 | 1q25.2-q25.3 | −8.9 | ||
| M60165 | Guanine nucleotide-binding regulatory protein Go-alpha (*) | 6p21.3 | −24 | ||
| M63488 | Replication protein A, 70-kd subunit | 17p13.3 | 3.5 | ||
| L07493 | Replication protein A3, 14 kd | 7p22 | 12 | ||
| Leukocytic | |||||
| X54131 | Protein tyrosine phosphatase, receptor type, B | 12q15-q21 | −131 | ||
| M28130 | Interleukin 8 | 4q13-q21 | −44 | ||
| X68149 | Burkitt lymphoma receptor 1 (chemokine receptor) | 11 | −8.6 | ||
| J04164 | Interferon-induced transmembrane protein 1 | 11 | −7.2 | ||
| L10717 | IL2-inducible T-cell kinase | 5q31-q32 | −6.6 | ||
| X52425 | Interleukin 4 receptor | 16p11.2-12.1 | −4.8 | ||
| Cytoskeletal/ECM | |||||
| M32334 | ICAM-2 | 17q23-q25 | −4.6 | ||
| U59289 | Cadherin 13 | 16q24.2-q24.3 | −4.5 | ||
| M25280 | Selectin L | 1q23-q25 | −4.4 | ||
| D88799 | Cadherin | −4.1 | |||
| U01828 | Microtubule-associated protein 2 | 2q34-q35 | −3.9 | ||
| Growth | |||||
| U27193 | Map kinase phosphatase hVH-5 | 11p15.5 | −32 | ||
| U12535 | EGF Kinase substrate Eps8 | 12q23-q24 | −13 | ||
| D14134 | RAD51 homolog | 15q15.1 | −10 | ||
| X59065 | Fibroblast growth factor 1 | 5q31 | −7.4 | ||
| U26710 | EGF ubiquitin protein ligase cbl-b | 3q | −4.3 | ||
| L19182 | MAC25/IGFBP-7 (*) | 4q12 | −3.8 | ||
| L77886 | Protein tyrosine phosphatase, receptor type, K | 6q22.2-23.1 | −3.4 | ||
| L37882 | Frizzled (Wnt receptor) | 17q21.1 | 3.7 | ||
| X77794 | Cyclin G1 | 5q32-q34 | 3.9 | ||
| M94250 | Midkine | 11p11.2 | 6.0 | 4.3 | 4.0 |
| S75174 | E2F transcription factor 4 | 16q21-q22 | 6.2 | 4.1 | 3.9 |
| NA | Tc21 (ras-like) | 8.1 | |||
| U10564 | Wee1 tyrosine kinase | 11p15.3-p15.1 | 18 | 12 | 8.9 |
| Transcription | |||||
| M21535 | Ets-related, erg | 21q22.3 | −11 | −2.5 | −2.5 |
| L19779 | H2A histone family, member O | 1 | −10 | −10 | −11 |
| J04102 | Ets-2A | 21q22.2 | −7.2 | ||
| U22376 | C-myb | 6q22-q23 | −3.6 | ||
| Miscellaneous | |||||
| D10995 | Serotonin receptor 1B | 6q13 | −69 | ||
| X96753 | Melanoma-associated chondroitin sulfate proteoglycan 4 | 15 | −9.2 | ||
| L26336 | Heat shock 70kD protein 2 | 14q24.1 | −5.3 | ||
| D26070 | Inositol 1,4,5-triphosphate receptor, type 1 | 3p26-p25 | −4.5 | ||
| M90657 | Tumor Antigen L6 | 3q21-q25 | −4.0 | ||
| J03910 | Metallothionein 1G | 16q13 | −3.9 | ||
| U50534 | Human BRCA2 region mRNA sequence CG003 | 13q12-q13 | −3.9 | ||
| M29540 | Carcinoembryonic antigen | 19q13.1-q13.2 | −3.8 | ||
| X00737 | Purine nucleoside phosphorylase | 14q13.1 | −3.6 | ||
| X12794 | Orphan hormone receptor ear-2 | 19p13.1 | 7.3 | 4.0 | 3.8 |
| X82153 | Cathepsin K | 1q21 | 70 | 11 | 11 |
Only genes with greater than a threefold average expression difference between the sample groups are listed. In the first column (GC), fold difference levels obtained from GeneChip microarray analysis are represented in meningiomas (n = 14) relative to normal tissue (n = 3). In the second column (RT-PCR 1), fold difference levels obtained from RT-PCR analysis of the same RNAs used for microarray analysis (less one WHO grade II meningioma) are similarly represented. In the third column (RT-PCR 2), fold difference levels obtained from RT-PCR analysis of the expanded sample set (43 meningiomas, 4 normal meningeal tissues) are indicated. Genes are grouped based on known primary functional attributes. Gene names indicated by an asterisk have previously reported alterations in expression associated with meningiomas.
We also focused on gene expression differences among the different WHO grades of meningioma. Using a discriminant analysis approach to compare the four cases of nonhyalinized, unambiguously benign (WHO grade I) meningiomas (no. 420, no. 421, no. 426, no. 428) to the eight clear cases of atypical (WHO grade II) and anaplastic (WHO grade III) tumors, we identified 133 genes with differential expression. Hierarchical clustering of the 18 samples with only these 133 genes generated a robust pattern that clearly distinguished the WHO grade I from WHO grades II and III meningiomas (Figure 2) ▶ and that showed absolute expression levels that were different by >2.5-fold on average between the two groups (Table 2) ▶ .
Figure 2.

Clustering of human meningeal tissues by WHO grade using a subset of gene transcripts. The table lists the 18 tissue samples used and their corresponding pathological data. FL, Frontal lobe; PL, parietal lobe; SB, skull base; BS, brain stem; M, meningothelial variant; T, transitional variant; F, fibroblastic variant; NL, normal. Above the table, a dendrogram represents the hierarchical clustering pattern generated using the expression levels of 133 gene transcripts, selected based on their differential expression between WHO grade I and WHO grade II and III meningiomas. Below the dendrogram, a heatmap represents the relative expression level of the 133 genes. A single horizontal line represents a single gene and the gray scale of the line represents its relative expression (white, low expression; black, high expression) in the corresponding sample (column).
Table 2.
GenBank Accession Number, Gene Name, and Reported Chromosomal Localization of Gene Transcripts Differentially Expressed Between WHO Grade I and WHO Grades II and III Meningiomas
| Accession | Name | Chromosome | Fold difference | ||
|---|---|---|---|---|---|
| GC | RT-PCR 1 | RT-PCR 2 | |||
| M79321 | Lyn B | 8q13 | 195 | ||
| X06562 | Growth hormone receptor (*) | 5p13-p12 | 100 | ||
| AD000092 | Calreticulin | 19p13.3-p13.2 | 50 | 2.0 | 1.2 |
| D11151 | Endothelin receptor type A (*) | 4 | 6.3 | 3.8 | 2.0 |
| J03242 | Insulin-like growth factor 2 (*) | 11p15.5 | 6.3 | 3.9 | 2.0 |
| D14134 | RAD51 homolog | 15q15.1 | 4.5 | ||
| U60805 | Oncostatin M receptor (*) | 5p15.2-p13.2 | 4.0 | ||
| M35878 | Insulin-like growth factor binding protein 3 | 7p13-p12 | 3.6 | ||
| X98296 | Ubiquitin hydrolase | Xp11.4 | 3.3 | ||
| L15409 | VHL | 3p26-p25 | 3.1 | ||
| J04765 | Osteopontin (*) | 4q21-q25 | 3.0 | ||
| M77349 | NIGH3 (TGFb Induced) | 5q31 | 3.0 | ||
| M57399 | Nerve growth factor HBNF-1 | 7q33-q34 | −3.0 | ||
| M19720 | L-myc | 1p34.3 | −3.3 | ||
| D64142 | H1 histone family, member X | Unknown | −3.3 | ||
| D12485 | NPPase | 6q22-q23 | −3.4 | ||
| L14812 | Retinoblastoma-like 1 (p107) | 20q11.2 | −3.9 | ||
| M29039 | Jun B proto-oncogene | 19p13.2 | −4.5 | −2.4 | −2.8 |
| S38742 | Hox 11 | 10q24 | −6.4 | ||
| U76456 | Tissue inhibitor of metalloproteinase 4 (*) | 3p25 | −8.7 | ||
| L05515 | cAMP response element-binding protein CRE-BPa | 7p15 | −20 | ||
| L29218 | Clk2 | 1q21 | −23 | ||
| L24564 | Ras-related rad | 16q22 | −50 | −7.7 | −6.7 |
| U07000 | BCR | 22q11.23 | −138 | −5.3 | −5.6 |
Only genes with greater than a threefold average expression difference between the sample groups are listed. In the first column (GC), fold difference levels obtained from microarray analysis are noted. In the second column (RT-PCR 1), fold difference levels obtained from RT-PCR analysis of the same RNA samples used for microarray analysis (less one WHO grade II meningioma) are noted. In the third column (RT-PCR 2), fold difference levels obtained from RT-PCR analysis of the expanded sample set are indicated. Gene names indicated by an asterisk have previously reported alterations in expression associated with meningiomas.
To validate a subset of the data obtained on the initial series of 15 meningiomas analyzed by gene expression profiling, we chose 14 transcripts to evaluate in a larger group of samples using a real-time RT-PCR assay. These transcripts were chosen based on: 1) fold difference between sample groups; 2) absolute expression level; and 3) biological interest and/or degree of novelty. We examined gene expression in 47 different RNA samples, including 17 of the 18 samples originally used for microarray analysis, 1 additional nonmalignant leptomeningeal specimen, and an additional 29 tumor specimens representing WHO grade I, II, and III meningiomas. Relative expression of these transcripts in the 47 samples is indicated along side expression data from microarray analysis in Tables 1 and 2 ▶ ▶ . In addition, the relative expression of four transcripts that demonstrated a statistically significant difference between WHO grade I and WHO grades II and III meningiomas is displayed as a scatterplot in Figure 3 ▶ .
Figure 3.
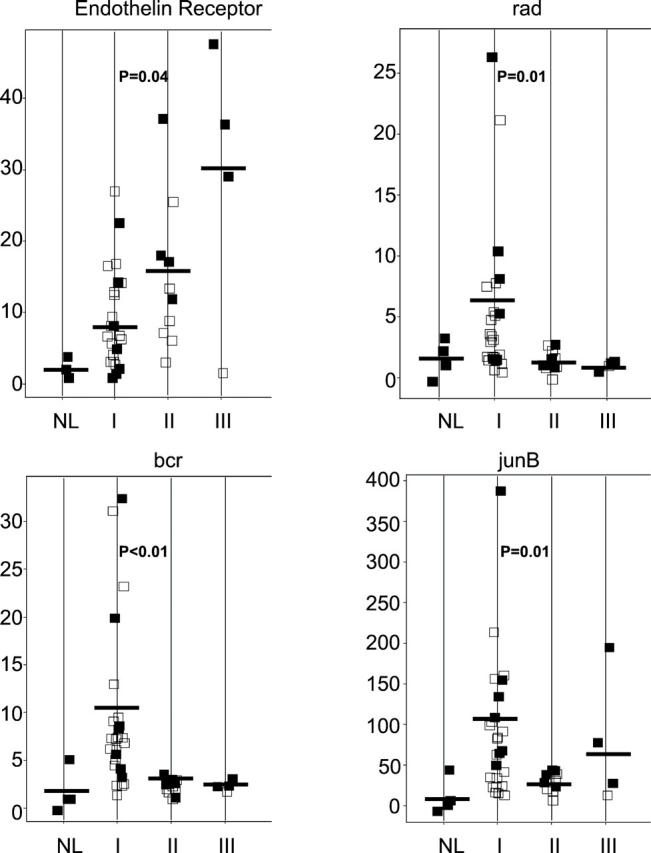
RT-PCR expression assay of genes identified by microarray analysis. Four genes that demonstrated a statistically significant difference in expression between WHO grade I and WHO grade II and III meningiomas are represented. In each transcript-specific plot, a single point represents one sample analyzed. Solid points represent samples used for initial microarray studies whereas open points represent additional samples. On the vertical axis, the level of expression of the gene in each sample is expressed relative to the average level of expression in normal meningeal RNA samples. Samples are stratified on the horizontal axis by WHO tumor grade. NL, normal meninges. Horizontal bar indicates the average expression in each sample group. Significance level (student’s t-test, two-tailed, unequal variance) between expression in WHO grade I and WHO grade II and III samples is indicated.
Eight transcripts examined (midkine, E2F-4, wee1, H2A-O, ear-2, endothelin receptor A, IGF2, and junB) demonstrated concordant levels of differential expression between GeneChip and RT-PCR analysis. Four additional genes (erg, bcr, rad, and cathepsin k) showed qualitatively concordant, but quantitatively different expression fold changes between the GeneChip and RT-PCR assays. This partial lack of concordance could not be explained by sample bias, because RT-PCR analysis of the same initial sample set used for GeneChip analysis was comparable to the results using the extended sample set. This difference is more likely explained by the use of the ΔΔCT method to calculate relative expression levels in the RT-PCR assay. 26 Despite these quantitative differences between GeneChip and RT-PCR results, both BCR and rad showed statistically significant expression differences (Student’s t-test, P < 0.05) between WHO grade I and WHO grade II and III meningiomas (Figure 3) ▶ . Only two transcripts analyzed (edg-1 and calreticulin) demonstrated no concordance between microarray analysis and the RT-PCR assay.
Among those genes identified in this study, there were several whose altered expression have been previously reported in meningiomas and may be attractive targets for therapy. These include growth hormone receptor, 28 insulin-like growth factor II, 29 IGFBP-7, 30 and endothelin receptor A. 31 However, we have also identified and validated several previously unrecognized and intriguing potential molecular targets for further study in human meningiomas. Cathepsin K is a cellular protease whose expression is associated with an invasive tumor phenotype, 32 whereas midkine is a mitogenic and angiogenic factor that is up-regulated in tumors of both the central and peripheral nervous system. 33 Ear-2 is an nuclear orphan receptor associated with hormonal gene regulation; 34 up-regulation of this transcript in meningiomas may be of particular interest with regard to the role of other hormone receptors in meningioma biology. 35 We have also identified several genes that may represent progression-associated markers and thus warrant further study. Transcript levels of Rad, BCR, and junB were down-regulated in WHO grade II and III meningiomas relative to WHO grade I specimens. Rad is a Ras-related GTPase that interacts with the nm23 metastasis suppressor and is related to an invasive phenotype. 36 BCR mediates cell-cycle growth arrest and apoptosis in B lymphocytes, 37 but its gene is also located on chromosome 22q11, a region frequently lost in meningiomas. 38 Lastly, decreased junB expression is consistent with this gene’s role in repressing cyclin D and cell proliferation through the transcriptional activation of p16. 39
In summary, we have identified and validated an initial set of gene expression profiles associated with WHO grade subtypes of meningioma. Although the functional significance of the differential gene expression patterns delineated in this study is unknown, the transcripts identified are likely to provide useful molecular targets to further study the biology of human meningiomas. Additional investigation of these genes in the molecular pathogenesis of meningiomas has the potential to improve diagnostic and therapeutic strategies, particularly for those patients with aggressive meningiomas that are currently resistant to conventional forms of therapy.
Footnotes
Address reprint requests to Arie Perry, M.D., Division of Neuropathology, Box 8118, Washington University School of Medicine, 660 South Euclid Ave., St. Louis, MO 63110-1093. E-mail: aperry@pathology.wustl.edu.
Supported in part by Siteman Cancer Center Research and GeneChip Awards (to A. P.), and grants from the National Institutes of Health (grants NS-35848 and NS-41520 to D. H. G.).
References
- 1.: CBTRUS: Statistical report: primary brain tumors in the United States, 1992–1997. 2000. Central Brain Tumor Registry of the United States, Chicago, IL
- 2.Perry A, Stafford SL, Scheithauer BW, Suman VJ, Lohse CM: Meningioma grading: an analysis of histologic parameters. Am J Surg Pathol 1997, 21:1455-1465 [DOI] [PubMed] [Google Scholar]
- 3.Perry A, Scheithauer BW, Stafford SL, Lohse CM, Wollan PC: “Malignancy” in meningiomas: a clinicopathologic study of 116 patients. Cancer 1999, 85:2046-2056 [DOI] [PubMed] [Google Scholar]
- 4.Louis DN, Scheithauer BW, Budka H, von Deimling A, Kepes JJ: Meningiomas. Kleihues P Cavenee WK eds. World Health Organization Classification of Tumours. Pathology and Genetics of Tumours of the Nervous System. 2000:pp 176-189 IARC Press, Lyon
- 5.Schneider BF, Shashi V, von Kap H, Golde WL: Loss of chromosomes 22 and 14 in the malignant progression of meningiomas: a comparative study of fluorescence in situ hybridization (FISH) and standard cytogenetic analysis. Cancer Genet Cytogenet 1995, 85:101-104 [DOI] [PubMed] [Google Scholar]
- 6.Simon M, von Deimling A, Larson JJ, Wellenreuther R, Kaskel P, Waha A, Warnick RE, Tew JM, Jr, Menon AG: Allelic losses on chromosomes 14, 10, and 1 in atypical and malignant meningiomas: a genetic model of meningioma progression. Cancer Res 1995, 55:4696-4701 [PubMed] [Google Scholar]
- 7.Weber RG, Bostrom J, Wolter M, Baudis M, Collins VP, Reifenberger G, Lichter P: Analysis of genomic alterations in benign, atypical, and anaplastic meningiomas: toward a genetic model of meningioma progression. Proc Natl Acad Sci USA 1997, 94:14719-14724 [DOI] [PMC free article] [PubMed] [Google Scholar]
- 8.Lamszus K, Kluwe L, Matschke J, Meissner H, Laas R, Westphal M: Allelic losses at 1p, 9q, 10q, 14q, and 22q in sporadic meningiomas. Cancer Genet Cytogenet 1999, 110:103-110 [DOI] [PubMed] [Google Scholar]
- 9.Leone PE, Bello MJ, de Campos JM, Vaquero J, Sarasa JL, Pestana A, Rey JA: NF2 gene mutations and allelic status of 1p, 14q and 22q in sporadic meningiomas. Oncogene 1999, 18:2231-2239 [DOI] [PubMed] [Google Scholar]
- 10.Cai DX, Banerjee R, Scheithauer BW, Lohse CM, Kleinschmidt-DeMasters BK, Perry A: Chromosome 1p and 14q FISH analysis in clinicopathologic subsets of meningioma: diagnostic and prognostic implications. J Neuropathol Exp Neurol 2001, 60:628-636 [DOI] [PubMed] [Google Scholar]
- 11.Ruttledge MH, Sarrazin J, Rangaratnam S, Phelan CM, Twist E, Merel P, Delattre O, Thomas G, Nordenskjold M, Collins VP, Dumanski JP, Rouleau GA: Evidence for the complete inactivation of the NF2 gene in the majority of sporadic meningiomas. Nat Genet 1994, 6:180-184 [DOI] [PubMed] [Google Scholar]
- 12.Merel P, Hoang-Xuan K, Sanson M, Moreau-Aubry A, Bijlsma EK, Lazaro C, Moisan JP, Resche F, Nishisho I, Estivill X, Delattre JY, Poisson M, Theillet C, Hulsebos T, Delattre O, Thomas G: Predominant occurrence of somatic mutations of the NF2 gene in meningiomas and schwannomas. Genes Chromosom Cancer 1995, 13:211-216 [DOI] [PubMed] [Google Scholar]
- 13.De Vitis LR, Vitelli ATF, Mennonna FAP, Montali UBE, Papi L: Screening for mutations in the neurofibromatosis type 2 (NF2) gene in sporadic meningiomas. Hum Genet 1996, 97:632-637 [DOI] [PubMed] [Google Scholar]
- 14.Gutmann DH, Giordano MJ, Fishback AS, Guha A: Loss of merlin expression in sporadic meningiomas, ependymomas, and schwannomas. Neurology 1997, 49:267-270 [DOI] [PubMed] [Google Scholar]
- 15.Tse JY, Ng HK, Lo KW, Chong EY, Lam PY, Ng EK, Poon WS, Huang DP: Analysis of cell cycle regulators: p16INK4A, pRb, and CDK4 in low- and high-grade meningiomas. Hum Pathol 1998, 29:1200-1207 [DOI] [PubMed] [Google Scholar]
- 16.Gutmann DH, Donahoe J, Perry A, Lemke L, Gorse K, Kittiniyom K, Rempel SA, Gutierrez JA, Newsham IF: Loss of DAL-1, a protein 4.1-related tumor suppressor, is an important early event in the pathogenesis of meningioma. Hum Mol Genet 2000, 9:1495-1500 [DOI] [PubMed] [Google Scholar]
- 17.Perry A, Cai DX, Scheithauer BW, Swanson PE, Lohse CM, Newsham IF, Weaver A, Gutmann DH: Merlin, DAL-1, and progesterone receptor expression in clinicopathologic subsets of meningioma: a correlative immunohistochemical study of 175 cases. J Neuropathol Exp Neurol 2000, 59:872-879 [DOI] [PubMed] [Google Scholar]
- 18.Bostrom J, Meyer-Puttlitz B, Wolter M, Blaschke B, Weber RG, Lichter P, Ichimura K, Collins VP, Reifenberger G: Alterations of the tumor suppressor genes CDKN2A (p16INK4a), p14ARF, CDKN2B (p15INK4b), and CDKN2C (p18INK4c) in atypical and anaplastic meningiomas. Am J Pathol 2001, 159:661-669 [DOI] [PMC free article] [PubMed] [Google Scholar]
- 19.Cai DX, James CD, Scheithauer BW, Couch FJ, Perry A: PS6K amplification characterizes a small subset of anaplastic meningiomas. Am J Clin Pathol 2001, 115:213-218 [DOI] [PubMed] [Google Scholar]
- 20.Khan J, Wei JS, Ringner M, Saal LH, Ladanyi M, Westermann F, Berthold F, Schwab M, Antonescu CR, Peterson C, Meltzer PS: Classification and diagnostic prediction of cancers using gene expression profiling and artificial neural networks. Nat Med 2001, 7:673-679 [DOI] [PMC free article] [PubMed] [Google Scholar]
- 21.Hedenfalk I, Duggan D, Chen Y, Radmacher M, Bittner M, Simon R, Meltzer P, Gusterson B, Esteller M, Kallioniemi OP, Wilfond B, Borg A, Trent J: Gene-expression profiles in hereditary breast cancer. N Engl J Med 2001, 344:539-548 [DOI] [PubMed] [Google Scholar]
- 22.Sorlie T, Perou CM, Tibshirani R, Aas T, Geisler S, Johnsen H, Hastie T, Eisen MB, van de Rijn M, Jeffrey SS, Thorsen T, Quist H, Matese JC, Brown PO, Botstein D, Eystein Lonning P, Borresen-Dale AL: Gene expression patterns of breast carcinomas distinguish tumor subclasses with clinical implications. Proc Natl Acad Sci USA 2001, 98:10869-10874 [DOI] [PMC free article] [PubMed] [Google Scholar]
- 23.Mahadevappa M, Warrington JA: A high-density probe array sample preparation method using 10- to 100-fold fewer cells. Nature Biotechnol 1999, 17:1134-1136 [DOI] [PubMed] [Google Scholar]
- 24.Watson MA, Perry A, Budhjara V, Hicks C, Shannon WD, Rich KM: Gene expression profiling with oligonucleotide microarrays distinguishes World Health Organization grade of oligodendrogliomas. Cancer Res 2001, 61:1825-1829 [PubMed] [Google Scholar]
- 25.User Bulletin no 2: ABI PRISM 7700 Detection System, Relative Quantitation of Gene Expression. P/N 4303859B. Foster City, Applied Biosystems, 2001
- 26.Hamalainen HK, Tubman JC, Vikman S, Kyrola T, Ylikoski E, Warrington JA, Lahesmaa R: Identification and validation of endogenous reference genes for expression profiling of T helper cell differentiation by quantitative real-time RT-PCR. Anal Biochem 2001, 299:63-70 [DOI] [PubMed] [Google Scholar]
- 27.SYBR Green PCR and RT-PCR Reagents Protocol. P/N 4304965revB. Foster City, Applied Biosystems
- 28.McCutcheon IE, Flyvberg A, Hill H, Li J, Bennett WF, Scarlett JA, Friend KE: Antitumor activity of the growth hormone receptor antagonist pegvisomant against human meningiomas in nude mice. J Neurosurg 2001, 94:487-492 [DOI] [PubMed] [Google Scholar]
- 29.Detta A, Kenny BG, Nordqvist AC, Peyrard M, Pettersson H, Mathiesen T, Collins VP, Dumanski JP, Schalling M: A high ratio of insulin-like growth factor II/insulin-like growth factor binding protein 2 messenger RNA as a marker for anaplasia in meningiomas. Cancer Res 1997, 57:2611-2614 [PubMed] [Google Scholar]
- 30.Murphy M, Pykett MJ, Harnish P, Zang KD, George DL: Identification and characterization of genes differentially expressed in meningiomas. Cell Growth Differ 1993, 4:715-722 [PubMed] [Google Scholar]
- 31.Harland SP, Kue RE, Pickard JD, Davenport AP: Expression of endothelin (A) receptors in human gliomas and meningiomas, with high affinity for the selective antagonist PD156707. Neurosurgery 1998, 43:890-898 [DOI] [PubMed] [Google Scholar]
- 32.Littlewood-Evans AJ, Bilbe G, Bowler WB, Farley D, Wlodarski B, Kokubo T, Inaoka T, Sloane J, Evans DB, Gallagher JA: The osteoclast-associated protease cathepsin K is expressed in human breast carcinoma. Cancer Res 1997, 57:5386-5390 [PubMed] [Google Scholar]
- 33.Mashour GA, Ratner N, Khan GA, Wang HL, Martuza RL, Kurtz A: The angiogenic factor midkine is aberrantly expressed in NF1-deficient Schwann cells and is a mitogen for neurofibroma-derived cells. Oncogene 2001, 20:97-105 [DOI] [PubMed] [Google Scholar]
- 34.Chu K, Zingg HH: The nuclear orphan receptors COUP-TFII and Ear-2 act as silencers of the human oxytocin gene promoter. J Mol Endocrinol 1997, 19:163-172 [DOI] [PubMed] [Google Scholar]
- 35.Blankenstein MA, Verheijen FM, Jacobs JM, Donker TH, van Duijnhoven MW, Thijssen JH: Occurrence, regulation, and significance of progesterone receptors in human meningioma. Steroids 2000, 6:795-800 [DOI] [PubMed] [Google Scholar]
- 36.Tseng Y-H, Vicent D, Zhu J, Niu Y, Adeyinka A, Moyers JS, Watson PH, Kahn CR: Regulation of growth and tumorigenicity of breast cancer cells by the low molecular weight GTPase Rad and Nm23. Cancer Res 2001, 61:2071-2079 [PubMed] [Google Scholar]
- 37.Banerji L, Glassford J, Lea NC, Thomas NS, Klaus GG, Lam EW: BCR signals target p27(Kip1) and cyclin D2 via the PI3-K signaling pathway to mediate cell cycle arrest and apoptosis of WEHI 231 B cells. Oncogene 2001, 20:7352-7367 [DOI] [PubMed] [Google Scholar]
- 38.Maillo A, Diaz P, Sayagues JM, Blanco A, Tabernero MD, Ciudad J, Lopez A, Goncalves JM, Orfao A: Gains of chromosome 22 by fluorescence in situ hybridization in the context of an hyperdiploid karyotype are associated with aggressive clinical features in meningioma patients. Cancer 2001, 92:377-385 [DOI] [PubMed] [Google Scholar]
- 39.Shaulian E, Karin M: AP-1 in cell proliferation and survival. Oncogene 2001, 20:2390-2400 [DOI] [PubMed] [Google Scholar]