

Abstract
Several mouse models of human prostate cancer were studied to identify and characterize potential precursor lesions containing foci of atypical epithelial cells. These lesions exhibit a sequence of changes suggesting progressive evolution toward malignancy. Based on these observations, a grading system is proposed to classify prostatic intraepithelial neoplasia (PIN) in genetically engineered mice (GEM). Four grades of GEM PIN are proposed based on their architecture, differentiation pattern, and degree of cytological atypia. PIN I lesions have one or two layers of atypical cells. PIN II has two or more layers of atypical cells. PIN III has large, pleomorphic nuclei with prominent nucleoli and the cells tend to involve the entire lumen with expansion of the duct outlines. PIN IV lesions contain atypical cells that fill the lumen and bulge focally into, and frequently compromise, the fibromuscular sheath. Within the same cohorts, the lower grade PINs first appear earlier than the higher grades. Morphometric and immunohistochemical analyses confirm progressive change. Although the malignant potential of PIN IV in mice has not been proven, GEM PIN is similar to human PIN. This PIN classification system is a first step toward a systematic evaluation of the biological potential of these lesions in GEM.
The frequency of prostate cancer has been increasing. 1 Afflicting 10% of men older than the age of 65, it represents the most frequently diagnosed cancer in American men, with an even higher incidence in the African-American population. Many investigators have tried to identify prognostic markers that distinguish indolent versus aggressive forms of prostate cancer, and to understand the genetic factors that evoke prostate cancer initiation and progression. 2 Animal models have been developed to study the potential relationship of molecular mechanisms and clinical progression. 3-5 The earlier models included xenograph and hormone induction models. 3,6,7 Recently, transgenic and knockout models have become available. 3-5,8 The most widely used models involve the SV40-Tag gene behind various types of prostate-targeting promoters. 9-17 These models involve a rapidly progressive, poorly differentiated, and metastatic neoplasm. The early lesions display varying degrees of epithelial atypia. 9-12 The later lesions in some models frequently involve the entire epithelium. These lesions have been characterized and a tentative grading system has been developed under the heading of prostatic intraepithelial neoplasia (PIN). 18
More recently, other mouse models of human prostate cancers have been developed using knockouts or transgenes other than the SV40-Tag. 3 These models develop a more indolent proliferative disease that rarely progresses to invasive carcinoma. 19 They do, however, develop a variety of foci with atypical cells that are quite different from those observed in the SV40-Tag-based models.
We have studied the intraepithelial lesions occurring in nine of these models and have observed a continuum of structural and cytological changes that suggest increased severity and, thus, neoplastic progression. We have created a system to grade these lesions to assist others to evaluate their genetically engineered mice (GEM) models of prostate cancer. We describe and illustrate here, using examples from a single model (Nkx3.1−/− × PTEN+/−), our proposed grading system, and the evidence to support progressive change as potentially useful guidelines for other investigators.
Materials and Methods
Prostatic Tissue
All samples were obtained from the University of California, Davis Center for Comparative Medicine Mutant Mouse Archives. The Mutant Mouse Archives contains a collection of paraffin blocks and slides cataloged, processed, and stored at the Center for Comparative Medicine. The samples were sent by our various collaborators either as wet tissues fixed in formalin or an alcohol-based fixative or as tissue blocks. The largest, most comprehensive collection involves studies of Nkx3.1, 19 PTEN, 20 p27 21 and p53 and hybrid crosses among these four genotypes. Samples of prostate from H-ras (N. Schreiber-Agus, unpublished data), Mxi, 22 PTEN, 20 p53 mutant, FGF8 23 and PyV-mT 24 mice were also available for examination. For consistency, we are illustrating the criteria using a single model system, the Nkx3.1−/− × PTEN +/− mice. 25
Whole Mounts
Whole mounts illustrated here were fresh dissections of mouse prostate were photographed using an Olympus S2410 steromicroscope and photo-controller (Melville, NY); images were input using a Kodak RFS 2035 (Rochester, NY) slide scanner and composited in Adobe Photoshop 6.0 (San Jose, CA).
Immunohistochemical Staining
Immunohistochemistry was performed on 4-μm paraffin sections mounted on Superfrost/Plus slides (Fisher Scientific, Pittsburgh, PA), deparaffinized, and cleared. Endogenous peroxidase was blocked in a solution of 3% hydrogen peroxide (H2O2) in methanol. Antigen retrieval was performed by high-temperature (microwave) incubation in 0.01 mol/L of citric acid buffer (pH 6.0) for 3 × 4 minutes. Slides were cooled for 10 minutes in citric acid buffer then transferred to phosphate-buffered saline (pH 7.4). The sections were incubated 20 minutes in a humidified chamber in 10% normal horse serum (Vector Laboratories, Burlingame, CA). Slides were incubated in primary antibody solution and were incubated in a humidified chamber overnight at room temperature. Control slides were run without primary antibody. Immunohistochemistry for smooth muscle actin (SMA) was performed using a 1:1000 diluted mouse monoclonal primary antibody (A2537; Sigma, St. Louis, MO). The Animal Research Kit (DAKO, Carpinteria, CA) with peroxidase was used as amplification system according to manufacturer’s instructions. The slides were stained for cytokeratin (CK) 8 and CK14 using 1:200 diluted polyclonal sheep primary antibody (PH182 and PH503; Binding Site, San Diego CA), E-cadherin 1:800 (c20820, Trand.), laminin 1:1000 (L9393, Sigma), Ki67 1:1800 (CLKi67, Novocastro, Newcastle, UK), androgen receptor 1:1000(06-686; Upstate Biotechnologies, Lake Placid, NY) were incubated as above. The Vectastain ABC Elite Kit (Vector Laboratories) was used as amplification system according to manufacturer’s instructions. Slides were counterstained in Mayer’s hematoxylin, dehydrated, cleared, and coverslipped.
Morphometrics
Appropriate paraffin sections containing normal as well as abnormal prostate were stained for DNA using the standard Feulgen protocol. 26 Areas of interest were selected to exemplify the four grades of PIN, normal prostate luminal cells or normal lymphocytes. Images of area of interest were captured at ×40 using an Olympus BX45 microscope (Olympus, Melville, NY) equipped with a DVC digital color 1300C camera (DVC, Austin, TX) at a resolution of 1300 × 1030 pixels and 10 bits per color. Total samples of 329 normal, 205 PIN I, 305 PIN II, 220 PIN III, and 162 PIN IV nuclei were used. The images were acquired into Photoshop with the DVC Twain driver on a PC running Windows NT. The color depth was lowered from 10 bits/channel to 8 bits/channel for image analysis. The images were analyzed using Image Pro by Media Cybernetics (Carlsbad, CA). The selected areas of interest nuclei were measured for nuclear area, mean nuclear density, and the integrated optical density. The raw data were exported to Excel (Microsoft, Seattle, WA) for mathematical and statistical analysis. The relative DNA content was determined by multiplying the integrated optical density by the square root of the nuclear area 26 and all values were plotted using Excel’s histogram function.
Results
Atypical Hyperplasia
Many mice, including some elderly wild-type male controls, have increased numbers of prostatic epithelial cells with scattered cells that have enlarged, hyperchromatic nuclei. However, they generally do not have the abundant cytoplasm and other cytoplasmic changes described below. Further, the scattered atypical cells do not stand out from the general population as discrete foci. These changes are referred to here as hyperplasia, with atypia or atypical hyperplasia.
Prostate Intraepithelial Neoplasia (PIN)
Focal atypical lesions of the prostatic epithelium have been described in several models. As indicated, we have either developed or have access to at least nine mouse models of human prostate neoplasia and have studied others in slide sets developed for meeting workshops. These models include knockouts or transgenic mice from ras, Mxi, PTEN, p53 mutant, FGF8, and PyV-mT. Since detailed descriptions of some of these models are not yet published, we have chosen to illustrate the proposed criteria for GEM PIN using a single model system that we have thoroughly studied, the Nkx3.1−/− × PTEN+/− mutant mice. 25 These mice progress to a relatively more severe phenotype that has been described and illustrated in some detail. 25
Whole Mounts
Stained or unstained whole mount preparations can be used to visualize and enumerate the atypical lesions in the mouse prostate. Whole mounts of mice with PIN demonstrate small masses scattered in the different lobes (Figure 1) ▶ . These masses varied in size. Microscopic examination verified that these masses were PIN lesions.
Figure 1.

Whole mounts showing examples of dissected, unfixed, and unstained coagulating glands from a normal prostate from a 23-week-old GEM Nkx3.1+/− × PTEN+/− male (A) and a 23-week-old GEM Nkx3.1−/− × PTEN+/− male with nodular foci of PIN (B). Note the dark masses in B (arrows) that show the areas of cellular proliferation. The bulging profiles of the foci are consistent with GEM PIN III or IV. This type of visualization provides information about the number and volume of the lesions.
Description of PIN
Foci of atypical cells were found in the prostatic lobes. However, in the models studied here, they were concentrated in the ducts of the coagulating gland and dorsolateral glands. The foci varied in the number of cell layers, the degree and pattern of atypia, and the relation to the fibromuscular stroma. The younger mice generally had fewer and less severe atypia. The low-grade lesions in younger mice did not necessarily occur in the context of more severe lesions. In contrast, prostate ducts with more severe atypia inevitably had less severe lesions. These observations implied a morphological continuum between the less and the more severe lesions. For the purpose of future studies, the lesions were classified into discrete classes fitting the criteria described below.
PIN I
Relatively small foci with one or two layers of atypical cells. The fibromuscular stroma is intact and the duct profile is undisturbed. The cells are generally more columnar, larger, and taller than adjacent normal cells. They have abundant pale cytoplasm with hyperchromatic but minimally pleomorphic nuclei (Figure 2, A and B) ▶ .
Figure 2.
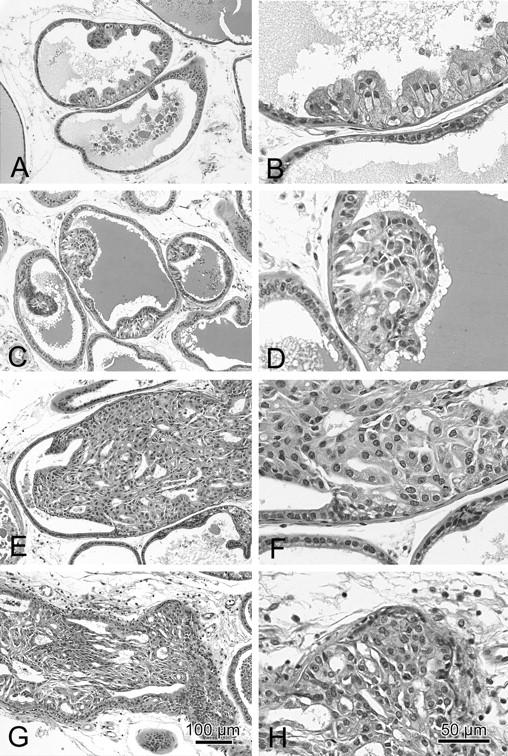
A panel of H&E-stained slides from a Nkx3.1−/− × PTEN+/− mouse with low-magnification images (A, C, E, and G) and higher magnification images (B, D, F, and H) illustrating the histological and cytological patterns of PIN I (A and B), PIN II (C and D), PIN III (E and F), and PIN IV (G and H). These images show the details of the criteria for each grade described in the text. Scale bars document the magnification (G and H).
PIN II
Larger foci with two or more layers of atypical cells that do not fill the lumen. The fibromuscular sheath is intact and the duct profile is undisturbed. The epithelial cells may have papillary, cribriform, or tufting patterns. The atypical cells are tall columnar with abundant pale pink cytoplasm with increasing but not severe nuclear pleomorphism and hyperchromasia. Increasing proportions of nuclei are larger and have vesicular chromatin patterns (Figure 2, C and D) ▶ .
PIN III
The foci of atypical cells fill, or almost fill, the lumen of the ducts. The diameter of the glands may be enlarged but the fibromuscular sheath is present and the gland outline is smooth. The epithelial cells may have papillary, cribriform, or tufting patterns that are frequently associated with small intraepithelial blood vessels. PIN III lesions may extend along the duct to involve adjacent ducts. The atypical cells are frequently poorly oriented with abundant relatively pale cytoplasm with increasingly severe nuclear pleomorphism and hyperchromasia. The nuclear to cytoplasmic ratio is inverted. Mitotic figures are present. Variable host responses are present with some inflammation and foamy macrophages (Figure 2, E and F) ▶ .
PIN IV
The foci of atypical cells fill the lumen of the ducts. The profiles of the ducts are distorted and irregular with bulging profiles. The fibromuscular sheath is irregular or absent in most areas. However, the epithelium continues to be surrounded by a layer of laminin. The epithelial cells may have solid, cribriform, or tufting patterns that are associated with small intraepithelial blood vessels. Central necrosis may also be present. PIN IV level lesions extend along the duct to involve adjacent ducts. The atypical cells are poorly oriented with abundant pale cytoplasm and with increasingly severe nuclear pleomorphism and hyperchromasia. The nuclear to cytoplasmic ratio is inverted. Mitotic figures are present. Host inflammatory responses are marked with lymphocytes and macrophages (Figure 2, G and H) ▶ .
Immunohistochemistry
The patterns of the immunohistochemical stains varied with the grade of PIN suggesting progressive cytoplasmic change.
SMA (Figure 3A) ▶
Figure 3.
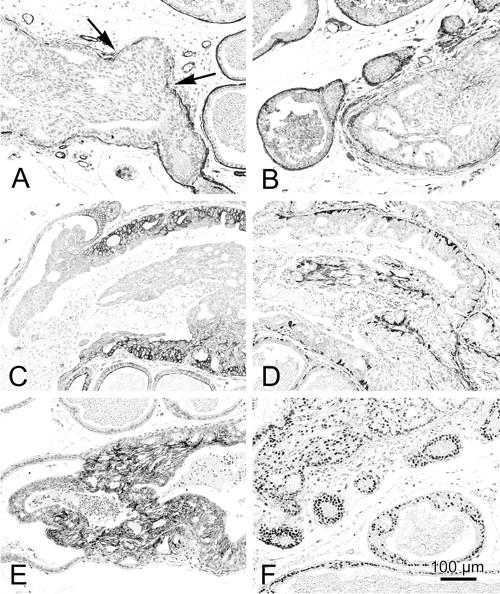
A panel of images from Nkx3.1−/− × PTEN+/− mice illustrating the immunohistochemical distribution of SMA (A), laminin (B), CK8 (C), CK14 (D), E-cadherin (E), and androgen receptors (F) in normal and PIN. The SMA (A) and laminin (B) are discontinuous or missing (A, arrows) around PIN IV lesions. The CK8 (C) is highly expressed in PIN III and PIN IV (C) with a displacement of the stain from the basolateral membranes in normal cell to a diffuse cytoplasmic stain in PIN III and IV. E-cadherin is also up-regulated in the higher grade PIN (E). The basal cells are identified by anti-CK14 (D). Note that they are increased in PIN lesions. Androgen receptors are also prominent in PIN (F).
The SMA stain was most intense in the continuous fibromuscular layer surrounding the normal ducts. The staining was variable but continuous around areas with PIN I, II, or III lesions but became discontinuous or absent around PIN IV lesions. In addition, SMA identified small intraepithelial blood vessels in PIN III and PIN IV lesions.
Laminin (Figure 3B) ▶
Basement membrane as identified by laminin staining was present around normal ducts and all grades of PIN but tended to be fragmented around PIN IV lesions.
CK8 (Figure 3C) ▶
The luminal cells of the normal prostate had weak membrane stains with the anti-CK8 antibodies. All of the PIN cells had a much stronger, cytoplasmic CK8 stain. The intensity of the CK8 stain permitted the rapid identification of atypical foci.
CK14 (Figure 3D) ▶
The basal cells are relatively sparse in the normal mouse prostate but can be identified by thin elongated, CK14-positive strands of cytoplasm. The CK14-positive basal cells did not increase in PIN I but were increased in number and size in all higher grades. The CD14-positive cells became haphazardly arranged in the PIN IV lesions that bulged into the stroma.
E-Cadherin (Figure 3E) ▶
The luminal cells of the normal prostate reacted weakly along the lateral membranes with the anti-E-cadherin antibody. All PIN cells had a more intense stain. As with other reactions, the most intense reaction was observed in the bulging, PIN IV lesions.
Androgen Receptors (Figure 3F) ▶
Many but not all normal cells had a nuclear reaction to the anti-androgen receptor antibody. In contrast, all PIN cells were strongly positive for androgen receptor. The nuclei with an open vesicular chromatin had the strongest reaction.
Ki-67
No Ki-67-positive cells were identified in the normal prostate cells (data not shown). This is consistent with the low-proliferative index of the normal mouse prostate. Scattered Ki-67-positive cells were found in PIN I and PIN II lesions. In contrast, eight to nine cells per high-powered field were Ki-67-positive in PIN III and PIN IV lesions, consistent with the observed increase in mitotic figures.
Morphometric Analysis
A number of measurements of nuclear morphology and DNA content were taken from the same slides that are used to illustrate PIN in this manuscript. The goal was to determine whether the morphometric measurements could verify and extend our visual interpretations. Because the interpretation of morphometric differences between slides is compounded by differences in section thickness, fixation, stain intensity, and other factors, all analyses were performed on the same slide. The normal control values were also taken from morphologically normal luminal cells on the same slide.
In all cases, the nuclear area (Figure 4A) ▶ and the DNA content (Figure 4B) ▶ of normal prostatic epithelium and PIN I cells were indistinguishable even though the PIN I cells were larger and had cytoplasmic immunohistochemistry stains that identified them as atypical. The nuclear area of PIN II cells had distinctive bimodal peaks. The first peak had basically the same area as the PIN I and normal cells. The second peak and its extension had areas covered by the majority of the cells in the PIN IV population. PIN III also exhibited two peaks of nuclear area. The nuclear area of PIN IV cells was distinctly shifted to the right with the majority of cells having a nuclear area well outside the normal range. The range of nuclear area of the PIN IV cells matched those of adenocarcinoma (data not shown).
Figure 4.

Graphs representing the results of the morphometric analysis of DNA content (A) and nuclear size (B). The DNA content is normalized for relative area using Bins formula. 26 Note that normal, PIN I, and PIN II have relatively similar nuclear size and DNA content. Also note that the relative DNA increases with the grade of PIN (A). The nuclear size also increases with the PIN grade (B). This analysis confirms the visual impressions and suggests that the grading system is consistent with the changes in the nuclear size and DNA content.
The DNA content, adjusted for nuclear area, exhibited similar properties with the PIN I and normal cells having similar DNA content with PIN II, PIN III, and PIN IV having increasing DNA content, well outside the range of normal.
Biological Evolution
Because the atypical foci are only sporadically associated with invasion, biological progression to malignancy is difficult to document. However, it was noted that the lesions in younger animals in these cohorts of animals are first associated with hyperplasia with scattered atypical cells. The smaller PIN I and PIN II lesions appear in the prostates of younger at-risk mice before the first PIN III or PIN IV lesions appear. The PIN III and PIN IV lesions rarely appear in animals that do not have PIN I or PIN II lesions (Figure 5) ▶ .
Figure 5.

Histograms representing the relative proportions of diffuse atypical hyperplasia (AH) and PIN I to PIN IV in a single cohort of 43 Nkx3.1−/− × PTEN+/− males sacrificed at different ages. Note the relative increases in the higher grade PIN with age.
An analysis of the GEM PIN kinetics from a single 43 animal cohort of Nkx3.1−/− × PTEN+/− males is shown in Figure 5 ▶ . Young mice (>3 months) had few PIN lesions (n = 7). Note that in this example all of the mice had abnormalities of their prostate after 6 months of age (n = 14). By 9 months of age (n = 17), an increasing percentage of the prostates had PIN III and PIN IV and at 12 months of age (n = 5), all of the samples from the cohort had at least PIN III. This cohort has been previously presented in the context of a larger experimental group. 25
Discussion
PIN is thought to be a precursor to invasive carcinoma in humans because it is strongly associated with the malignant disease. 27,28 Evidence linking PIN to cancer is several fold. First, PIN lesions are primarily found in the peripheral zone, in proximity to the invasive carcinoma. 29 Second, the appearance of high-grade PIN lesions generally precedes the appearance of carcinoma by at least 10 years, consistent with the concept of neoplastic progression. 30 Third, allelic imbalance analysis has shown that PIN lesions are oligoclonal and multifocal. Moreover, the chromosomal abnormalities found in PIN resemble those found in early invasive carcinoma, although they are less prevalent. 31,32 Fourth, the architectural and cytological features of PIN resemble those of invasive carcinoma, including the progressive loss of the basal cell layer. 33 The basement membrane is normally intact in PIN and in well-differentiated adenocarcinoma.
The purpose of this study is to define a set of criteria for classifying GEM PIN in those GEM models of human prostate cancer that are not related to the SV40-Tag. We emphasize that the criteria illustrated here using one model can, in our experience, be applied to similar prostatic lesions in a wide variety of non-SV40-Tag mouse models. We further suggest these recommended criteria be tested in all non-SV40-Tag models.
Potential precursor lesions for the SV40-Tag models have been previously described. 9-12,18 The criteria presented here are based on our studies of more than nine GEM models that included Nkx3.1+/−, Nkx3.1−/−, PTEN+/−, p27−/−, p53−/−, and hybrid crosses among these five genotypes. Samples of prostate from H-ras, p53 mutant, FGF8, and PyV-mT mice were also available for examination. In addition, the study slide set assembled for the recent Mouse Models of Human Prostate Cancer at the Jackson Laboratory was also available for examination. In our experience, all of the current non-Tag models present with very similar atypical morphological lesions. We have, however, chosen to illustrate our criteria using samples from a single model (Nkx3.1−/− × PTEN+/−) for consistent and reproducible examples. 25 The most complete and extensive collection of samples was available in this model and the Nkx3.1−/− × PTEN+/− animals displayed the highest number of the most severe lesions in our collection.
One of the critical issues is that, in contrast to the SV40-Tag models, the non-Tag models rarely progress to invasive carcinoma. Without definitive evidence of progression to invasive behavior, the use of the term PIN might be questioned. However, the evidence offered here suggests that these lesions undergo measurable and progressive changes in their architecture, nuclei, and cytoplasm. Because these atypical lesions either express a transgene or are the result of allelic insufficiency, they must also be regarded as genetically altered foci. Although the incidence of invasive neoplasms is low, it is much higher than in the background strains. These structural and genetic changes suggest that these lesions are autonomous new growths, that is, neoplasms. The current evidence, therefore, supports the notion that they are compatible with an intraepithelial neoplasm of the prostate. Thus, the use of the term PIN is justified until further evidence is accumulated.
If, as suggested here and in the discussion of the pathology workshop at the Jackson Meeting, GEM PIN is defined as any foci of atypical cells within the prostate that have evidence of neoplastic progression, the evidence for neoplastic progression must be explicit. The atypical foci described here differ from normal in their morphological appearance, the organization of the nuclear and cytoplasmic markers, the amount of cell proliferation, the size of the nuclei, the amount of DNA, and relationship with the stroma. Further, the atypical changes fit a morphological, morphometric and chronological continuum that implies progressive neoplastic changes. This combination of morphological atypia and biological progression fulfills the criteria of PIN.
The lack of progression to invasive neoplasia makes it difficult to prove that the atypical lesions are progressive or have malignant potential. It is possible, however, that the environment of the mouse prostate, with its low rate of proliferation, suppresses progression in all but the most aggressive models. However, the ultimate documentation of malignant potential might be transplantation beneath the renal capsule allowing progression to malignancy. 34 Similar studies have been done to demonstrate the malignant potential of Nkx3.1−/− × PTEN+/− cells. 35
We have, however, attempted to use and illustrate another approach to documenting progressive changes in model systems that have little or no evidence of progression to invasive disease within the animal. For simplicity of communication, a simplified grading system has been proposed that correlates with objective morphological and cytological changes suggesting progression. This approach is offered in hope that it might assist others in their model evaluation, introduce a standard approach, present a controlled vocabulary, and allow comparisons with other models. This, in our opinion, is an initial step in defining rigorous criteria for GEM PIN. As the biological information evolves, the criteria recommended here may be modified to more accurately reflect the biology of the model systems.
The lesions described here are quite different from those observed by us and by others 9-12,15,18 in the SV40-Tag mice. The PIN lesions in SV40-Tag are much more diffuse with more compact, hyperchromatic nuclei and an inverted nuclear/cytoplasmic ratio. The non-Tag PINs are, in our experience, far less aggressive and have larger nuclei with a more open, vesicular chromatin and more abundant cytoplasm. The prominent nucleoli in these cells are reminiscent of the prominent nucleoli in human PIN and adenocarcinoma. Like the human disease the lesions in GEM PIN show evidence of progressive morphological disease suggesting that, under appropriate conditions, they will evolve into malignant neoplasms. However, in the models described here, these conditions for full malignancy have not been met. Because the mouse prostate glands are structurally and cytologically quite different from the human prostate, it is not surprising that the neoplasms in the two species would be structurally different. We hope that the description and classification provided here will assist others with the classification and study of their own GEM models.
Acknowledgments
We thank Mr. Robert Munn for the image capture and processing, and the many collaborators who have generously provided the UCD Mutant Mouse Archives with their samples for analysis, including, in part, samples provided by Drs. Philip Leder, Nicole Agus-Schreiber, Pradip Roy-Burman, Pier Paolo-Pandolfi, Peter Barry, and David Morris. We appreciate the opportunity to study the mouse prostate slide set developed by Dr. Scott Shappell for The National Cancer Institute’s Mouse Models of Human Cancer Consortium Workshop on Mouse Models of Human Prostate Cancer. We also appreciate insights provided by the workshop participants during the discussions of GEM PIN led by Dr. Scott Shappell.
Footnotes
Address reprint requests to Robert D. Cardiff, M.D., Ph.D., Professor of Pathology, Center for Comparative Medicine, County Road 98 and Hutchison Dr., University of California, Davis, Davis, CA 95616. E-mail: rdcardiff@ucdavis.edu.
Supported by grants UO1 CA84294 from the National Cancer Institutes and U42-RR14905 from National Institutes of Health.
References
- 1.Coffey DS: Prostate cancer. An overview of an increasing dilemma. Cancer 1993, 71:880-886 [DOI] [PubMed] [Google Scholar]
- 2.Gopalkrishnan RV, Kang DC, Fisher PB: Molecular markers and determinants of prostate cancer metastasis. J Cell Physiol 2001, 189:245-256 [DOI] [PubMed] [Google Scholar]
- 3.Abate-Shen C, Shen MM: Molecular genetics of prostate cancer. Genes Dev 2000, 14:2410-2434 [DOI] [PubMed] [Google Scholar]
- 4.Castrillon DH, DePinho RA: Modeling prostate cancer in the mouse. Adv Cancer Res 2001, 82:187-204 [DOI] [PubMed] [Google Scholar]
- 5.Huss WJ, Hanrahan CF, Barrios RJ, Simons JW, Greenberg NM: Angiogenesis and prostate cancer: identification of a molecular progression switch. Cancer Res 2001, 61:2736-2743 [PubMed] [Google Scholar]
- 6.van Weerden WM, Romijn JC: Use of nude mouse xenograft models in prostate cancer research. Prostate 2000, 43:263-271 [DOI] [PubMed] [Google Scholar]
- 7.Thompson TC, Timme TL, Park SH, Yang G, Ren C: Mouse prostate reconstitution model system: a series of in vivo and in vitro models for benign and malignant prostatic disease. Prostate 2000, 43:248-254 [DOI] [PubMed] [Google Scholar]
- 8.Sharma P, Schreiber-Agus N: Mouse models of prostate cancer. Oncogene 1999, 18:5349-5355 [DOI] [PubMed] [Google Scholar]
- 9.Yoshidome K, Shibata MA, Maroulakou IG, Liu ML, Jorcyk CL, Gold LG, Welch VN, Green JE: Genetic alterations in the development of mammary and prostate cancer in the C3(1)/Tag transgenic mouse model. Int J Oncol 1998, 12:449-453 [PubMed] [Google Scholar]
- 10.Shibata MA, Ward JM, Devor DE, Liu ML, Green JE: Progression of prostatic intraepithelial neoplasia to invasive carcinoma in C3(1)/SV40 large T antigen transgenic mice: histopathological and molecular biological alterations. Cancer Res 1996, 56:4894-4903 [PubMed] [Google Scholar]
- 11.Shibata MA, Jorcyk CL, Liu ML, Yoshidome K, Gold LG, Green JE: The C3(1)/SV40 T antigen transgenic mouse model of prostate and mammary cancer. Toxicol Pathol 1998, 26:177-182 [DOI] [PubMed] [Google Scholar]
- 12.Maroulakou IG, Anver M, Garrett L, Green JE: Prostate and mammary adenocarcinoma in transgenic mice carrying a rat C3(1) simian virus 40 large tumor antigen fusion gene. Proc Natl Acad Sci USA 1994, 91:11236-11240 [DOI] [PMC free article] [PubMed] [Google Scholar]
- 13.Greenberg NM, DeMayo F, Finegold MJ, Medina D, Tilley WD, Aspinall JO, Cunha GR, Donjacour AA, Matusik RJ, Rosen JM: Prostate cancer in a transgenic mouse. Proc Natl Acad Sci USA 1995, 92:3439-3443 [DOI] [PMC free article] [PubMed] [Google Scholar]
- 14.Green JE, Shibata MA, Yoshidome K, Liu ML, Jorcyk C, Anver MR, Wigginton J, Wiltrout R, Shibata E, Kaczmarczyk S, Wang W, Liu ZY, Calvo A, Couldrey C: The C3(1)/SV40 T-antigen transgenic mouse model of mammary cancer: ductal epithelial cell targeting with multistage progression to carcinoma. Oncogene 2000, 19:1020-1027 [DOI] [PubMed] [Google Scholar]
- 15.Garabedian EM, Humphrey PA, Gordon JI: A transgenic mouse model of metastatic prostate cancer originating from neuroendocrine cells. Proc Natl Acad Sci USA 1998, 95:15382-15387 [DOI] [PMC free article] [PubMed] [Google Scholar]
- 16.Masumori N, Thomas TZ, Chaurand P, Case T, Paul M, Kasper S, Caprioli RM, Tsukamoto T, Shappell SB, Matusik RJ: A probasin-large T antigen transgenic mouse line develops prostate adenocarcinoma and neuroendocrine carcinoma with metastatic potential. Cancer Res 2001, 61:2239-2249 [PubMed] [Google Scholar]
- 17.Kasper S, Sheppard PC, Yan Y, Pettigrew N, Borowsky AD, Prins GS, Dodd JG, Duckworth ML, Matusik RJ: Development, progression, and androgen-dependence of prostate tumors in probasin-large T antigen transgenic mice: a model for prostate cancer. Lab Invest 1998, 78:i-xv. [PubMed] [Google Scholar]
- 18.Gingrich J, Barrios R, Foster BA, Greenberg NM: Pathologic progression of autochthonous prostate cancer in the TRAMP. Prostate Cancer Prostatic Dis 1999, 2:70-75 [DOI] [PubMed] [Google Scholar]
- 19.Bhatia-Gaur R, Donjacour AA, Sciavolino PJ, Kim M, Desai N, Young P, Norton CR, Gridley T, Cardiff RD, Cunha GR, Abate-Shen C, Shen MM: Roles for Nkx3.1 in prostate development and cancer. Genes Dev 1999, 13:966-977 [DOI] [PMC free article] [PubMed] [Google Scholar]
- 20.Di Cristofano A, Pesce B, Cordon-Cardo C, Pandolfi PP: Pten is essential for embryonic development and tumour suppression. Nat Genet 1998, 19:348-355 [DOI] [PubMed] [Google Scholar]
- 21.Di Cristofano A, De Acetis M, Koff A, Cordon-Cardo C, Pandolfi PP: Pten and p27KIP1 cooperate in prostate cancer tumor suppression in the mouse. Nat Genet 2001, 27:222-224 [DOI] [PubMed] [Google Scholar]
- 22.Schreiber-Agus N, Meng Y, Hoang T, Hou H, Jr, Chen K, Greenberg R, Cordon-Cardo C, Lee HW, DePinho RA: Role of Mxi1 in ageing organ systems and the regulation of normal and neoplastic growth. Nature 1998, 393:483-487 [DOI] [PubMed] [Google Scholar]
- 23.Wu X, Wu J, Huang J, Powell WC, Zhang J, Matusik RJ, Sangiorgi FO, Maxson RE, Sucov HM, Roy-Burman P: Generation of a prostate epithelial cell-specific Cre transgenic mouse model for tissue-specific gene ablation. Mech Dev 2001, 101:61-69 [DOI] [PubMed] [Google Scholar]
- 24.Tehranian A, Morris DW, Min BH, Bird DJ, Cardiff RD, Barry PA: Neoplastic transformation of prostatic and urogenital epithelium by the polyoma virus middle T gene. Am J Pathol 1996, 149:1177-1191 [PMC free article] [PubMed] [Google Scholar]
- 25.Kim MJ, Cardiff RD, Desai N, Banach-Petrosky WA, Parsons R, Shen MM, Abate-Shen C: Cooperativity of Nkx3.1 and Pten loss of function in a mouse model of prostate carcinogenesis. Proc Natl Acad Sci USA 2002, 99:2884-2889 [DOI] [PMC free article] [PubMed] [Google Scholar]
- 26.Bins M, Takens F: A method to estimate the DNA content of whole nuclei from measurements made on thin tissue sections. Cytometry 1985, 6:234-237 [DOI] [PubMed] [Google Scholar]
- 27.Montironi R, Mazzucchelli R, Algaba F, Lopez-Beltran A: Morphological identification of the patterns of prostatic intraepithelial neoplasia and their importance. J Clin Pathol 2000, 53:655-665 [DOI] [PMC free article] [PubMed] [Google Scholar]
- 28.Bostwick DG, Montironi R, Sesterhenn IA: Diagnosis of prostatic intraepithelial neoplasia: Prostate Working Group/consensus report. Scand J Urol Nephrol Suppl 2000, :3-10 [DOI] [PubMed] [Google Scholar]
- 29.Bostwick DG, Brawer MK: Prostatic intra-epithelial neoplasia and early invasion in prostate cancer. Cancer 1987, 59:788-794 [DOI] [PubMed] [Google Scholar]
- 30.Sakr WA, Haas GP, Cassin BF, Pontes JE, Crissman JD: The frequency of carcinoma and intraepithelial neoplasia of the prostate in young male patients. J Urol 1993, 150:379-385 [DOI] [PubMed] [Google Scholar]
- 31.Matsuyama H, Pan Y, Oba K, Yoshihiro S, Matsuda K, Hagarth L, Kudren D, Naito K, Bergerheim US, Ekman P: Deletions on chromosome 8p22 may predict disease progression as well as pathological staging in prostate cancer. Clin Cancer Res 2001, 7:3139-3143 [PubMed] [Google Scholar]
- 32.Haggman MJ, Macoska JA, Wojno KJ, Oesterling JE: The relationship between prostatic intraepithelial neoplasia and prostate cancer: critical issues. J Urol 1997, 158:12-22 [DOI] [PubMed] [Google Scholar]
- 33.Bostwick DG, Amin MB, Dundore P, Marsh W, Schultz DS: Architectural patterns of high-grade prostatic intraepithelial neoplasia. Hum Pathol 1993, 24:298-310 [DOI] [PubMed] [Google Scholar]
- 34.Wang Y, Hayward SW, Donjacour AA, Young P, Jacks T, Sage J, Dahiya R, Cardiff RD, Day ML, Cunha GR: Sex hormone-induced carcinogenesis in Rb-deficient prostate tissue. Cancer Res 2000, 60:6008-6017 [PubMed] [Google Scholar]
- 35.Kim MJ, Bhatia-Gaur R, Banach-Petrosky W, Desai N, Wang Y, Hayward SW, Cunha GR, Cardiff RD, Shen MM, Abate-Shen C: Nkx3.1 mutant mice recapitulate early stages of prostate carcinogenesis. Cancer Res 2002, 62:2999-3004 [PubMed] [Google Scholar]