

Abstract
β-catenin (β-cat) is a versatile component of homotypic cell adhesion and signaling. Its subcellular localization and cytoplasmic levels are tightly regulated by the adenomatous polyposis coli (APC) protein. Mutations in β-cat (exon 3) or APC (MCR) result in β-cat aberrant overexpression that is associated with its nuclear accumulation and improper gene activation. Data from experimental models have shown that β-cat overexpression has a multitude of effects on cell-cycle behavior. In many of these aspects its function depends on major G1 phase regulators. To the best of our knowledge, most of these issues have never been addressed concurrently in tumors. For this reason we investigated in a panel of 92 non-small-cell lung carcinomas, β-cat and APC expression, and their relationship with cell-cycle kinetics (PI and AI) and ploidy status. Moreover, the above correlations were examined in relation to the main G1/S-phase checkpoint regulators. Four β-cat immunohistochemical expression patterns [membranous (11.1%), membranous-cytoplasmic (54.3%), cytoplasmic (9.9%), cytoplasmic-nuclear (24.7%)] and three APC immunohistochemical expression patterns [cytoplasmic (37.7%), cytoplasmic-nuclear (58%), nuclear (4.3%)] were observed, which were further confirmed by Western blot analysis on subcellular fractions in representative samples. The frequent presence of β-cat in the cytoplasm is an indication of aberrant expression, whereas membranous and nuclear localization were inversely related. Absence of mutations in β-cat (exon 3) and APC (MCR) suggest that β-cat destruction mechanisms may be functional. However, expression analysis revealed attenuated levels for APC, indicating a residual ability to degrade β-cat. Decreased levels were associated with loss of heterozygosity at the APC region in 24% of the cases suggesting that additional silencing mechanisms may be involved. Interestingly, the 90-kd APC isoform associated with apoptosis, was found to be the predominant isoform in normal and cancerous lung tissues. The most important finding in our study, was the correlation of nuclear β-cat immunohistochemical localization with increased proliferation, overexpression of E2F1 and MDM2, aberrant p53, and low expression of p27KIP, providing for the first time in vivo evidence that β-cat-associated proliferation correlates with release of E2F1 activity and loss of p53- and p27KIP-dependent cell-cycle checkpoints. Loss of these checkpoints is accompanied by low levels of APC, which possibly reflects a diminished ability to degrade β-cat. Taken together our data indicate that cases with nuclear β-cat immunohistochemical expression represent a subset of non-small-cell lung carcinomas that have gained an increased proliferation advantage in contrast to the other β-cat immunohistochemical expression profiles.
Current models of carcinogenesis describe the progressive accumulation of alterations in critical genes necessary for normal cell physiology. 1 Among these are genes whose products are involved in multiple cellular functions. β-catenin (β-cat) and adenomatous polyposis coli (APC) genes represent such an example. 2
The β-cat gene maps to 3p21 and encodes a 92- to 97-kd protein, that belongs to the mammalian homologues of armadillo. 3 It participates in two disparate cellular functions. 4-7 The first one concerns homotypic cell-cell interactions, by complexing with E-cadherin (E-cad) 3,4 whereas, the second one involves signal transduction pathways that are activated by the Wnt-wingless, the integrin-associated tyrosine kinases, integrin-linked kinase (ILK), and focal adhesion kinase (FAK), as well as presenilins. 7,8
Cytoplasmic β-cat that is not incorporated in cell adhesion or signaling, is regulated by two proteasome degradation complexes. 9 The first complex, suspected to be the default mechanism, requires GSK-3β-dependent phosphorylation of β-cat at N-terminus for destruction. The second complex, responds to p53-induced cell-cycle arrest. Both mechanisms require APC as a scaffold. APC binds β-cat in the central third and not only mediates its degradation, but also regulates its subcellular localization. 10,11
An increase in β-cat cytoplasmic levels, after stimulation from Wnt or other signaling pathways, results in its nuclear accumulation. 2,4,7 There, it heterodimerizes with members of the lymphoid enhancer factor/T-cell factor family of transcription factors and activates the expression of a broad pattern of target genes. These genes include major regulators of the G1/S-phase cell-cycle transition, cell differentiation, embryonic development and other cellular functions. 2,5,7,12,13 High levels of β-cat that result from: mutations in genes coding for components of the degradation systems, mutations in β-cat, or deregulated Wnt signaling, are stabilized in the cytoplasm, leading to an increased β-cat nuclear accumulation. As a consequence β-cat exerts oncogenic activity through aberrant target gene expression. 5-7
In cellular systems β-cat oncogenic activity enhances proliferation by promoting G1/S-phase transition. 14 In one of these systems, expression of β-cat was inversely related to p27KIP. In another cellular system, deregulated β-cat activity has been shown to induce an ARF-mediated p53-dependent growth arrest. 15,16 This cellular response is partially dependent on the activity of the transcription factor E2F1. These findings suggest that β-cat manifests its oncogenic action only after loss of cell-cycle checkpoints. 16 Given that p53 also activates β-cat degradation in response to growth arrest, this prediction is further enhanced. 9,17
Interestingly, recent data have shown that ectopic overexpression of β-cat has additional cellular effects. 18-20 First it induces apoptosis, but this effect is independent of its transactivation function or the involvement of major G1-phase cell-cycle regulators. 19 Second, it attenuates cell-cycle blocks in response to genotoxic stress that might lead to accumulation of DNA damage. 14 Similar effects on cellular behavior have been apparent by APC. In normal cells APC blocks G1/S progression, 21 whereas its ectopic expression in APC-deficient colon cancer cells induces apoptosis. 22 Furthermore, APC links the ends of microtubules to chromosomal kinetochores, suggesting that mutations in APC promote chromosomal instability. 23,24
Aberrant expression of β-cat has been reported in a variety of cancers. 25 However, given its dual cellular function, different expression patterns have been reported not only among distinct types of cancer, but also between tumors of the same origin. 25-34 Membranous localization is frequently interpreted as an association with E-cad-dependent cell adhesion. In such cases loss or reduction in staining correlates with tumor dedifferentiation, infiltrative growth, metastasis, and poor prognosis. 35 On the other, nuclear and/or cytoplasmic presence has been correlated with β-cat or APC mutations. 25 In some types of tumors the later pattern is related to increased proliferation, whereas in others the opposite was observed. 26,31,33,36-41 There are few reports that examine the association of β-cat status with proliferation and in relation to cell-cycle regulatory molecules. 36-38 In some reports the membranous and the nuclear localization are inversely related. 26 It has been proposed that competition between different cellular partners for the cytoplasmic pool of β-cat influences its final incorporation either in cell adhesion or in signal transduction mechanisms. 4-7,35,42 In lung cancer there are controversial reports on the status of β-cat. 43-52 Many of these studies concern β-cat association with E-cad and their mutual impact on clinicopathological parameters. In addition, apart from two conflicting studies there is no further information regarding β-cat correlation with proliferation 44,52 and there are no reports examining its relationship with apoptosis.
Taking into consideration the above, we examined, in a series of 92 NSCLCs previously analyzed for defects in the pRb-p53-MDM2 network, p27KIP, and E2F1, 53-56 the following: 1) the status of β-cat and APC at the protein and DNA levels; 2) their relationships with the clinicopathological parameters of the patients, the kinetic parameters (proliferation and apoptosis), and genomic instability of the tumors; and finally, 3) their associations with main G1/S-phase cell-cycle regulatory molecules. To the best of our knowledge most of these issues have not been explored so far.
Materials and Methods
Tissue Samples
Frozen and formalin-fixed, paraffin-embedded material from a total of 92, surgically removed, non-small-cell lung carcinomas (NSCLCs) and adjacent normal lung tissue were analyzed. A part of this database has been previously analyzed. 53-56 These tumors were classified according to the World Health Organization criteria and tumor-node-metastasis system. Specifically, two samples of each tumor were taken. One was snap-frozen in liquid nitrogen and stored at −70°C, the other was formalin-fixed and paraffin-embedded. The patients had not undergone any chemo- or radiotherapy before surgical resection, thus avoiding deregulation of p53, pRb, and MDM2, because of DNA damage. 53,54 Clinicopathological features of the patients are presented in Table 1 ▶ .
Table 1.
Summary of Kinetic Parameters, Ploidy, and Clinicopathological Features in the Series of NSCLCs Examined
| Mv | (n) | A | SD | D | ||||
|---|---|---|---|---|---|---|---|---|
| Proliferation index (%)a | 33.55 | (86) | 10.8 | |||||
| Apoptotic index (%)b | 1.68 | (81) | 1.79 | |||||
| Growth index (%) | 43.6 | (79) | 49.0 | |||||
| Ploidy status | 48 | 37 | ||||||
| Histology | ADCs: | 41 | SCCs: | 46 | UL: | 5 | ||
| Lymph node invasion | yes: | 49 | no: | 42 | ||||
| Tumor stage | I: | 37 | II: | 29 | III: | 25 |
Abbreviations: Mv, mean value; SD, standard deviation; n, number of informative samples; A, aneuploid; D, diploid; ADC, adenocarcinoma; SCC, squamous cell carcinoma; UL, undifferentiated large carcinoma;
a, estimated by MIB-1 immunohistochemistry;
b, estimated by TUNEL assay.
Immunohistochemistry (IHC)
For each case IHC analysis was performed twice on consecutive sections.
Antibodies
For IHC analysis the following antibodies (Abs) were used: anti-β-catenin (E-5) (class, IgG1 mouse monoclonal; epitope, amino acids 680 to 781, carboxy terminus of β-catenin, human origin) (Santa Cruz, Bioanalytica, Athens, Greece), anti-APC (C-20) (class, IgG rabbit polyclonal; epitope, carboxy terminus of APC of human origin) (Santa Cruz, Bioanalytica, Athens, Greece), anti-E2F1 (KH95) (class, IgG2a mouse monoclonal; epitope, Rb-binding domain of E2F-1 p60, human origin) (Santa Cruz, Bioanalytica), anti-p53 (DO7) (IgG2b mouse monoclonal; residues 1 to 45 of human p53) (DAKO, Kalifronas, Athens, Greece), anti-MDM2 (SMP14) (class, IgG1 mouse monoclonal; epitope, residues 154 to 167 of MDM2, human origin) (Santa Cruz, Bioanalytica) and anti-Ki67 (MIB-1) (class, IgG1 mouse monoclonal; epitope, Ki-67 nuclear antigen) (Oncogene Science, Biodynamics, Athens, Greece).
Methods
IHC was performed according to the indirect streptavidin-biotin-hyperoxidase method, as previously described. 53,54 In brief, 5-μm paraffin sections were mounted on poly-l-lysine-coated slides, dewaxed, rehydrated, and incubated for 30 minutes with 0.3% hydrogen peroxide to quench the endogenous peroxidase activity. Unmasking of the antigen proteins was performed by the heat-mediated antigen retrieval method. The sections were incubated with the primary antibody at a 1:100 dilution at 4°C overnight. Biotin-conjugated secondary antibody was added at a 1:200 dilution for 1 hour at room temperature. The next stage comprised 30 minutes of incubation in StreptAB Complex (1:100 stock biotin solution, 1:100 stock streptavidin-hyperoxidase solution) (DAKO). For color development we used 3,3′-diaminobenzidine tetrahydrochloride (DAB) (Sigma, Hellas, Athens, Greece) and hematoxylin as counterstain.
Evaluation
β-Catenin Status: The staining patterns were discerned based on the following criteria 26,44 : 1) membranous pattern (M), if immunoreactivity was present solely at the cell membranes as a linear staining; 2) membranous-cytoplasmic (MC), if immunoreactivity was also present in the cytoplasm; 3) cytoplasmic (C), if immunoreactivity was restricted only to the cytoplasm; 4) cytoplasmic-nuclear (CN), if immunoreactivity was present in the cytoplasm and concomitantly in more than 20% of the nuclei; and 5) nuclear (N), if immunoreactivity was confined mainly in the nuclei. Cases with negative staining in tumor areas, but without positive signal in the surrounding stromal as well as normal areas were considered as noninformatives and were not included in the analysis.
APC Status: For APC three patterns were discerned in a similar manner as for β-cat: 1) cytoplasmic (C), 2) (CN), and 3) nuclear (N). E2F-1, p53, MDM2, and Ki-67 staining was evaluated as previously described. 53,54,56 Part of E2F-1, p53, MDM2, and Ki-67 expression status was obtained from previous studies. 53,54,56 Four independent observers (VG, AK, PZ, and KE) performed slide examination. Interobserver variability was minimal (P < 0.01).
Controls
Sections from human hepatocellular carcinomas were used as β-catenin-positive controls, as suggested by the manufacturer. The specificity of anti-APC antibody was tested by incubating the latter with the appropriate control peptide (Santa Cruz, BioAnalytica), against which it was raised. Elimination of immunostaining verified APC positivity. In addition, the Jurkat cell line was used as a positive control. For E2F-1 expression, the MCF-7 cell line (derived from breast cancer) was used as a positive control. 56 Positive controls for the remaining antibodies have been previously described. 53,54 In each set of immunoreactions antibody of the corresponding IgG fraction, but of unrelated specificity was used as a negative control.
pRB and p27 Status
The expression status of pRb and p27 were obtained from our previous studies 53,55 and represent only a part of the currently used samples (Table 2) ▶ .
Table 2.
Summary of β-Cat, APC, E2F-1, p53, MDM2, p27KIP, and pRb Status in the Series of NSCLCs Examined
| β-cat immunohistochemical evaluation (IHC) | Patterns | Groups | |||
| Membranous | M (n): | 11.1% (9) | Mem | ||
| Membranous-cytoplasmic | MC (n): | 54.3% (44) | Mem | Cy | |
| Cytoplasmic | C (n): | 9.9% (8) | Cy | ||
| Cytoplasmic-nuclear | CN (n): | 24.7% (20) | Nu | Cy | |
| APC immunohistochemical evaluation (IHC): | Patterns | Groups | |||
| Cytoplasmic | C (n): | 37.7% (26) | Cy | ||
| Cytoplasmic-nuclear | CN (n): | 58% (40) | Nu | ||
| Nuclear | N (n): | 4.3% (3) | Nu | ||
| APC LOH evaluation | (LOH/Het) | 24% (11/51) | |||
| E2F-1 status | Mv (n): | 45.5 (84) | SD: | 14.6% | |
| p27KIP statusa | Mv (n): | 32.7 (67) | SD: | 14.0% | |
| pRB statusa | Ab: | 34 | No: | 52 | |
| p53 status | P: | 51 | Ne: | 40 | |
| MDM2 status | P: | 59 | Ne: | 32 | |
Abbreviations: Mv, mean value; SD, standard deviation; n, number of informative samples; Ab, aberrant; No, normal; P, positive; Ne, negative;
a, data from our previous studies. 51, 53
Protein Extraction and Western Blot Analysis
Total Protein Extraction
Frozen tissues samples were homogenized in 50 mmol/L Hepes, pH 7.5, 150 mmol/L NaCl, 15 mmol/L β-mercaptoethanol, 0.5 mmol/L phenylmethyl sulfonyl fluoride, 0.1% Nonidet P-40 (Sigma). The homogenate was centrifuged at 3000 rpm (1000 × g) at 4°C for 5 minutes. The supernatant was collected and adjusted to 1 μg/ml aprotinin, 1 μg/ml leupeptin, and 1 μg/ml pepstatin A (Merck, Athens, Greece).
Nuclear and Membranous/Cytoplasmic Extracts
Subcellular fractions consisting of nuclear (Nuc) and membranous cytoplasmic (MC) protein extracts, were obtained from frozen tumor tissues of representative samples using nuclear and cytoplasmic extraction reagents (NE-PER; Pierce, Bioanalytica, Athens, Greece), with the addition of protease inhibitors (benzamidine, aprotinin, leupeptin, phenylmethyl sulfonyl fluoride) according to the manufacturer’s instructions.
Antibodies and Controls
The anti-APC (F-3) mouse monoclonal antibody (class, IgG; epitope, amino acids 2 to 289, human origin; Santa Cruz Biotechnology, Bioanalytica), anti-APC (C-20) (class, IgG rabbit polyclonal; epitope, carboxy terminus of APC of human origin; Santa Cruz, Bioanalytica), and anti-β-cat (E-5) mouse monoclonal antibody (class, IgG1; epitope, amino acids 680 to 781; carboxy terminus of β-catenin, human origin; Santa Cruz, Bioanalytica) were used as first antibodies, while the appropriate horseradish-peroxidase-labeled anti-IgGs were used as a secondary antibodies (Pierce, Bioanalytica, Athens, Greece). Extracts from the human tumor cell lines Jurkat and MCF7 were used as positive controls for APC and β-cat, respectively. The anti-actin C-2 mouse monoclonal antibody (Santa Cruz Biotechnology, Bioanalytica) was used for assessing equal loading of total protein per sample.
Gel Electrophoresis and Blotting
Sodium Dodecyl Sulfate-Polyacrylamide Gel Electrophoresis (SDS-PAGE) Analysis of β-Cat and APC in Subcellular Fractions and of APC in Total Protein Extracts: Twenty μg of protein from total extracts or subcellular extracts from each sample were adjusted with SDS-PAGE sample buffer (NEB; Bioline, Athens, Greece) and loaded on 4 to 20% gradient PAGEr Gold precast gels (BioWhittaker, Bioanalytica, Athens, Greece). Gel electrophoresis and transfer to nitrocellulose membranes (Protran BA85; Schleicher & Schuell, ArterChem, Athens, Greece) were performed according to standard protocols.
SDS-Agarose Analysis of APC in Total Protein Extracts and in Subcellular Fractions: To detect the full-length APC product SDS-agarose gel analysis was used, following previously described protocols. 57,58 Twenty μg of protein from total extracts or subcellular extracts from each sample were adjusted with SDS-PAGE sample buffer (NEB, Bioline, Athens, Greece) and loaded on 2.5% low-melting-point agarose gels containing 0.1% SDS and 1× Tris borate-ethylenediaminetetraacetic acid. Gel electrophoresis and transfer to nitrocellulose membranes (Protran BA85, Schleicher & Schuell) were performed according to previously described protocols. 57,58
Signal Development and Quantitation
Blots were blocked for 1 hour in 5% nonfat dry milk/Tris-buffered saline, 0.1% Tween-20 (TBS-T) at room temperature. Subsequently, membranes were incubated overnight with primary antibody (1/200 dilution) at 4°C, followed by a 1-hour incubation with secondary peroxidase-labeled antibody (1/50,000 dilution) at room temperature. Signal development was performed with the enhanced SuperSignal West Pico Chemiluminescent Substrate (Pierce, Bioanalytica). Autoradiographs were scanned on a flatbed scanner and band intensities were estimated with the Image-Pro Plus software, Ver 3.0 for Windows (Media Cybernetics, Silver Spring, MD, USA).
Microdissection and Nucleic Acid Extraction
Microdissection
For DNA extraction, contiguous 5-μm sections were processed. The first section was stained with hematoxylin and eosin to visualize the extent of tumor cells within each sample. The boundaries of the cancerous tissue were delineated microscopically and excess normal tissues were removed using sterile surgical blades, as previously described. 53,54
DNA Extraction
DNA extraction was performed using the phenol-chloroform-isoamyl alcohol procedure after tissue digestion with proteinase K. 54
Polymerase Chain Reactions (PCRs)
PCRs were setup for amplification of: the N-terminal domain of the β-cat, the APC mutation cluster region (MCR), and a polymorphic marker in intron 9 of the same gene (GenBank accession no. D70814).
Primers
The primers and thermal profiles used to amplify β-cat, the MCR region of APC, and intron 9 of the same gene are presented in Table 3 ▶ .
Table 3.
Amplimers and Thermal Profiles for Each Segment
| Segment | Amplimers | Thermal Profile | |||||||
|---|---|---|---|---|---|---|---|---|---|
| Forward | Reverse | ID | D | A | E | C | FE | ||
| β-cat* | |||||||||
| 217–238 to 402–422 | Exon 3 | ttt gat gga gtt gga cat gg | gaa gga ctg aga aaa tcc ctg | 3 minute, 95°C | 40 second, 94°C | 40 second, 53°C | 40 second, 72°C | 30 | 5 minute, 72°C |
| APC† | |||||||||
| 3578–3598 to 4023–4050 | MCR | tcc ttc atc aca gaa aca gt | gct gga ttt ggt tct agg g | 5 minute, 95°C | 40 second, 94°C | 40 second, 57°C | 40 second, 72°C | 30 | 5 minute, 72°C |
| 3979–3997 to 4440–442 | MCR | agc gaa gtt cca gca gtg t | agc att tac tgc agc ttg c | 5 minute, 95°C | 40 second, 94°C | 40 second, 57°C | 40 second, 72°C | 30 | 5 minute, 72°C |
| CA repeats | Intron 9 | tta ttt cat tcc tgt agc caa ga | tca tct cct ctt cac atc aat ag | 5 minute, 95°C | 40 second, 94°C | 40 second, 55°C | 25 second, 72°C | 30 | 5 minute, 72°C |
ID: initial denaturation; D, denaturation; A, annealing; E, extension; C, cycles; FE, final extension.
*Amplimer design is based on the β-cat sequence, GenBank accession number: Z19054.
†Amplimer design is based on the APC sequences, GenBank accession numbers: M74088, D70814.
Method
PCR reactions were performed in 50 μl containing 10 mmol/L Tris-HCl, pH 8.8, 50 mmol/L KCl, 1.5 mmol/L MgCl2, 0.1% Triton X-100, 200 μmol/L of each dNTP (dATP, dCTP, dGTP, and dTTP), 200 μmol/L of each primer, 200 ng DNA, and 2 U of TaqDNA polymerase (Advanced Biotechnology, Gram, Athens, Greece). PCR products were electrophoresed in 2% agarose gels stained with ethidium bromide.
Loss of Heterozygosity (LOH) Analysis for APC
Analysis
For LOH analysis pair-wise PCR reactions were performed on DNA extracted from tumor tissues and distantly located corresponding normal tissues. PCR products were electrophoresed on 10% polyacrylamide gels stained with silver nitrate.
Evaluation
Gel images were captured with a digital camera (Kodak, Antisel, Athens, Greece) and processed with a gel documentation software (Kodak). LOH estimation was based on previously set criteria. 53
Mutation Analysis
Single Strand Conformation Polymorphism (SSCP) Analysis
SSCP analysis was performed essentially as previously described. 54 We performed mutation screening of exon 3 of the β-cat gene corresponding to the N-terminal phosphorylation domain as well as of the MCR corresponding domain of the APC gene that is most frequently mutated. 25 Because of the large size of the MCR, two sets of primers generating overlapping PCR fragments were designed for SSCP compatibility.
Automated Sequencing
Samples that exhibited mobility shifts were then subjected to cycle sequencing using the ABI PRISM BigDye Terminator Cycle Sequencing Kit according to the manufacturer’s instructions (Applied Biosystems, Vamvakas, Athens, Greece). Samples were run on an ABI 377 sequencer (Applied Biosystems, Vamvakas, Athens, Greece).
Terminal dUTP Nick-End Labeling (TUNEL) Assay
Method
Double-strand DNA breaks were detected by TUNEL according to the method of Gavrieli and colleagues, 59 as previously described. 53
Controls
We used as positive controls tissue sections that were incubated with DNase I before treatment with TdT and as negative controls sections that were incubated in TdT buffer without the presence of the enzyme.
Evaluation
Cells were considered to undergo apoptosis when nuclear staining, without cytoplasmic background, was observed. Apoptotic index (AI) was estimated as the percentage of apoptotic cells in 10 high-power fields (counted cells, 900 to 10,000). Slide examination was performed by four independent observers (VG, AK, PZ, and KE). Intraobserver variability was minimal (P < 0.001).
Nuclear DNA Ploidy Analysis
Samples were stained according to the Thionin-Feulgen procedure. 53 The measuring and evaluation procedures have been formerly reported. 53 Cases with more than 5% of cells with DNA content above the 5c limit were considered as aneuploid. 60
Statistical Analysis
β-Cat and APC Immunoprofile Analysis
Associations of β-cat and APC IHC patterns between them, and with the clinicopathological parameters; the proliferation index (PI); and the p27, pRb, p53, MDM2, E2F1, and ploidy, were assessed using one-way-analysis of variance (Bonferoni) or Pearson’s test accordingly. The relationships of β-cat and APC immunostaining with AI and growth index (GI) was evaluated with the nonparametric Spearman’s test.
Grouping Analysis
Because of the low number of cases belonging to specific patterns, previous analysis using immunoprofiles could not always yield statistically reliable results and sometimes were even not possible. For this reason cases from different β-cat and APC IHC profiles were merged in larger groups (see Results), to determine possible associations. Specifically, β-cat M and MC immunoprofiles were assigned as membranous (Mem) and the CN immunoprofiles as nuclear (Nu). Similarly, for APC the groups were: cytoplasmic (Cy) for the cases with the C immunoprofile and nuclear (Nu) for the samples with immunoprofiles CN and N.
Associations of β-cat and APC groups among them, and with the clinicopathological parameters; the PI; and the p27KIP, pRb, p53, MDM2, E2F1, and ploidy, were assessed using t-test or Pearson’s test accordingly. The relationships of β-cat and APC immunostaining with AI and GI were evaluated with the nonparametric Spearman test.
Survival Analysis
Survival analysis was performed according to the Kaplan-Meier methodology and log-rank test. All tests were performed with the SPSS10 statistical package (SPSS Inc., Chicago, IL, USA). The statistical associations were considered significant when the P value was <0.05.
Results
β-Cat Analysis
IHC Results (Figure 1A ▶ , Table 2 ▶ )
Figure 1.
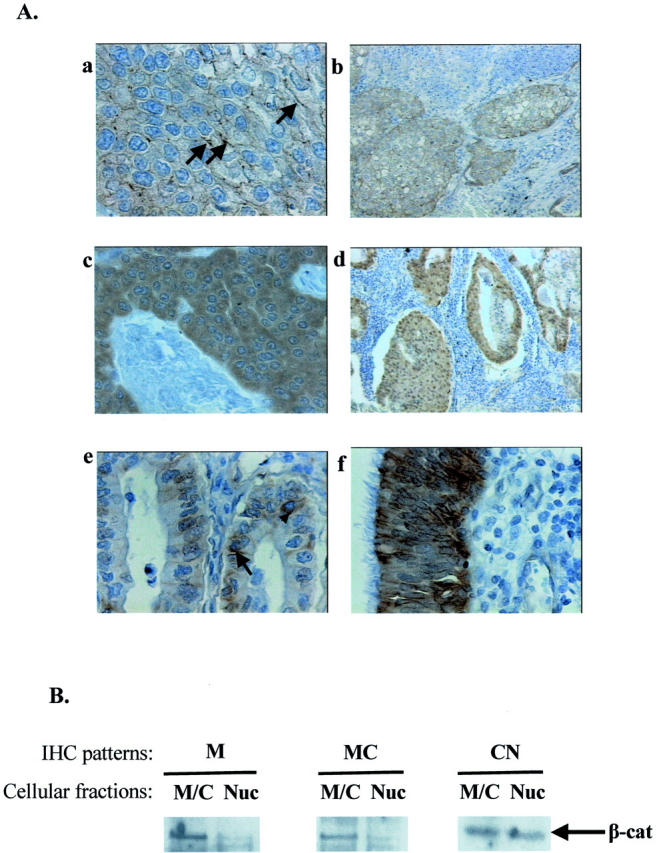
β-cat analysis in NSCLC. A: Representative IHC results. Streptavidin-biotin-peroxidase technique with E-5 anti-β-cat antibody (DAB as chromogen) and hematoxylin counterstain (see Materials and Methods). a: Linear membranous (arrows) immunodetection (M) of β-cat-positive tumor cells in squamous carcinoma (case 20). b: Cytoplasmic and membranous immunoreactivity (MC) of β-cat-positive tumor in squamous carcinoma (case 18). c: β-cat-positive tumor cells exhibiting homogenous cytoplasmic staining in squamous carcinoma (C) (case 52. d: Cytoplasmic and nuclear localization (CN) of β-cat in positive tumor cells in adenocarcinoma (case 60). e: β-cat-positive tumor cells exhibiting cytoplasmic (arrowhead) and membranous (arrow) immunoreactivity (MC) in adenocarcinoma (case 25). f: Normal bronchial epithelium with membranous and cytoplasmic β-cat immunopositivity is shown. B: Western blot analysis of β-cat subcellular distribution. Nuclear (Nuc) and membranous/cytoplasmic (M/C) fraction analysis for β-cat presence in representative samples exhibiting M (case 1), MC (case 56), and CN (case 22) β-cat IHC patterns. β-cat presence was more abundant in the corresponding fractions for each case, respectively, confirming the initial IHC expression results. The increased sensitivity of Western blot combined with an enhanced chemiluminescent system (see Materials and Methods) also showed the presence of residual levels of β-cat in the opposite fractions, that could be because of the contaminating presence of normal tissue and/or the CN shuttling of β-cat. Original magnifications in A: ×400 (a, c, e, f); ×100 (b, d).
IHC analysis in 81 (88%) of 92 informative NSCLCs cases revealed expression of β-cat in tumor as well as normal lung parenchyma. In tumor areas β-cat exhibited on average a homogenous staining with four distinct expression patterns. The most frequent profile was the MC (54.3%), followed by the CN (24.7%). The other two patterns represented sole membranous (M) (11.1%) and cytoplasmic (C) (9.9%) staining, respectively. In normal parenchyma β-cat was detected in the pneumocytes of the alveoli, in the bronchial epithelium, and seromucous glands in the submucosa. In these areas β-cat expression pattern was mainly linear MC. IHC expression was also detected in stromal elements, predominantly fibroblasts showing a weak cytoplasmic stain. Furthermore, positive cytoplasmic signal was readily discerned in endothelial cells of the stromal vessels. No significant correlations were found between β-cat staining and the clinicopathological parameters of the patients.
Western Blot Analysis of β-Cat Subcellular Localization (Figure 1B) ▶
To confirm the subcellular distribution of β-cat found by IHC we performed Western blot analysis on subcellular fractions consisting of nuclear (Nuc) and MC extracts from frozen tumor tissues in representative samples exhibiting specific IHC patterns. We detected the presence of β-cat in the corresponding fractions confirming our original IHC analysis. The increased sensitivity of the chemiluminescent detection method revealed residual levels of β-cat in the opposite fractions that could be because of the contaminating presence of normal tissue and/or the nucleocytoplasmic shuttling of β-cat. 4-7,35,42
Mutation Analysis
Mutations at specific serine and threonine residues of the amino-terminal domain of β-cat gene abrogate its phosphorylation-dependent degradation. 25 To investigate the presence of mutations in this region a combined SSCP-automated sequence analysis of exon 3 was performed. Our results revealed that no mutations were present at the N-terminus of this gene.
APC Analysis
IHC Results (Figure 2A ▶ , Table 2 ▶ )
Figure 2.
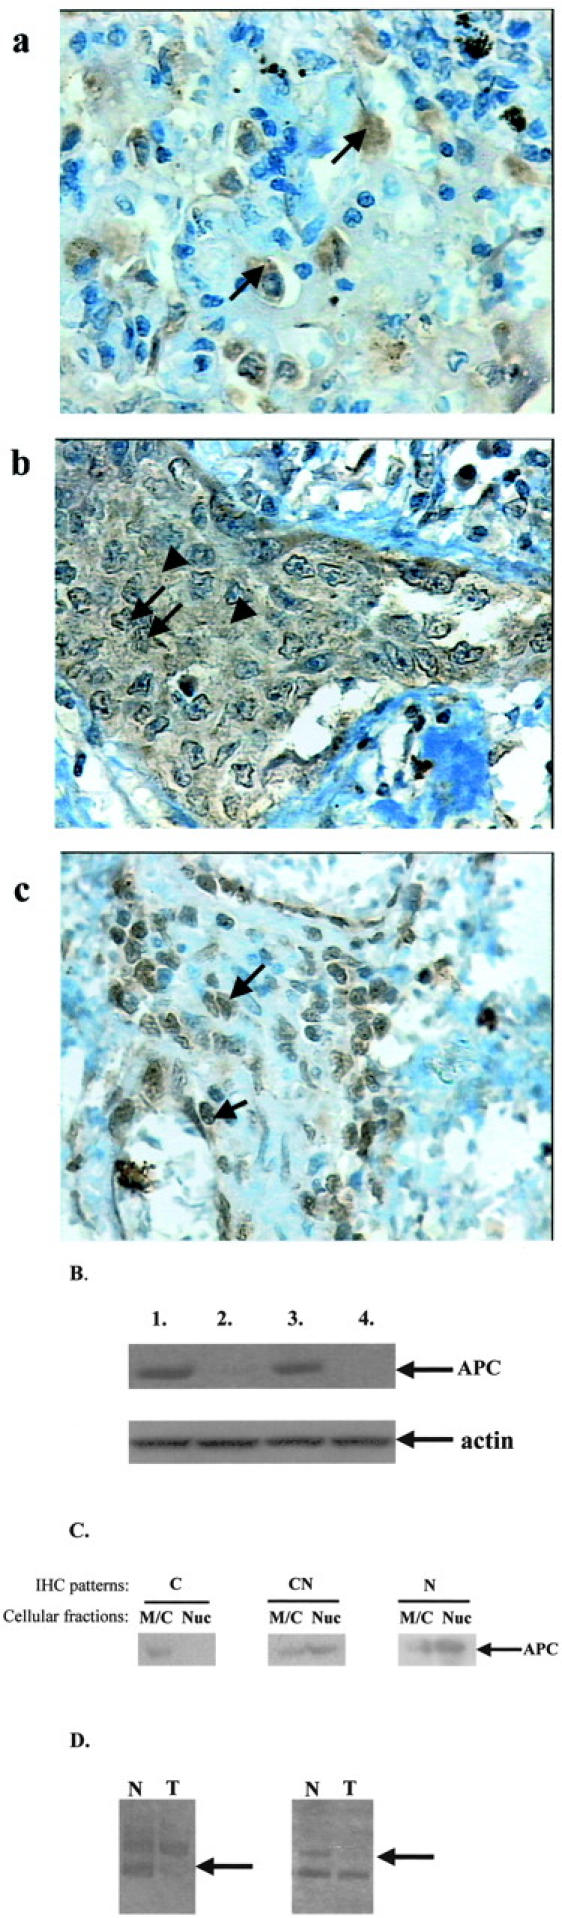
APC analysis in NSCLC. A: Representative IHC results. Streptavidin-biotin-peroxidase technique with C-20 anti-APC antibody (DAB as chromogen) and hematoxylin counterstain (see Materials and Methods). a: Cytoplasmic immunodetection (C) of APC-positive tumor cells (arrows) (case 58). b: Cytoplasmic (arrowheads) and nuclear (arrows) immunoreactivity (CN) of APC-positive tumor cells (case 56). c: Nuclear staining (N) of APC-positive tumor cells (arrows) (case 71). B: Protein analysis. Results of the Western blotting analysis showing decreased APC protein levels in tumor areas (lanes 2 and 4) in comparison to corresponding normal tissue (lanes 1 and 3). Faint bands for APC levels were detected in tumor lanes, but because of image editing they were not accurately reproduced. Equal loading of total protein extracts was verified by actin blotting (second lane). C: Western blot analysis of APC subcellular distribution. Nuclear (Nuc) and membranous/cytoplasmic (M/C) fractions from representative samples exhibiting C (case 10), CN (case 22), and N (case 49) APC IHC patterns, respectively, were examined for its expression. APC was more abundant in the corresponding fractions of each case confirming the initial IHC results. The increased sensitivity of Western blot combined with an enhanced chemiluminescent system (see Materials and Methods) revealed the presence of residual APC levels in the opposite fractions, probably because of contamination from normal tissue and/or the nucleocytoplasmic shuttling ability of APC. 10,11 Because of image editing APC residual levels were not accurately reproduced. D: LOH analysis. Loss of one of the two constitutive alleles in tumor areas (arrows) in comparison to their normal counterparts. Original magnifications in A, ×400.
Examination of the IHC status in 69 (75%) of 92 informative cases, revealed that APC was expressed in tumor areas of the sections and normal parenchyma. However, staining intensity was on average decreased in the cancerous areas in comparison to surrounding normal parenchyma. Three distinct patterns were discerned and consisted of sole cytoplasmic staining (C) (37.7%), cytoplasmic and nuclear staining (CN) (58%), and only nuclear staining (N) (4.3%). Normal parenchyma exhibited mainly cytoplasmic and occasionally focal membranous staining of basal cells of the bronchial epithelium and pneumocytes of the alveoli, a finding that is in agreement with previous results. 57 Moreover, stromal cells revealed focal staining consisting of mixed cytoplasmic and CN pattern. No significant correlations were found between APC staining and the clinicopathological parameters of the patients.
Mutation Analysis
A wide spectrum of mutations have been reported for APC. 25 The most frequent mutations occur in the central third, mainly in a region termed the “mutation cluster region” (MCR) roughly defined by codons 1250 to 1500. This region contains β-cat-binding and down-regulating domains. Mutations in the MCR usually lead to expression of truncated APC proteins that retain the ability to bind, but are unable to suppress, β-cat activity. 25 A combined SSCP-automated sequence analysis of the MCR was performed to investigate for the presence of such mutations in NSCLCs. Nevertheless, no mutations were found in this region.
LOH Analysis (Figure 2B ▶ , Table 2 ▶ )
For LOH analysis a polymorphic region in intron 9 of the APC gene was used. Of 51 informative cases, for which normal counterparts were available, 11 (24%) displayed a loss in one of the two constitutive alleles. Interestingly, all cases exhibiting LOH displayed decreased immunostaining of APC in the tumor areas in comparison to surrounding normal parenchyma. Decreased APC expression was also detected in other cases, including heterozygous ones with no LOH.
Western Blot Analysis
To verify APC immunostaining results we performed Western blot analysis in a series of representative cases. These samples included cases with and without LOH at 5q21, as well as different β-cat- and APC-staining patterns. Results from Western blot analysis confirmed the immunostaining results and showed that APC levels are decreased in tumor areas in comparison to normal counterparts. Decreased levels were found not only in the cases with LOH, but also in samples without this ablation and were independent of APC- and β-cat-staining patterns, respectively. It should be mentioned that we were unable to detect, in both normal and tumor counterparts, the full-length APC although two different gel separation methods (gradient 4 to 20% SDS-PAGE and SDS-agarose gels) and two different antibodies directed against the amino- and the carboxy-termini, respectively, were used (see Materials and Methods). Instead, a shorter isoform, of approximately 90 kd, was detected. Such a nonmutant isoform has been previously reported and suggested to be related with apoptotic processes. 61
Western Blot Analysis of APC Subcellular Localization (Figure 2C) ▶
To confirm the subcellular distribution of APC we performed Western blot analysis on subcellular fractions consisting of nuclear (Nuc) and MC extracts from frozen fresh tumor tissues in a series of representative samples exhibiting the specific IHC patterns. Only the 90-kd isoform could be detected, as previously mentioned. Our results showed that APC was more abundant in the corresponding subcellular fraction confirming the initial findings by IHC analysis. Furthermore, the increased sensitivity of the chemiluminescent detection method revealed residual levels of APC in the opposite fraction possibly because of contaminating normal tissue and/or to its nucleocytoplasmic shuttling ability. 10,11
IHC Analyses of the G1/S-Phase Checkpoint Regulators
Analysis of pRb and E2F1
IHC analysis of E2F1 status was assessed as the percentage of stained tumor cells (84 informative cases, 91%). E2F1 was expressed in normal lung parenchyma as well as tumor areas. Moreover, scarcely E2F1-stained stromal cells were observed. E2F1 immunoreactivity ranged from 19 to 92% of the tumor cells, with a mean value of 45.5 ± 14.6% (Table 2) ▶ . The percentage of stained cells in the tumor region was significantly higher than that of the corresponding normal epithelium (mean value, 12.1 ± 2.3%; P < 0.001 by t-test analysis). In the normal lung parenchyma E2F-1 staining was detected in the bronchial epithelium, mainly the basal cells, and in the pneumocytes of the alveoli. Correlation of E2F-1 protein expression with clinicopathological parameters confirmed our previous findings in NSCLCs (data not shown). 56 Data for pRb immunoreactivity were obtained from previous publications (Table 2) ▶ . 53,54
Analysis of p53 and MDM2
Abnormal IHC reactivity for p53 and MDM2 was observed in 51 (56%) of 91 informative cases and 59 (64.1%) of the 92 cases, respectively (Table 2) ▶ . Relationships with histology, lymph node status, and stage are in accordance with our previously described findings in NSCLCs (data not shown). 53,54
Analysis of p27KIP
Data for p27KIP immunoreactivity was obtained from a previous publication (Table 2) ▶ . 55
Analysis of Growth Parameter Indexes (Proliferation and Apoptosis) and Ploidy Status
Proliferation Index (PI)
The proliferation activity of the cancerous tissues was assessed by Ki-67 IHC, as previously described. 53-56 The percentage of positive cells for Ki-67 in the cancerous areas ranged from 4.6 to 70.4% and mean PI was 33.55 ± 10.77% (86 informative cases) (Table 1) ▶ .
Apoptotic Index (AI)
Apoptotic index ranged from 0.1 to 10.6%, with a mean value 1.68 ± 1.79% (81 informative cases).
Ploidy Status
Of 85 informative cases, 48 (56.5%) were evaluated as aneuploid (Table 1) ▶ .
Associations of growth parameters and ploidy status with clinicopathological parameters in NSCLCs have been extensively described in our previous publications. 53,55,56
Relationship of the β-Cat Status with Growth Parameters, Ploidy Status, APC, and G1/S-Phase Checkpoint Regulators Status
β-Cat Expression Patterns, Growth Parameters, and Ploidy Status
Data from experimental systems have provided evidence that overexpression of β-cat influences cell growth parameters (proliferation and apoptosis) 14,18-20,62 and possibly ploidy status. 14 Therefore, we were interested in examining the relationship between its expression status and these parameters in our series of NSCLCs.
Comparison of the growth kinetics (PI and AI) between all four IHC expression profiles (M, MC, C, and CN) revealed that only the PI was significantly different among them. Specifically, the β-cat nuclear-associated CN IHC expression profile exhibited the highest proliferation value and was significantly increased only from the membranous associated ones (M and MC) (Table 4 ▶ , Figure 3 ▶ ). This result indicates that the main determinant for the difference in proliferation between all profiles is β-cat subcellular localization either at the membrane or in the nucleus.
Table 4.
Associations of β-Cat and APC IHC Patterns with Proliferation Index
| Patterns | Mean (n) | SD | P | ANOVA | |||
|---|---|---|---|---|---|---|---|
| MD (95% CI) | P | ||||||
| β-cat immunohistochemical evaluation (IHC) | Intercept: | 41.84 (36.48, 47.19) | 0.001 | ||||
| Membranous | M | 27.57 (9) | 5.20 | 14.27 (3.08, 25.46) | 0.005 | ||
| Membranous-cytoplasmic | MC | 31.17 (41) | 10.05 | 10.66 (2.99, 18.34) | 0.002 | ||
| Cytoplasmic | C | 35.67 (8) | 12.62 | 6.16 (−5.49, 17.82) | 0.93 | ||
| Cytoplasmic-nuclear | CN | 41.84 (19) | 11.11 | 0.001 | |||
| APC immunohistochemical evaluation (IHC) | Intercept: | 27.87 (8.18, 47.55) | 0.557 | ||||
| Cytoplasmic | C | 34.22 (24) | 11.72 | −6.35 (−23.39, 10.68) | 1.000 | ||
| Cytoplasmic-nuclear | CN | 35.17 (39) | 11.21 | −7.30 (−23.97, 9.37) | 0.856 | ||
| Nuclear | N | 27.87 (3) | 7.92 | 0.557 | |||
Abbreviations: n, number of informative samples; SD, standard deviation; CI, confidence intervals; MD, mean difference.
Figure 3.
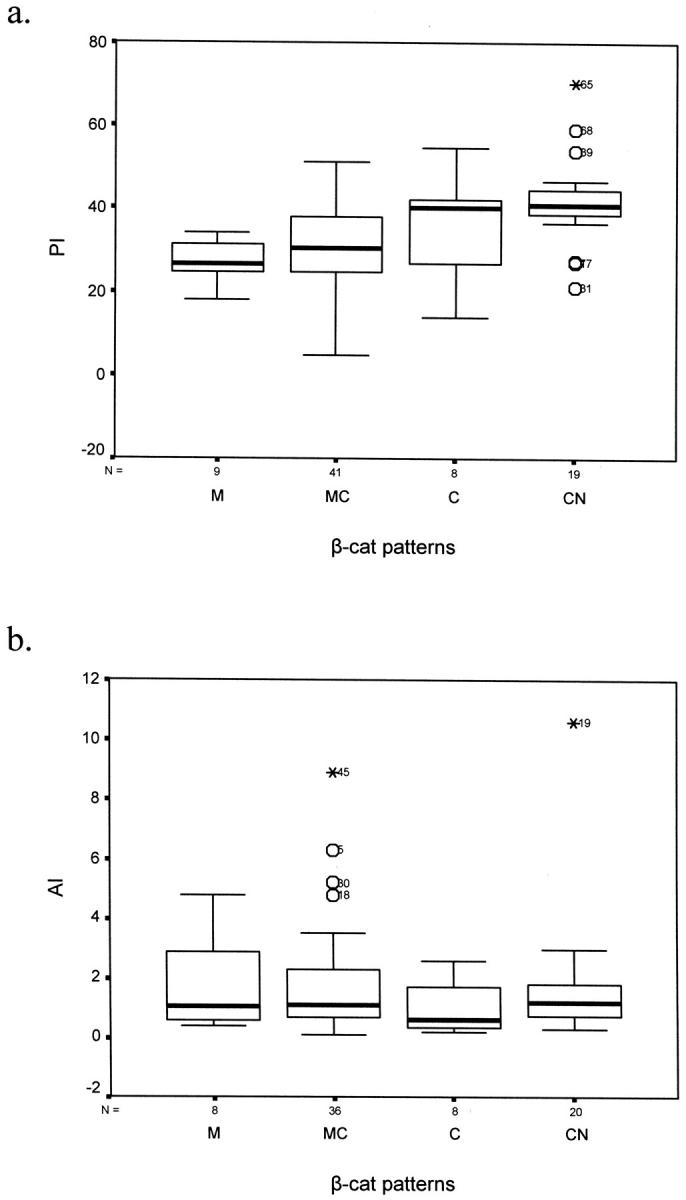
Diagrams (box plots) demonstrating the correlation between β-cat IHC patterns and PI (a) and AI (b). a: The main difference in proliferation is between cases with nuclear localization versus cases with membranous presence of β-cat (M and MC patterns, P = 0.005 and P = 0.002, respectively, Bonferoni analysis; Table 4 ▶ ). b: There were no significant differences in the apoptotic rate between all β-cat profiles. Similar results were obtained for GI (data not shown).
No relationship was found between β-cat IHC expression profiles and ploidy (data not shown). Actually the low number of cases comprising the membranous (M) and cytoplasmic (C) profiles, respectively (Table 2) ▶ , led to nonreliable statistical results because of dispersion of these cases into smaller subgroups (aneuploid versus diploid). Therefore, taking into consideration that β-cat membranous or nuclear localization is the main determinant for its cellular effects 62 and to avoid such problems in search for potential relationships, we proceeded to an assembly of its IHC expression patterns into groups (see next section).
Groups of β-Cat Expression Patterns, Growth Parameters, and Ploidy Status
In our study most of the cases examined comprised two large immunophenotypes: those with MC immunostaining (54.3%) and those with CN immunostaining (23.5%) (Table 2) ▶ . As mentioned, because of the low number of cases in the other two profiles (M and C), statistical analysis, considering separately all four patterns observed, was often difficult to perform. For the above reasons and taking into account that β-cat subcellular association with the membrane or the nucleus reflects particular biological functions, 4-7,12,35,42 cases with CN immunophenotype were defined as a nuclear (Nu)-expressing β-cat group, whereas cases with M and MC staining were merged into a group defined as membranous (Mem) (Table 2) ▶ . According to this categorization a third group defined by cytoplasmic β-cat presence was also considered (Cy), but it covered almost the entire cohort examined in the present study (87.6%) (Table 2) ▶ . Thus, in our analysis main emphasis was on the differences between the Mem and Nu groups, unless otherwise mentioned.
Comparison of growth parameters (proliferation and apoptosis indices) between the Nu and Mem groups revealed that cases with nuclear staining exhibited a significant increase in PI (P < 0.001, t-test; mean difference, 10.602), while the apoptotic rate was unaffected by the subcellular localization of β-cat, because it was similar among the two groups (P = 0.178, Kruskal-Wallis test) (Table 5) ▶ . However, GI (defined as the ratio PI/AI) was also similar between the Nu and Mem groups (Table 5) ▶ . Also, nuclear localization of β-cat was associated with increased frequency of aneuploidy, but this relationship was not significant (P = 0.184, Pearson test) (Table 5) ▶ .
Table 5.
Relationships between β-Cat Expression, Clinicopathological Data, Growth Parameters (Proliferation Index, Apoptotic Index, and Growth Index), APC, E2F1, p27, p53, MDM2, and pRb Status
| β-Cat groups | P | ||
|---|---|---|---|
| Mem | Nu | ||
| Histology | |||
| ADCs | 31 | 6 | |
| SCCs | 28 | 12 | 0.181* |
| Ploidy | |||
| Aneuploid | 27 | 13 | |
| Diploid | 29 | 6 | 0.184* |
| Lymph Node invasion | |||
| Yes | 33 | 12 | |
| No | 27 | 8 | 0.7* |
| Tumour stage | |||
| I | 24 | 6 | |
| II | 18 | 8 | 0.753* |
| III | 18 | 6 | |
| APC groups | |||
| Cy | 19 | 5 | |
| Nu | 29 | 12 | 0.702* |
| APC LOH status | |||
| Het | 24 | 10 | |
| LOH | 8 | 2 | 0.565* |
| E2F-1 status | |||
| n | 59 | 18 | |
| Mv± SD | 42.85 ± 13.69 | 55.44 ± 14.08 | 0.001† |
| p27KIP status | |||
| n | 41 | 17 | |
| Mv ± SD | 35.59 ± 13.18 | 25.82 ± 13.11 | 0.013† |
| p53 status | |||
| Positive | 29 | 15 | |
| Negative | 31 | 5 | 0.043* |
| MDM2 status | |||
| Positive | 34 | 17 | |
| Negative | 26 | 3 | 0.031* |
| p53/MDM2 status | |||
| Normal | 41 | 5 | |
| Abnormal | 19 | 15 | 0.001* |
| pRb status | |||
| Aberrant | 21 | 11 | |
| Normal | 34 | 9 | 0.291* |
| PI | |||
| n | 50 | 19 | |
| Mv± SD | 30.53 ± 9.43 | 41.84 ± 11.11 | <0.001† |
| AI | |||
| n | 44 | 20 | |
| Mean rank | 32.43 | 32.65 | 0.965‡ |
| GI | |||
| n | 44 | 19 | |
| Mean rank | 29.9 | 36.87 | 0.166‡ |
Abbreviations: Mv, mean value; SD, standard deviation; n, number of samples.
*Pearson chi-square.
†t-test analysis.
‡Mann-Whitney.
β-Cat Status and APC Status
Comparison of the four observed β-cat immunoprofiles with the APC immunostaining profiles revealed no significant associations (data not shown). Comparison of the β-cat groups (Mem and Nu) with a similar assembly of APC IHC expression patterns into groups (Cy, cytoplasmic immunoprofile; Nu, cytoplasmic/nuclear and nuclear immunoprofiles) also revealed no significant associations (Table 5) ▶ . No associations were found between the β-cat groups (Mem and Nu) and APC LOH analysis (Table 5) ▶ .
β-Cat Status with G1/S-Phase Checkpoint Regulators Status
In several experimental systems the influence of β-cat status on cell growth parameters is related to the status of critical G1/S-phase checkpoint regulators. 14-17 In our NSCLCs series we have previously reported that tumor growth is related to aberrant expression of the G1 phase-related regulators p53, MDM2, pRb, E2F1, and p27KIP. 53-56
Comparison of the IHC status of each of these cell-cycle regulators in the two differentially expressing β-cat groups (Mem versus Nu), revealed that only cases with nuclear staining were associated with deregulated patterns of these cellular components, except for pRb (Table 5) ▶ . Specifically, Nu cases were associated with: 1) increased frequency of abnormal expression of p53 and MDM2 (P = 0.043 and P = 0.031, respectively; chi-square), while concomitant deregulation of the p53/MDM2 (aberrant p53 and MDM2) regulatory feedback loop was even more significant (P = 0.001, chi-square); 2) overexpression of E2F-1 (P = 0.001, t-test; mean value difference, 12.6); and 3) underexpression of p27KIP (P = 0.013, t-test; mean value difference, 9.76).
Relationship of the APC Status with Growth Parameters, Ploidy Status, and G1/S-Phase Checkpoint Regulators Status
APC Status, Growth Parameters, and Ploidy Status
No significant correlations were found between the APC groups with the growth parameters (PI and AI) or ploidy status (Table 6) ▶ . Similar results were obtained also if LOH results were used in the analysis.
Table 6.
Relationships between APC Expression, Clinicopathological Data, Growth Parameters (Proliferation Index, Apoptotic Index and Growth Index), E2F1, p27, p53, MDM2 and pRb Status
| APC groups | P | ||
|---|---|---|---|
| Cy | Nu | ||
| Histology | |||
| ADCs | 11 | 18 | |
| SCCs | 13 | 24 | 0.555* |
| Ploidy | |||
| Aneuploid | 15 | 23 | |
| Diploid | 10 | 15 | 1.000* |
| Lymph Node invasion | |||
| Yes | 15 | 22 | |
| No | 11 | 21 | 0.627* |
| Tumour stage | |||
| I | 11 | 19 | |
| II | 7 | 14 | 0.766* |
| III | 8 | 10 | |
| APC LOH status | |||
| Het | 11 | 21 | |
| LOH | 2 | 8 | 0.466* |
| E2F-1 status | |||
| n | 25 | 40 | |
| Mv± SD | 45.64 ± 14.31 | 47.40 ± 15.25 | 0.645† |
| p27KIP status | |||
| n | 20 | 37 | |
| Mv ± SD | 32.75 ± 16.32 | 32.97 ± 12.20 | 0.954† |
| p53 status | |||
| Positive | 11 | 26 | |
| Negative | 15 | 16 | 0.138* |
| MDM2 status | |||
| Positive | 18 | 29 | |
| Negative | 8 | 13 | 1.000* |
| p53/MDM2 status | |||
| Normal | 17 | 20 | |
| Abnormal | 9 | 22 | 0.211* |
| pRb status | |||
| Aberant | 6 | 21 | |
| Normal | 19 | 20 | 0.040* |
| PI | |||
| n | 24 | 42 | |
| Mv± SD | 34.22 ± 11.72 | 34.65 ± 11.10 | 0.885† |
| AI | |||
| n | 22 | 38 | |
| Mean rank | 31.66 | 29.83 | 0.695‡ |
| GI | |||
| n | 21 | 38 | |
| Mean rank | 29.6 | 30.22 | 0.893‡ |
Abbreviations: Mv, mean value; SD, standard deviation; n, number of samples.
*Pearson chi-square.
†t-test analysis.
‡Mann-Whitney.
APC Status with G1/S-Phase Checkpoint Regulator Status
Correlation of APC status with the above-mentioned cell-cycle regulators revealed only one significant association; aberrant expression of pRb was significantly associated with nuclear (Nu) localization of APC (P = 0.04, chi-square) (Table 6) ▶ .
Survival Analysis
Survival analysis was conducted with 84 patients because no follow-up information was available for 8 cases. No significant differences were found in survival between the Nu and Mem β-cat expression patterns. Similar results were also found for APC status. The only factor that highly correlated with survival was E2F-1, as previously described. 56
Discussion
β-cat is a pivotal component of Wnt (or other) signaling pathway(s) and E-cad-associated homotypic cell adhesion. 4,6,7 Deregulated increase of its cytoplasmic levels results in aberrant nuclear localization that is related to abnormal cell behavior. 2-7,62 There are few reports with controversial results in tumors, concerning β-cat aberrant expression concurrently with cell-cycle kinetics (proliferation and apoptosis), chromosomal instability, and the interplay with major cell-cycle regulators, as suggested in cell lines. 14,15,18,19
In our study, IHC expression analysis revealed the presence of β-cat in the nuclear (Nu), cytoplasmic (Cy), and submembranous (Mem) compartments, while from case to case there was a combined topological distribution revealing four patterns of expression (see Results, Figure 1A ▶ , and Table 2 ▶ ). The intracellular distribution was also verified by Western blot analysis of subcellular fractions (Figure 1B) ▶ . The most frequent localization in all patterns was in the cytoplasm (87.6%), possibly indicating aberrant stabilization of β-cat. 25 Interestingly, membrane (Mem) and nuclear (Nu)-associated patterns were mutually exclusive (Table 2) ▶ and reflect the β-cat disparate cellular functions 4 (Figure 4, B and C) ▶ . This is in agreement with the proposed competition for incorporation of the β-cat cytoplasmic pool either in cell adhesion or in signal transduction mechanisms. 4,6,39 Also, none of these profiles correlated with clinicopathological parameters (Table 5) ▶ , as suggested in certain reports. 44-46 Nevertheless, these studies take into account the staining intensity of β-cat, rather than its cellular profile. In our analysis, β-cat staining was on average homogenous.
Figure 4.

A hypothetical model summarizing β-cat association with proliferation in relation with G1 phase cell-cycle regulators in NSCLCs, based on the literature and our data (present and previous work): A: Data from experimental systems have shown that β-cat cellular pools under normal conditions are involved in homotypic cell adhesion (M). 2-7,42 Activation of Wnt signaling induces a nuclear accumulation (N), 2-7,10-13,42 in which β-cat functions as a transcription factor 12 inducing among others, cellular proliferation. 14,20,62 This β-cat-associated increase in proliferation is tightly controlled by the following mechanisms: 1) nuclear sequestration 10,11 and cytoplasmic degradation of β-cat by APC; 2-9 2) activation of p53, that accumulates in response to β-cat signaling and triggers a cell growth arrest; 15-17 and 3) p27KIP-dependent cell-cycle arrest that results from the interplay between activation of nuclear β-cat transcriptional targets (eg, myc 76 ) and E-cad. 77,78 Note: Depending on the histological context the exact relationships between β-cat expression status, cell-cycle kinetics, and expression of G1 cell-cycle regulators may vary. 33,34,37,38 B: In the present analysis, the group of cases with β-cat membranous localization (Mem) was related with intact p53/MDM2 loop, 53,54 high levels of p27KIP expression, 55 and decreased APC levels. This group of cases demonstrated a lower PI compared to the β-cat nuclear-associated group (Nu). Taking into consideration our findings and the data in the literature we suggest that the following mechanisms may apply in this group. Functional p53 and p27KIP checkpoints 53-55 should prevent β-cat oncogenic effects by eliciting an anti-proliferative response, as previously predicted. 15-17,74-76 Despite decreased APC levels, the low cell-cycle turnover may prevent saturation of degradation mechanisms thus providing sufficient β-cat down-regulation response. Also membranous association may reflect intact E-cad sequestration of β-cat, 78 that further adds to proliferation control. 76-78 C: In the present analysis, the group of cases with β-cat nuclear localization (Nu), were associated with defected p53 (either via p53 mutations or MDM2 overexpression 53,54 ), decreased p27KIP expression levels, 55 increased E2F1 expression levels, 56 and decreased APC levels. In this group of cases the above correlations are related with higher PI. Taking into consideration our findings and the data in the literature we suggest that the following mechanisms may apply in this group. Loss of p53 and p27KIP checkpoints should release β-cat from cellular growth restrains. 15-17, 6-78 Its nuclear accumulation leads to aberrant transcriptional activation (eg, activation of c-myc, cyclin D) 2-7,12,13 and consequently an increase in proliferation. 14,20,62 Low levels of APC and increased cell-cycle proliferation probably result in a saturation, and therefore render inefficient, the β-cat down-regulating mechanisms. Furthermore, E-cad might also be inactivated, as previously suggested. 35,77,78 It is either not expressed or other factors (eg, γ-cat or activated growth-related tyrosine kinase receptors) compete for binding. 3,5,35,78
The high frequency of β-cat cytoplasmic (Cy) immunolocalization led us to investigate the putative reasons concerning this aberrant expression. Therefore, we first examined the status of APC, its main regulator. 2-7 Expression analysis revealed attenuated APC protein levels in tumors that were independent of β-cat- and APC-staining patterns (Figure 2B) ▶ . The low levels of APC possibly reflect a decreased degradation ability of β-cat that could be responsible for its frequent cytoplasmic (Cy) immunodetection (Figure 4, B and C) ▶ . 9,25 No mutations in β-cat (exon 3) and APC (MCR) were detected, a finding that is in agreement with previous reports in NSCLCs, 43,52,63-66 implying that β-cat is not aberrantly stabilized by such alterations. LOH at the APC locus is frequently found in NSCLCs 63,66 and could be a reason explaining this finding, but in our cases its observed frequency (24%) cannot explain the decreased APC levels in all of the examined samples. Recently it has been shown that in several types of tumors, including lung, an additional mechanism of APC inactivation is methylation of its gene promoter. 67,68
Interestingly, Western blot analysis revealed a 90-kd isoform of APC, instead of the 300-kd full-length product. A similar one has been reported in cellular systems undergoing apoptosis after loss of cell adhesion. 61 Its presence in normal tissues precludes the possibility of mutations outside the region (MCR) examined in this study. The 300-kd isoform could not be detected although different separation methodologies were used, such as gradient acrylamide gels or denaturing agarose gels and the use of different antibodies, as previously described. 57,58 With our data, taken together, it seems that the 90-kd product is the main APC isoform expressed in the lung. The diminished levels of this low-molecular-weight form in tumor counterparts may suggest an insufficiency in adhesion-triggered apoptotic mechanisms in NSCLCs.
Next we examined whether β-cat expression patterns were associated with the cell-cycle kinetics in the current series. This aim was set in view of the opposing cellular roles of β-cat in cell adhesion and nuclear transcription 4-7 and the cellular effects of β-cat overexpression, as described in experimental systems. 14,18-20,62 The most significant association observed was between nuclear β-cat presence and increased proliferation (P < 0.001, Table 5 ▶ ). Specifically, PI was significantly higher in the nuclear-associated (CN) profile as compared to the membranous related profiles (M and MC) (Figure 3 ▶ , Table 4 ▶ ). This result is in agreement with the disparate cellular functions of β-cat in adhesion and gene transcription. 4-7 This also supports our assembly of β-cat expression patterns in larger groups that reflect specific biological functions. Association between nuclear localization and increased proliferation has also been reported by Pirinen and colleagues, 44 whereas in a second study in the same type of tumors, proliferation correlated with increased β-cat staining intensity. 52 Similar results have also been found in other types of tumors. 25 On the other hand, at the invasive front of colorectal adenomas the nuclear presence of β-cat is associated with low proliferation, 37 whereas in hair follicle-derived tumors nuclear β-cat was not associated with proliferation. 33 Such differences probably depend on specific cellular context. 37
Subsequently, we questioned if β-cat nuclear-associated proliferation was related to deregulated expression of the main G1/S phase regulators, because β-cat augments cellular proliferation by enhancing G1/S phase transition in cellular systems and its effects on cellular behavior are mediated by an interplay with G1/S phase regulators in cellular systems. 4,14-17
The first G1 to S phase regulator examined was the transcription factor E2F1. Release of E2F from pRb sequestration is a prerequisite event for the cell to enter the S phase. 69 The exact effects of E2F on cell-cycle regulation is a matter of active debate. 56 Recently, we have shown in a subset of the currently used NSCLC cases, that E2F1 is strongly associated with tumor growth, mainly because of increased proliferation. 57 Our results showed a significant correlation with Nu β-cat localization (P = 0.001, Table 5 ▶ ), suggesting that β-cat may participate in E2F1 transcriptional release, probably through its G1 phase targets, c-myc and cyclin D1 (Figure 4) ▶ . 4,7 However, we found no relationship between β-cat and pRb status (Table 5) ▶ , implying that additional factors, such as inactivation of p16INK4a that is frequently observed in NSCLCS, 70,71 may be involved in E2F1 activation. Interestingly, the nuclear presence of APC was associated with aberrant expression of pRb (P = 0.04, Table 5 ▶ ). Previous reports have shown that APC senses decrease or loss of adherence and moves into the nucleus, 72,73 possibly blocking G1/S phase progression, 21 or inducing apoptosis. 22 Our finding may reflect a fail-safe protection mechanism of APC against the defected pRb pathway from β-cat oncogenic effects, but this remains to be proven.
The status of the p53/MDM2 regulatory loop was investigated, next in relation to β-cat status. Nuclear β-cat was significantly correlated with aberrant p53 expression and overexpression of MDM2 (P = 0.001, Table 5 ▶ ). Recent models have shown that oncogenic β-cat elicits an ARF-mediated p53-dependent growth arrest. 15,16 Consequently, in vivo loss of wt p53 or ablation of ARF function (directly via mutations or indirectly through MDM2 overexpression 74,75 ), has been suggested to provide a selective advantage for tumors with deregulated β-cat. 16 Our results confirm for the first time in vivo and in NSCLCs these relationships (Table 5 ▶ , Figure 4 ▶ ). Given that, induction of the p53 pathway by β-cat in the same model was partially dependent on E2F1 expression, 16 the observed association between Nu β-cat and E2F1 in our analysis, corroborates further with this model (Figure 4C) ▶ . In addition, taking into account that p53 is the main E2F-1 mediator of programmed cell death and that p53 also induces β-cat degradation in response to growth arrest, 9,17 loss of the p53 checkpoint increases E2F1-dependent proliferation, as we have previously shown, 56 further supporting our observations in the cases with Nu β-cat localization (Figure 4C) ▶ .
Finally, nuclear β-cat presence was associated with low levels of p27KIP expression (P = 0.013, Table 5 ▶ ). This finding correlates with our previous results showing that proliferation is inversely related to p27KIP expression 55 and also complies with a recent report showing that c-myc represses transcription of p27KIP. 76 Based on these findings, the observed inverse relationship between nuclear and membranous localization of β-cat could be also an indication of disturbance of the E-cad/catenin complex, because E-cad induces growth suppression via p27KIP 77 and regulates cell growth by modulating β-cat transcriptional activity in a cell adhesion-independent manner (Figure 4, B and C) ▶ . 78
In the present study, β-cat status did not correlate with the apoptotic rate. Although, β-cat was also not associated with tumor growth (defined as the ratio PI/AI), in our previous studies deregulated E2F1 and p27KIP expression was accompanied with increased growth and moreover with poor survival. 55,56 One possible explanation is that E2F1 and p27KIP are final downstream effectors of cell-cycle regulatory pathways, whereas β-cat is an intermediate downstream effector that exerts its cellular effects indirectly, through other downstream mediators. 4,6,12 These mediators receive and integrate signals from other modulators, too, transducing them further downstream to final ones, such as E2F1 and p27KIP. 1,69 Thus, β-cat influences cell proliferation, but disturbance of the overall cell growth probably requires the additive deregulation(s) of other cell-cycle modulator(s). 15,16,53
In conclusion nuclear accumulation of β-cat in NSCLCs is accompanied by an increase in proliferation, that is related to overexpression of E2F1. This effect is facilitated by a selective advantage from inactivation of the p53 and p27KIP cell-cycle checkpoints and the presence of diminished APC levels.
Acknowledgments
We thank Dr M. Karagumi for here valuable technical help.
Footnotes
Address reprint requests to V. G. Gorgoulis, Antaiou 53 Str, Lamprini, Ano Patisia, Athens, GR-11146, Greece. E-mail: histoclub@ath.forthnet.gr.
References
- 1.Hanahan D, Weinberg RA: The hallmarks of cancer. Cell 2000, 100:57-70 [DOI] [PubMed] [Google Scholar]
- 2.Peifer M, Polakis P: Wnt signaling in oncogenesis and embryogenesis—a look outside the nucleus. Science 2000, 287:1606-1609 [DOI] [PubMed] [Google Scholar]
- 3.Ilyas M, Tomlinson IPM: The interactions of APC, E-cadherin and β-catenin in tumor development and progression. J Pathol 1997, 182:128-137 [DOI] [PubMed] [Google Scholar]
- 4.Morin PJ: β-catenin signaling and cancer. BioEssays 1999, 21:1021-1030 [DOI] [PubMed] [Google Scholar]
- 5.Barker N, Clevers H: Catenins, Wnt signaling and cancer. BioEssays 2000, 22:961-965 [DOI] [PubMed] [Google Scholar]
- 6.Ben-Ze’ev A, Shtutman M, Zhurinsky J: The integration of cell adhesion with gene expression: the role of β-catenin. Exp Cell Res 2000, 261:75-82 [DOI] [PubMed] [Google Scholar]
- 7.Miller JR, Hocking AM, Brown JD, Moon RT: Mechanism and function of signal transduction by the Wnt/β-catenin and Wnt/Ca2+ pathways. Oncogene 1999, 18:7860-7872 [DOI] [PubMed] [Google Scholar]
- 8.Persad S, Troussard AA, McPhee TR, Mulholland DJ, Dedhar S: Tumor suppressor PTEN inhibits nuclear accumulation of beta-catenin and T cell/lymphoid enhancer factor 1-mediated transcriptional activation. J Cell Biol 2001, 153:1161-1174 [DOI] [PMC free article] [PubMed] [Google Scholar]
- 9.Polakis P: More than one way to skin a catenin. Cell 2001, 105:563-566 [DOI] [PubMed] [Google Scholar]
- 10.Neufeld KL, Zhang F, Cullen BR, White RL: APC-mediated downregulation of β-catenin activity involves nuclear sequestration and nuclear export. EMBO J 2000, 1:519-523 [DOI] [PMC free article] [PubMed] [Google Scholar]
- 11.Henderson BR: Nuclear-cytoplasmic shuttling of APC regulates beta-catenin subcellular localization and turnover. Nat Cell Biol 2000, 2:653-660 [DOI] [PubMed] [Google Scholar]
- 12.Hecht A, Kemler R: Curbing the nuclear activities of β-catenin. Control over Wnt target gene expression. EMBO J 2000, 1:24-28 [DOI] [PMC free article] [PubMed] [Google Scholar]
- 13.Taipale J, Beachy PA: The Hedgehog and Wnt signalling pathways in cancer. Nature 2001, 411:349-354 [DOI] [PubMed] [Google Scholar]
- 14.Orford K, Orford CC, Byers SW: Exogenous expression of the β-catenin regulates contact inhibition, anchorage-independent growth, anoikis and radiation-induced cell cycle arrest. J Cell Biol 1999, 146:855-867 [DOI] [PMC free article] [PubMed] [Google Scholar]
- 15.Damalas A, Ben-Ze’ev A, Simcha I, Shtutman M, Leal JF, Zhurinsky J, Geiger B, Oren M: Excess β-catenin promotes accumulation of transcriptionally active p53. EMBO J 1999, 18:3054-3063 [DOI] [PMC free article] [PubMed] [Google Scholar]
- 16.Damalas A, Kahan S, Shtutman M, Ben-Ze’ev A, Oren M: Deregulated β-catenin induces a p53- and ARF-dependent growth arrest and cooperates with Ras in transformation. EMBO J 2001, 20:4912-4922 [DOI] [PMC free article] [PubMed] [Google Scholar]
- 17.Sadot E, Geiger B, Oren M, Ben-Ze’ev A: Down-regulation of beta-catenin by activated p53. Mol Cell Biol 2001, 21:6768-6781 [DOI] [PMC free article] [PubMed] [Google Scholar]
- 18.Van Gijn ME, Snel F, Cleutjens JPM, Smits JFM, Blankesteijn WM: Overexpression of components of the Frizzled-Dishevelled cascade results in apoptotic cell death, mediated by β-catenin. Exp Cell Res 2001, 265:46-53 [DOI] [PubMed] [Google Scholar]
- 19.Kim K, Pang KM, Evans M, Hay ED: Overexpression of beta-catenin induces apoptosis independent of its transactivation function with LEF-1 or the involvement of major G1 cell cycle regulators. Mol Biol Cell 2000, 11:3509-3523 [DOI] [PMC free article] [PubMed] [Google Scholar]
- 20.Wong MH, Rubinfeld B, Gordon JI: Effects of forced expression of an NH2-terminal truncated beta-catenin on mouse intestinal epithelial homeostasis. J Cell Biol 1998, 141:765-777 [DOI] [PMC free article] [PubMed] [Google Scholar]
- 21.Baeg G, Matsumine A, Kuroda T, Bhattacharjee RN, Miyaashiro I, Toyoshima K, Akiyama T: The tumor suppressor gene product APC blocks cell cycle progression from G0/G1 to S phase. EMBO J 1995, 14:5618-5625 [DOI] [PMC free article] [PubMed] [Google Scholar]
- 22.Morin PJ, Vogelstein B, Kinzler KW: Apoptosis and APC in colorectal tumorigenesis. Proc Natl Acad Sci USA 1996, 93:7950-7954 [DOI] [PMC free article] [PubMed] [Google Scholar]
- 23.Pellman D: A CINtillating new job for the APC tumor suppressor. Science 2001, 291:2555-2556 [DOI] [PubMed] [Google Scholar]
- 24.Dikovskaya D, Zumbrunn J, Penman GA, Näthke IS: The adenomatous polyposis coli protein: in the limelight out at the edge. Trends Cell Biol 2001, 11:378-384 [DOI] [PubMed] [Google Scholar]
- 25.Polakis P: Wnt signaling and cancer. Genes Dev 2000, 14:1837-1851 [PubMed] [Google Scholar]
- 26.Grabsch H, Takeno S, Noguchi T, Hommel G, Gabbert HE, Mueller W: Different patterns of beta-catenin expression in gastric carcinomas: relationship with clinicopathological parameters and prognostic outcome. Histopathology 2001, 39:141-149 [DOI] [PubMed] [Google Scholar]
- 27.Ma M, Devereux TR, Stockton P, Sun K, Sills RC, Clayton N, Portier M, Flake G: Loss of E-cadherin expression in gastric intestinal metaplasia and later stage p53 altered expression in gastric carcinogenesis. Exp Toxicol Pathol 2001, 53:237-246 [DOI] [PubMed] [Google Scholar]
- 28.Bilim V, Kawasaki T, Katagari A, Wakatsuki S, Takahashi K, Tomita Y: Altered expression of β-catenin in renal cell cancer and transitional cell cancer with the absence of β-catenin gene mutations. Clin Cancer Res 2000, 6:460-466 [PubMed] [Google Scholar]
- 29.Kim YS, Kang YK, Kim JB, Han SA, Kim KI, Paik SR: Beta-catenin expression and mutational analysis in renal cell carcinomas. Pathol Int 2000, 50:725-730 [DOI] [PubMed] [Google Scholar]
- 30.Walsh SV, Loda M, Torres CM, Antonioli D, Odze RD: P53 and beta catenin expression in chronic ulcerative colitis-associated polypoid dysplasia and sporadic adenomas: an immunohistochemical study. Am J Surg Pathol 1999, 23:963-969 [DOI] [PubMed] [Google Scholar]
- 31.Papadavid E, Pignatelli M, Zakynthinos S, Krausz T, Chu AC: The potential role of abnormal E-cadherin and alpha-, beta- and gamma-catenin immunoreactivity in the determination of the biological behaviour of keratoacanthoma. Br J Dermatol 2001, 145:582-589 [DOI] [PubMed] [Google Scholar]
- 32.Park SW, Suh KS, Wang HY, Kim ST, Sung HS: Beta-catenin expression in the transitional cell zone of pilomatricoma. Br J Dermatol 2001, 145:624-629 [DOI] [PubMed] [Google Scholar]
- 33.Ridanpaa M, Fodde R, Kielman M: Dynamic expression and nuclear accumulation of beta-catenin during the development of hair follicle-derived structures. Mech Dev 2001, 109:173-181 [DOI] [PubMed] [Google Scholar]
- 34.Brabletz T, Jung A, Reu S, Porzner M, Hlubek F, Kunz-Schughart LA, Knuechel R, Kirchner T: Variable beta-catenin expression in colorectal cancers indicates tumor progression driven by the tumor environment. Proc Natl Acad Sci USA 2001, 98:10356-10361 [DOI] [PMC free article] [PubMed] [Google Scholar]
- 35.Christofori G, Semb H: The role of the cell-adhesion molecule E-cadherin as a tumor-suppressor gene. Trends Biochem Sci 1999, 24:73-76 [DOI] [PubMed] [Google Scholar]
- 36.Saito T, Oda Y, Tanaka K, Matsuda S, Tamiya S, Iwamoto Y, Tsuneyoshi M: Beta-catenin nuclear expression correlates with cyclin D1 overexpression in sporadic desmoid tumours. J Pathol 2001, 195:222-228 [DOI] [PubMed] [Google Scholar]
- 37.Jung A, Schrauder M, Oswald U, Knoll C, Sellberg P, Palmqvist R, Niedobitek G, Brabletz T, Kirchner T: The invasion front of human colorectal adenocarcinomas shows co-localization of nuclear beta-catenin, cyclin D1, and p16INK4A and is a region of low proliferation. Am J Pathol 2001, 159:1613-1617 [DOI] [PMC free article] [PubMed] [Google Scholar]
- 38.Brabletz T, Herrmann K, Jung A, Faller G, Kirchner T: Expression of nuclear beta-catenin and c-myc is correlated with tumor size but not with proliferative activity of colorectal adenomas. Am J Pathol 2000, 156:865-870 [DOI] [PMC free article] [PubMed] [Google Scholar]
- 39.Semba S, Han SY, Ikeda H, Horii A: Frequent nuclear accumulation of beta-catenin in pituitary adenoma. Cancer 2001, 91:42-48 [DOI] [PubMed] [Google Scholar]
- 40.Kuhnen C, Herter P, Muller O, Muehlberger T, Krause L, Homann H, Steinau HU, Muller KM: Beta-catenin in soft tissue sarcomas: expression is related to proliferative activity in high-grade sarcomas. Mol Pathol 2000, 13:1005-1013 [DOI] [PubMed] [Google Scholar]
- 41.Nhieu JT, Renard CA, Wei Y, Cherqui D, Zafrani ES, Buendia MA: Nuclear accumulation of mutated beta-catenin in hepatocellular carcinoma is associated with increased cell proliferation. Am J Pathol 1999, 155:703-710 [DOI] [PMC free article] [PubMed] [Google Scholar]
- 42.Nollet F, Berx G, van Roy F: The role of the E-cadherin/catenin adhesion complex in the development and progression of cancer. Mol Cell Biol Res Com 1999, 2:77-85 [DOI] [PubMed] [Google Scholar]
- 43.Clavel CE, Nollet F, Berx G, Tejpar S, Nawrocki-Rabi B, Kaplan HH, van Roy FM, Birembaut PL: Expression of the E-cadherin-catenin complex in lung neuroendocrine tumours. J Pathol 2001, 194:20-26 [DOI] [PubMed] [Google Scholar]
- 44.Pirinen RT, Hirvikoski P, Johansson RT, Hollmén S, Kosma V-M: Reduced expression of a-catenin, β-catenin, and γ-catenin is associated with high cell proliferative activity and poor differentiation in non-small cell lung cancer. J Clin Pathol 2001, 54:391-395 [DOI] [PMC free article] [PubMed] [Google Scholar]
- 45.Kase S, Sugio K, Yamasaki K, Okamoto T, Yano T, Sugimachi K: Expression of E-cadherin and β-catenin in human non-small cell lung cancer and the clinical significance. Clin Cancer Res 2000, 6:4789-4796 [PubMed] [Google Scholar]
- 46.Retera J, Leers M, Sulzer M, Theunisen P: The expression of β-catenin in non-small-cell lung cancer: a clinicopathological study. J Clin Pathol 1998, 51:891-894 [DOI] [PMC free article] [PubMed] [Google Scholar]
- 47.Toyoyama H, Nuruki K, Ogawa H, Yanagi M, Matsumoto H, Nishijima H, Shimotakahara T, Aikou T, Ozawa M: The reduced expression of E-cadherin, α-catenin and γ-catenin but not β-catenin in human lung cancer. Oncol Rep 1999, 6:81-85 [DOI] [PubMed] [Google Scholar]
- 48.Kimura K, Endo Y, Yonemura Y, Heizmann CW, Schafer BW, Watanabe Y, Sasaki T: Clinical significance of S100A4 and E-cadherin-related adhesion molecules in non-small cell lung cancer. Int J Oncol 2000, 16:1125-1131 [DOI] [PubMed] [Google Scholar]
- 49.Ramasami S, Kerr KM, Chapman AD, King G, Cockburn JS, Jeffrey RR: Expression of CD44v6 but not E-cadherin or beta-catenin influences prognosis in primary pulmonary adenocarcinoma. J Pathol 2000, 192:427-432 [DOI] [PubMed] [Google Scholar]
- 50.Shibanuma H, Hirano T, Tsuji K, Wu Q, Shrestha B, Konaka C, Ebihara Y, Kato H: Influence of E-cadherin dysfunction upon local invasion and metastasis in non-small cell lung cancer. Lung Cancer 1998, 22:85-95 [DOI] [PubMed] [Google Scholar]
- 51.Nawrocki B, Polette M, Van Hengel J, Tournier JM, Van Roy F, Birembaut P: Cytoplasmic redistribution of E-cadherin-catenin adhesion complex is associated with down-regulated tyrosin phosphorylation of E-cadherin in human bronchopulmonary carcinomas. Am J Pathol 1998, 153:1521-1530 [DOI] [PMC free article] [PubMed] [Google Scholar]
- 52.Hommura F, Furuuchi K, Yamazaki K, Ogura S, Kinoshita I, Shimi M, Moriuchi T, Katoh H, Nishimura M, Dosaka-Akita H: Increased expression of beta-catenin predicts better prognosis in nonsmall cell lung carcinomas. Cancer 2002, 94:752-758 [DOI] [PubMed] [Google Scholar]
- 53.Gorgoulis VG, Zacharatos P, Kotsinas A, Mariatos G, Liloglou T, Vogiatzi T, Foukas P, Rassidakis G, Garinis G, Ioannides T, Zoumpourlis V, Bramis J, Michail PO, Asimacopoulos PJ, Field JK, Kittas C: Altered expression of the cell cycle regulatory molecules pRb, P53 and MDM2 exert a synergetic effect on tumor growth and chromosomal instability in non-small cell lung carcinomas (NSCLC). Mol Med 2000, 6:208-237 [PMC free article] [PubMed] [Google Scholar]
- 54.Gorgoulis VG, Zacharatos P, Kotsinas A, Liloglou T, Kyroudi A, Veslemes M, Rassidakis A, Halazonetis TD, Field JK, Kittas C: Alterations of the p16-pRb pathway and the chromosome locus 9p21-22 in non-small-cell lung carcinomas: relationship with p53 and MDM2 protein expression. Am J Pathol 1998, 153:1749-1765 [DOI] [PMC free article] [PubMed] [Google Scholar]
- 55.Tsoli E, Gorgoulis VG, Zacharatos P, Kotsinas A, Mariatos G, Kastrinakis NG, Kokotas S, Kanavaros P, Asimacopoulos PJ, Bramis J, Kletsas D, Papavassiliou AG: Low levels of p27 in association with deregulated p53-pRb protein status enhance tumor proliferation and chromosomal instability in non-small cell lung carcinomas. Mol Med 2001, 7:418-429 [PMC free article] [PubMed] [Google Scholar]
- 56.Gorgoulis VG, Zacharatos P, Mariatos G, Kotsinas A, Bouda M, Kletsas D, Asimacopoulos PJ, Agnantis N, Kittas C, Papavassiliou A: Transcription factor E2F-1 acts as a growth promoting factor and is associated with adverse prognosis in non-small cell lung carcinomas (NSCLCs). J Pathol 2002, 198:142-156 [DOI] [PubMed] [Google Scholar]
- 57.Midgley CA, White S, Howitt R, Save V, Dunlop MG, Hall PA, Lane D, Wyllie AH, Bubb VJ: APC expression in normal human tissues. J Pathol 1997, 181:426-433 [DOI] [PubMed] [Google Scholar]
- 58.Smith KJ, Johnson KA, Bryan TM, Hill DE, Markowitz S, Willson JKV, Paraskeva C, Petersen GM, Hamilton SR, Vogelstein B, Kinzler KW: The APC gene product in normal and tumor cells. Proc Natl Acad Sci USA 1993, 90:2846-2850 [DOI] [PMC free article] [PubMed] [Google Scholar]
- 59.Gavrieli Y, Sherman Y, Ben-Sasson S: Identification of programmed cell death in situ via specific labelling of nuclear DNA fragmentation. J Cell Biol 1992, 119:493-501 [DOI] [PMC free article] [PubMed] [Google Scholar]
- 60.Hirano T, Franzen B, Kato H, Ebihara Y, Auer G: Genesis of squamous-cell lung carcinoma. Sequential changes of proliferation, DNA ploidy, and p53 expression. Am J Pathol 1994, 144:296-302 [PMC free article] [PubMed] [Google Scholar]
- 61.Browne SJ, Williams AC, Hague A, Butt AJ, Paraskeva C: Loss of APC protein expressed by human colonic epithelial cells and the appearance of a specific low-molecular-weight form is associated with apoptosis in vitro. Int J Cancer 1994, 59:56-64 [DOI] [PubMed] [Google Scholar]
- 62.Sellin JH, Umar S, Xiao J, Morris AP: Increased beta-catenin expression and nuclear translocation accompany cellular hyperproliferation in vivo. Cancer Res 2001, 61:2899-2906 [PubMed] [Google Scholar]
- 63.Cooper CA, Bubb VJ, Smithson N, Carter RL, Gledhill S, Lamb D, Wyllie AH, Carey FA: Loss of heterozygosity at 5q21 in non-small cell lung cancer: a frequent event but without evidence of APC mutation. J Pathol 1996, 180:33-37 [DOI] [PubMed] [Google Scholar]
- 64.Ueda M, Gemmill RM, West J, Winn R, Sugita M, Tanaka N, Ueki M, Drabkin HA: Mutations of the beta- and gamma-catenin genes are uncommon in lung, breast, kidney, cervical and ovarian carcinomas. Br J Cancer 2001, 85:64-68 [DOI] [PMC free article] [PubMed] [Google Scholar]
- 65.Sunaga N, Kohno T, Kolligs FT, Fearon ER, Saito R, Yokota J: Constitutive activation of the Wnt signaling pathway by CTNNB1 (beta-catenin) mutations in a subset of human lung adenocarcinoma. Genes Chromosom Cancer 2001, 30:316-321 [DOI] [PubMed] [Google Scholar]
- 66.Shigemitsu K, Sekido Y, Usami N, Mori S, Sato M, Horio Y, Hasegawa Y, Bader SA, Gazdar AF, Minna JD, Hida T, Yoshioka H, Imaizumi M, Ueda Y, Takahashi M, Shimokata K: Genetic alterations of the beta-catenin gene (CTNNB1) in human lung cancer and malignant mesothelioma and identification of a new 3p21.3 homozygous deletion. Oncogene 2001, 20:4249-4257 [DOI] [PubMed] [Google Scholar]
- 67.Virmani AK, Rathi A, Sathyanarayana UG, Padar A, Huang CX, Cunnigham HT, Farinas AJ, Milchgrub S, Euhus DM, Gilcrease M, Herman J, Minna JD, Gazdar AF: Aberrant methylation of the adenomatous polyposis coli (APC) gene promoter 1A in breast and lung carcinomas. Clin Cancer Res 2001, 7:1998-2004 [PubMed] [Google Scholar]
- 68.Brabender J, Usadel H, Danenberg KD, Metzger R, Schneider PM, Lord RV, Wickramasinghe K, Lum CE, Park J, Salonga D, Singer J, Sidransky D, Holscher AH, Meltzer SJ, Danenberg PV: Adenomatous polyposis coli gene promoter hypermethylation in non-small cell lung cancer is associated with survival. Oncogene 2001, 20:3528-3532 [DOI] [PubMed] [Google Scholar]
- 69.Lundberg SA, Weinberg RA: Control of the cell cycle and apoptosis. E J Cancer 1999, 35:1886-1894 [DOI] [PubMed] [Google Scholar]
- 70.Mariatos G, Gorgoulis VG, Zacharatos P, Kotsinas A, Vogiatzi T, Rassidakis G, Foukas P, Liloglou T, Tiniakos D, Angelou N, Manolis EN, Veslemes M, Field JK, Kittas C: Expression of p16INK4A and alterations of the 9p21-23 chromosome region in non-small cell lung carcinomas: relationship with tumor growth parameters and ploidy status. Int J Cancer 2000, 89:133-141 [DOI] [PubMed] [Google Scholar]
- 71.Sekido Y, Fong KM, Minna JD: Progress in understanding the molecular pathogenesis of human lung cancer. Biochim Biophys Acta 1998, 1378:F21-F59 [DOI] [PubMed] [Google Scholar]
- 72.Brocardo MG, Bianchini M, Radrizzani M, Reyes GB, Dugour AV, Taminelli GL, Gonzalez Solveyra C, Santa-Coloma TA: APC senses cell-cell contacts and moves to the nucleus upon their disruption. Biochem Biophys Res Commun 2001, 284:982-986 [DOI] [PubMed] [Google Scholar]
- 73.Zhang F, White RL, Neufeld KL: Cell density and phosphorylation control the subcellular localization of adenomatous polyposis coli protein. Mol Cell Biol 2001, 21:8143-8156 [DOI] [PMC free article] [PubMed] [Google Scholar]
- 74.Pomerantz J, Shreiber-Agus N, Liegeois N, Silverman A, Alland L, Chin L, Potes J, Chen K, Orlow I, Lee H-W, Cordon-Cardo C, DePinho RA: The ink4a tumor suppressor gene product, p19ARF, interacts with MDM2 and neutralizes MDM2’s inhibition of p53. Cell 1998, 92:713-723 [DOI] [PubMed] [Google Scholar]
- 75.Zhang Y, Xiong Y, Yarbrourgh WG: ARF promotes MDM2 degradation and stabilizes p53: aRF-INK4a locus deletion impairs both the Rb and p53 tumor suppression pathways. Cell 1998, 92:725-734 [DOI] [PubMed] [Google Scholar]
- 76.Yang W, Shen J, Wu M, Arsura M, FitzGerald M, Suldan Z, Kim DW, Hofman CS, Pianetti S, Romieu-Mourez R, Freedman LP, Sonenshein GE: Repression of transcription of the p27 (Kip1) cyclin-dependent kinase inhibitor gene by c-Myc. Oncogene 2001, 20:1688-1702 [DOI] [PubMed] [Google Scholar]
- 77.St Croix B, Sheehan C, Rak JW, Florenes VA, Slingerland JM, Kerbel RS: E-cadherin-dependent growth suppression is mediated by the cyclin-dependent kinase inhibitor p27KIP1. J Cell Biol 1998, 142:557-571 [DOI] [PMC free article] [PubMed] [Google Scholar]
- 78.Stockinger A, Eger A, Wolf J, Beug H, Foisner R: E-cadherin regulates cell growth by modulating proliferation-dependent β-catenin transcriptional activity. J Cell Biol 2001, 154:1185-1196 [DOI] [PMC free article] [PubMed] [Google Scholar]