

Abstract
2-Amino-1-methyl-6-phenylimidazo[4,5-b]pyridine (PhIP) is a potent rodent carcinogen and a potential human carcinogen because of its existence in the normal human diet. N2-OH-PhIP, a major PhIP metabolite, has been identified as a precursor of genotoxic species. In vitro data supported the view that CYP1A2 is the major enzyme responsible for the formation of N2-OH-PhIP. However, disruption of the CYP1A2 gene in mouse failed to inhibit PhIP-induced carcinogenesis. To investigate the mechanism underlying this observation, the metabolism of PhIP in wild-type, Cyp1a2-null, and CYP1A2-humanized mice was examined in detail using a metabolomic approach. Following data acquisition in a high-resolution LCMS system, urinary metabolomes of the control and PhIP-treated mice were characterized in a principal component analysis (PCA) model. Comprehensive metabolite profiles of PhIP in high dose (10 mg/kg) and low dose (100 μg/kg) were established through analyzing urinary ions contributing to the separation of three mouse lines in the multivariate model and by measuring radiolabled PhIP metabolite in a radio-HPLC assay, respectively. The genotoxicity of PhIP to three mouse lines was evaluated by measuring DNA adduction levels in liver, lung, colon, and mammary gland. On the basis of the chemical identities of 17 urinary PhIP metabolites, including eight novel metabolites, multivariate data analysis revealed the role of CYP1A2 in PhIP metabolism and a human-mouse interspecies difference in the catalytic activity of CYP1A2. In addition, the results also showed that Cyp1a2-null mice still possess significant N2- hydroxylation and DNA adduction activities, which may be partially attributed to mouse CYP2C enzymes according to the results from in vitro microsome and Supersome incubations and antibody inhibition experiments.
Introduction
2-Amino-1-methyl-6-phenylimidazo[4,5-b]pyridine (PhIP)1 is one of the most abundant heterocyclic amines (HCA) formed in the process of cooking meat and is also found in beer, wine, and cigarette smoke (1). Detection of PhIP and its metabolites in the urine of people eating a normal Japanese diet as well as in smokers of black tobacco demonstrated extensive human exposure (2, 3). Induction of carcinomas in rodent lymph, mammary gland, and colon further strengthened its candidacy as a human carcinogen (4, 5). It is known that PhIP must first be oxidized by cytochrome P450 (P450) and then activated by conjugation enzymes such as N-acetyltransferases (6) and sulfotransferases before eliciting its genotoxicity (7). The generation of a DNA-reactive nitrenium cation has been recognized as an essential step in the process of forming PhIP-DNA adducts.
The metabolism of PhIP has been studied extensively by using rodent and nonhuman primate animal models (8) as well as in vitro models (9). Major oxidation metabolites of PhIP are N2- hydroxy-PhIP (OH-PhIP) and 4′-OH-PhIP. Recently, 5-OH-PhIP was identified in mouse urine, and its formation was suggested to be through a P450-independent pathway (10, 11). Detoxification of reactive N2-OH-PhIP is mainly mediated by glucuronidation pathways to form N2-OH-PhIP-N2-glucuronide and N2-OH-PhIP-N3-glucuronide (12, 13), although both glucuronidation and sulfation reactions contribute to the elimination of 4′-OH-PhIP. Because of its high abundance in both human and rodent livers and its high catalytic activity as a PhIP-N2- hydroxylase (14), CYP1A2 was suggested as an essential enzyme for the bioactivation of PhIP. However, we recently reported comparable tumorigenesis in both wild-type and Cyp1a2-null mice after PhIP treatment, which implied the existence of CYP1A2-independent bioactivation pathways (15).
Metabolomics, as a rapidly evolving tool in systems biology, aims to define small-molecule metabolomes in cells, tissues, and organisms and to monitor the changes following genetic modification or exogenous challenges (16, 17). Because multivariate data analysis (MDA), the data-processing platform of metabolomics, possesses the capacity of detecting subtle changes in a large data set, the potential application of MDA in drug metabolism and chemical toxicology has been illustrated (18). However, the power of MDA in solving problems in both fields has not been fully explored.
To elucidate the role of CYP1A2 in PhIP-induced carcino-genesis, the metabolism of PhIP in wild-type, Cyp1a2-null, and CYP1A2-humanized mice was examined in detail in this study through a metabolomic approach, and tissue-specific DNA adduction caused by the bioactivation of PhIP was measured. In addition, the role of other P450s in PhIP metabolism was also investigated.
Experimental Procedures
Chemicals and Reagents
PhIP and N2-OH-PhIP were obtained from the National Cancer Institute Chemical Carcinogen Reference Standard Repository at the Midwest Research Institute (Kansas City, MO). 4′-OH-PhIP was kindly provided by Dr. Minako Nagao (National Cancer Research Center, Tokyo, Japan). [14C]PhIP was purchased from Toronto Research Chemicals (North York, Ontario, Canada). The radiochemical purity of [14C]PhIP was determined to be >98% pure by HPLC (isocratic at 40% methamol). HPLC-grade acetonitrile, methanol, and formic acid as well as β-nicotinamide adenine dinucleotide (β-NADPH) were purchased from Sigma (St. Louis, MO). Pooled human liver microsomes (HLM) and recombinant human P450 enzymes (CYP1A1, 1A2, 1B1, 2A6, 2B6, 2C8, 2C9, 2C18, 2C19, 2D6, 2E1, and 3A4) from baculovirus-infected insect cells were purchased from either BD Biosciences Genetest (San Jose, CA) or Invitrogen Panvera (Carlsbad, CA).
Animals
Both the Cyp1a2-null mouse line (mCyp1a2-/-) and the CYP1A2- humanized mouse line on a Cyp1a2-null background (hCYP1A2+/+, mCyp1a2-/-) were described previously (19, 20). Wild-type mice (mCyp1a2+/+) on a 129/Sv strain background were used in this study. All animals were maintained in a NCI animal facility under a standard 12 h light/12 h dark cycle with food and water ad libitum. Handling and treatment procedures were in accordance with animal study protocols approved by the NCI Animal Care and Use Committee.
In Vivo Metabolism of PhIP in Mice
Four male mice from each genotype group, age 8-12 weeks, were used for urinary metabolite profiling. Urine samples were collected by housing mice for 24 h in glass metabolic bowls (Jencons, Leighton Buzzard, United Kingdom), urine volumes were recorded, and the urines were stored frozen at -80 °C before analysis. Two days prior to PhIP treatment, control urine samples were collected after dosing mice with corn oil vehicle (100 μL/10 g). PhIP (suspended in corn oil) was administrated by oral gavage in a 10 mg/kg dose. After urine collection, mice were sacrificed and the tissues were harvested and snap-frozen in liquid nitrogen before storage at -80 °C. Samples for ultraperformance liquid chromatography (UPLC)-time-of-flight mass spectrometry (TOF-MS) analysis were prepared by mixing 50 μL of urine with 200 μL of 50% aqueous acetonitrile and centrifuging at 18000g for 5 min to remove protein and particulates. A 200 μL aliquot of the supernatant was transferred to an autosampler vial for further analysis.
For the radioactivity study, mice received 100 μg/kg [14C]PhIP (6.3 μCi/kg) in corn oil by oral gavage. Urine samples were collected in metabolic cages for 24 h. Tissue samples were harvested after urine collection.
In Vitro Metabolism of PhIP in Mouse Liver Microsomes (MLMs) and HLM
Livers from untreated wild-type, Cyp1a2-null, and CYP1A2-humanized mice were homogenized, and microsomes were prepared as described previously (21). Microsomal incubations were carried out in 20 mM phosphate-buffered saline (PBS), pH 7.4, containing 0.5 mg/mL microsomal protein, 2 mM MgCl2, 10 μM PhIP, and 1 mg/mL freshly prepared β-NADPH in a final volume of 200 μL. After a 20 min incubation at 37 °C, the reaction mix was directly loaded into a pretreated Oasis column (Waters, Milford, MA) and washed with 1 mL of water, and metabolites were eluted with 1 mL of methanol. The extract was dried under N2 and reconstituted in 50% aqueous acetonitrile for liquid chromatography-tandem mass spectrometry (LC-MS/MS) analysis.
In Vitro Metabolism of PhIP by Recombinant Human P450 Isozymes
Reactions were carried out in 20 mM PBS, pH 7.4, containing 20 nM recombinant human P450s, 2 mM MgCl2, 10 μM PhIP, and 1 mg/mL freshly prepared β-NADPH in a final volume of 200 μL. After 20 min of incubation at 37 °C, samples for LC-MS/MS analysis were prepared under the same conditions as described above.
Enzyme Kinetics of Recombinant Human CYP1A2 and CYP2C19 Isozymes
PhIP ranging from 1 to 500 μM was incubated with recombinant human CYP1A2 and CYP2C19 isozymes for 20 min under the same conditions as described above. Kinetic parameters, Km and Vmax, for the formation of 4′-OH-PhIP and N2-OH-PhIP were evaluated by nonlinear regression (Prism GraphPad 2.0, San Diego, CA).
Antibody Inhibition of PhIP Metabolism
In contrast to the aforementioned conditions for microsomal incubation, 5 μL of mouse CYP1A2 [monoclonal antibody (mAb) 1-7-1] (22) and rat CYP2C11 (mAb 1-68-11) (23) monoclonal antibodies was preincubated with the microsomes for 5 min before adding PhIP and β-NADPH. Reactions were terminated at 20 min, and samples were processed under the same conditions as described above.
LC-ESI-MS/MS Analysis of PhIP Metabolites
For LC-MS analysis, a 5 μL aliquot of samples from mouse urine or in vitro incubation was injected into a Waters UPLC-QTOF-MS system (Mildford, MA). An Acquity UPLC BEH C18 column (Waters) was used to separate PhIP and its metabolites at 30 °C. The mobile phase flow rate was 0.5 mL/min with a gradient ranging from water to 95% aqueous acetonitrile containing 0.1% formic acid over a 10 min run. The QTOF Premier mass spectrometer was operated in the positive electrospray ionization (ESI) mode. The capillary voltage and cone voltage were maintained at 3 kV and 20 V, respectively. The source temperature and desolvation temperature were set at 120 and 350 °C, respectively. Nitrogen was used as both the cone gas (50 L/h) and the desolvation gas (600 L/h), and argon was used as the collision gas. For accurate mass measurement, the QTOF-MS was calibrated with sodium formate solution (range m/z 100-1000) and monitored by the intermittent injection of the lock mass sulfadimethoxine ([M + H]+ = 311.0814 m/z) in real time. Mass chromatograms and mass spectral data were acquired by MassLynx software in centroided format and were further processed by MetaboLynx software to screen and identify potential PhIP metabolites through the mass difference from the PhIP protonated molecular ion ([M + H]+ = 225.1140 m/z). The structure of each PhIP metabolite was elucidated by tandem mass spectrometry (MS2) fragmentation with a collision energy ranging from 15 to 35 eV.
Data Processing and Principal Components Analysis (PCA)
Following UPLC-TOF-MS data acquisition on the control and PhIP-treated urine samples, chromatographic and spectral data were first centroided and integrated and then deconvoluted by MarkerLynx software (Waters) to generate a multivariate data matrix. The intensity of each ion was calculated as the percentage of total ion counts in the whole chromatogram. The data matrix was further exported into SIMCA-P+ software (Umetrics, Kinnelon, NJ) and transformed by mean-centering and Pareto scaling, a technique that increased the importance of low abundance ions without significant amplification of noise. Principal components were generated by PCA analysis to represent the major latent variables in the data matrix and were described in a scores scatter plot. Potential PhIP metabolites were identified by analyzing ions contributing to the principal components and to the separation of sample groups in the loadings scatter plot.
Analysis of Radiolabeled PhIP Metabolites in Mouse Urine
Collected urine was thawed, and the total volume of each fraction was recorded. A 0.5 mL aliquot from each fraction was analyzed for 14C content by liquid scintillation counting (Wallic, Gaithersburg, MD). A 0.5 mL aliquot of each urine sample was then analyzed by reversed-phase HPLC for PhIP and PhIP metabolites by directly injecting the samples onto a Rainin HPLC system (Varian, Walnut Creek, CA) equipped with a 5 μm, 4.6 mm 150 mm TSK-GEL ODS-80 TM C18 column (Tosoh Bioscience, × Montgomeryville, PA) and monitored at 315 nm. Metabolites were eluted at 0.75 mL/min initially using a solvent of 10% (v/v) methanol/0.1% (v/v) triethylamine (pH 6), for 2 min. This was followed by a gradient to 33% (v/v) methanol/0.1% triethylamine at 32 min, followed by a final gradient to 55% (v/v) methanol/0.1% triethylamine at 60 min. The methanol concentration was maintained at 55% (v/v) from 60 to 70 min. The column eluate was collected at 1 min intervals, and the radioactivity was quantified by scintillation counting. The radiolabled PhIP metabolites were identified through the comparison with authentic standards.
DNA Isolation and Adduct Analysis
DNA isolation from mouse liver, lung, colon, and mammary gland and sample preparation for the quantification of DNA adduct levels by accelerator mass spectrometer (AMS) have been reported previously (12). Briefly, tissues were homogenized and then digested in lysis buffer (4 M urea, 1.0% Triton X-100, 10 mM EDTA, 100 mM NaCl, 10 mM DTT, and 10 mM Tris-HCl, pH 8.0) containing 0.8 mg/mL proteinase K overnight at 37 °C. Undigested tissue was removed by centrifugation, and the supernatant was treated for 1 h at room temperature with RNase A (0.5 mg/mL) and RNase T1 (5 μg/mL). DNA was extracted using Qiagen column chromatography (Qiagen, Valencia, CA) according to the manufacturer’s instructions. DNA purity was determined by the A260 nm/A280 nm ratio. A ratio between 1.6 and 1.8 indicated DNA purity. Pure DNA samples were submitted for adduct analysis by AMS.
Statistics
Experimental values are expressed as means ± standard deviations (SDs). Statistical analysis was performed with two-tailed Student’s t tests for unpaired data, where a P value of <0.01 was considered statistically significant.
Results
Metabolomic Comparison of Urine Samples from Wild-Type, Cyp1a2-Null, and CYP1A2-Humanized Mice Treated with PhIP
To elucidate the metabolism profile of PhIP at a carcinogenic dose, wild-type, Cyp1a2-null, and CYP1A2- humanized mice were treated with 10 mg/kg of PhIP. Control and PhIP-treated urine samples were separated by the UPLC system, and urinary components were detected by a high-resolution TOF mass spectrometer. After acquired data were processed by an unsupervised PCA, a three-component PCA model (R2 = 0.568, Q2 = 0.402) was constructed to depict metabolomic profiles of control and PhIP-treated urines from three mouse lines (Figure 1). As shown in the scores scatter plot (Figure 1A), while control samples from three mouse lines were close to each other in the model, PhIP treatment led to the distinctive separation of urine samples according to their genotypes, which indicated that the chemical composition of urine samples from all three mouse lines was affected differentially by PhIP and its metabolites. One distinguishing feature of the PhIP-induced metabolomic changes was that as wild-type and humanized mice shifted away from their respective controls, mainly in the first two principal components (t[1] and t[2]), Cyp1a2-null mice also distanced themselves from the control in the third component (t[3]) of the PCA model after PhIP treatment, indicating that the PhIP metabolism in Cyp1a2- null mice may significantly differ from its metabolism in wild-type and humanized mice. To understand this phenomenon, the contribution of each ion to all three principal components was examined in a loadings scatter plot (Figure 1B), in which the spatial position of each ion corresponds to its weights or loading values to principal components (p[1], p[2], and p[3]). Because PhIP and its metabolites can only be detected in treated samples, a group of PhIP metabolite candidates were identified through examining ions that contributed heavily to the separation between control and treated samples, and their accurate masses were subsequently measured. Mass differences between them and the PhIP parent ion indicated that the seurinary PhIP metabolites originated from hydroxylation, methylation, glucuronidation, and sulfation reactions, either separately or collectively.
Figure 1.

PCA on urine metabolomes of control and PhIP-treated wild-type, Cyp1a2-null, and CYP1A2- humanized mice. Data acquisition and analysis are described in the Experimental Procedures. (A) Scores scatter plot of PCA model on 24 h urine samples from the control (wild-type, △; Cyp1a2-null, ◇; and CYP1A2-humanized, □) and PhIP-treated (wild-type, ▲; Cyp1a2-null, ◆ and CYP1A2- humanized, ■) mice. The t[1], t[2], and t[3] values represent the scores of each sample in principle components 1, 2, and 3, respectively. Fitness and prediction power of three components in the model are represented as R2 and Q2 values in the inset chart (upper right), respectively. (B) Loadings scatter plot of all detected urinary ions in the PCA model. The p[1], p[2], and p[3] values represent the contributing weights of each ion to principal components 1, 2, and 3, respectively.
Identification and Structural Elucidation of Urinary Metabolites of PhIP
To achieve an exhaustive detection and a comprehensive coverage of urinary metabolites of PhIP, a software-assisted metabolite screening (as described in the Experimental Procedures) was conducted based on the data from MDA and accurate mass measurement. Values of theoretical mass changes caused by the common metabolizing reactions were used as the criteria for identifying metabolites from the PhIP-treated samples. After the screening, structural identities of urinary PhIP metabolites were further elucidated based on the fragmentation information obtained from MS2 analysis and current knowledge on the fragmentation pattern and retention time of PhIP metabolites in LC-MS analysis. Overall, PhIP (I) and 17 metabolites were identified in the urine samples from three mouse lines. Nine of them (III, IV, V, VII, XI, XII, XIII, XVI, and XVII) are known metabolites, and eight of them (II, VI, VIII, IX, X, XIV, XV, and XVIII) are novel metabolites. Major MS2 fragment ions and retention time (RT) of PhIP metabolites are enlisted and interpreted as follows, and MS2 spectra of six new metabolites (II, VI, IX, X, XIV, and XV) are presented in Figure 2A-F (MS2 spectra of I, III, IV, V, VII, VIII, XI, XII, XIII, XVI, XVII, and XVIII in the Supporting Information, Figure 1A-L).
Figure 2.

LC-MS/MS structural elucidation of urinary PhIP metabolites. Conditions for LC-MS/MS were described in the Experimental Procedures. MS2 fragmentation was conducted with collision energy ramping from 15 to 35 eV. (A) MS2 fragmentation of N2-methyl-PhIP (II). (B) MS2 fragmentation of N2-methyl-PhIP-4′-OH-PhIP (VI). (C) MS2 fragmentation of N2,4′-diOH-PhIP sulfate (IX). (D) MS2 fragmentation of 5,4′-diOHPhIP sulfate (X). (E) MS2 fragmentation of 5-OH-PhIP glucuronide (XIV) with inlaid spectrum of deconjugated 5-OH-PhIP ion. (F) MS2 fragmentation of 4′-OH-PhIP-N2-glucuronide (XV) with inlaid spectrum of deconjugated 4′-OH-PhIP ion. Major daughter ions from fragmentation were interpreted in the inlaid structural diagrams.
PhIP (3.95 min): 225.117+ (parent ion), 210.091+ (-CH3), 209.083+ (-NH2), 183.082+ (-CHdN from 210.091+), 182.078+ (-CHdN from 209.083+), 168.070+ (-NH2 from 183.082+ or -CH3 from 182.078+). The identity of PhIP in urine was also confirmed by comparison with the authentic standard.
N2-methyl-PhIP (4.51 min, Figure 2A): 239.130+ (parent), 224.102+ (-CH3 from N1 position); 223.099+, 196.089+, and 179.070+ potentially originated from the structural rearrangement of imidazole ring to pyrazine ring, which is similar to N2-OH-PhIP (IV).
4′-OH-PhIP (2.81 min): 241.115+ (parent ion), 226.083+ (-CH3), 225.081+ (-NH2), 198.084+ (-CO from 226.083+). The identity of 4′-OH-PhIP in urine was also confirmed by comparison with the authentic standard.
N2-OH-PhIP (3.83 min): 223.100+ (-H2O); ions 206.072+, 196.084+ and 179.064+ were potentially generated through the rearrangement of imidazole ring to pyrazine ring, as described in the Supporting Information (Figure 1C). The identity of N2-OH-PhIP in urine was also confirmed by comparison with the authentic standard.
5-OH-PhIP (4.07 min): 241.112+ (parent ion), 226.082+ (-CH3), 223.104+ (-H2O), 196.074+ (-CHdN from 223.094+). The fragmentation pattern of metabolite V was consistent with the reported 5-OH-PhIP fragmentation pattern (9).
N2-methyl-4′-OH-PhIP (3.20 min, Figure 2B): 255.125+ (parent ion), 240.097+ (-CH3); 239.094+, 212.083+, and 195.060+ were generated by ring rearrangement similar to N2- methyl-PhIP (II) and N2-OH-PhIP (IV). 4′-Hydroxylation was assumed after excluding N2- and 5-hydroxylation through examination of the MS2 fragments.
4′-OH-PhIP sulfate (2.59 min): 321.065+ (parent ion), 241.109+ (-SO3), 226.088+ (-CH3 from 241.109 ), 213.111+ (-C=O from 241.109+).
5-OH-PhIP sulfate (2.87 min): 321.067+ (parent ion), 241.108+ (-SO3 ), 226.084+ (-CH3 from 241.109+), 196.068+ (-H2O and -CHdN from 223.094+).
N2,4′-diOH-PhIP sulfate (2.47 min, Figure 2C): 337.066+ (parent ion), 320.056+ (-OH), 257.105+ (-SO3), 239.092+ (-H2 O from 257.105+ ), 228.101+ (-CHO from 257.105+).
5,4′-DiOH-PhIP sulfate (2.67 min, Figure 2D): 337.058+ (parent ion), 257.102+ (-SO3), 242.081+ (-CH3 from 257.101+), 228.102+ (-CHO from 257.101+).
PhIP-N3-glucuronide (3.21 min): 401.142+ (parent ion), 225.117+ (-C6H8O6).
PhIP-N2-glucuronide (3.72 min): 401.148+ (parent ion), 225.116+ (-C6H8O6). Identities of metabolites XI and XII were assigned based on their RT since previous studies showed that PhIP-N3-glucuronide had a shorter RT than PhIP-N2-glucuronide (24, 25).
4′-OH-PhIP glucuronide (2.19 min): 417.147+ (parent ion), 241.110+ (-C6H8O6), 226.072+ (-CH3 from 241.110+).
5-OH-PhIP glucuronide (2.89 min, Figure 2E): 417.142+ (parent ion), 241.111+ (-C6H8O6), 223.102+ (-H2O from 241.107+), 196.086+ (-CHdN from 223.102+).
4′-OH-PhIP-N2-glucuronide (3.10 min, Figure 2F): 417.137+ (parent ion), 241.111+ (-C6H8O6), 226.072+ (-CH3 from 241.111+), 198.074+ (-CO from 226.072+). The glucuronidation site was putatively assigned to N2 since N2 is a more favored site than N3 when N2 is not hydroxylated.
N2-OH-PhIP-N2-glucuronide (3.40 min): 417.143+ (parent ion), 241.110+ (-C6H8O6), 223.096+ (-H2O from 241.110+), ions 206.067+ and 196.055+ (from structural rearrangement).
N2-OH-PhIP-N3-glucuronide (4.47 min): 417.154+ (parent ion), 241.110+ (-C6H8O6), 225.117+ (structural rearrangement to PhIP, -O from 241.110+), 224.102+ (-OH from 241.110+). The RT of this metabolite was longer than N2-OHPhIP-N2-glucuronide (XVI) as reported previously (13).
N2,4′-diOH-PhIP glucuronide (2.25 min): 433.134+ (parent), 257.114+ (-C6H8O6), 240.102+ (-OH from 257.114+), 239.093+ (-H2O from 257.114+).
On the basis of the above-mentioned structural information on PhIP metabolites, a comprehensive PhIP metabolism map was constructed (Figure 3). Total 17 PhIP metabolites were generated through individual reaction or the combination of oxidation and conjugation reactions, including N2-, 5-, and 4′-hydroxylation; O-sulfation; O-, N2-, and N3-glucuronidation; and N-methylation.
Figure 3.

Major in vivo PhIP metabolism pathways. Both oxidation and conjugation metabolizing enzymes convert PhIP (I), collectively or separately, into 17 structurally diversified metabolites. CYP-dependent or -independent oxidation reactions at N2, C5, and C4′ positions transform PhIP to three monohydroxylated metabolites (III-V), which can be further metabolized to two dihydroxylated metabolites. Besides catalyzing direct N-conjugation of PhIP (I) to metabolites XI and XII, UDP-glucuronosyltransferases (UGTs) can also convert oxidized metabolites into glucuronides (XIII, XIV, XV, XVI, XVII, and XVIII). Cytosolic sulfotransferases (SULTs) can metabolize oxidized metabolites to sulfates (VII, VIII, IX, and X), and N-methyltransferases (NMTs) can form more hydrophobic metabolite II, which can be further metabolized to metabolite VI. Solid lines represent oxidation reactions, and dashed lines represent conjugation reactions.
Relative Composition of Urinary PhIP Metabolites in Wild-Type, Cyp1a2-Null, and CYP1A2-Humanized Mice
Discrete separation of PhIP-treated urine samples in a three-humanized mice as evidenced by the high abundance of N2- hydroxy metabolites (XVI, N2-OH-PhIP-N2-glucuronide; and XVII, N2-OH-PhIP-N3-glucuronide) and relatively low abundance of 4′-hydroxy metabolites (III,4′-OH-PhIP; VII,4′-OHPhIP sulfate; XIII, 4′-OH-PhIP glucuronide; and XV, 4′-OHPhIP-N2-glucuronide). Third, the absence of CYP1A2 in Cyp1a2- null mice diverted PhIP metabolism from oxidation reactions to conjugation reactions, causing dramatic increases of the N-methylation products (II, N2-methyl-PhIP; and VI, N2-methyl-4′-OH-PhIP) and a metabolite arising from direct glucuronidation (XII, PhIP-N2-glucuronide), which also contributed to the separation of PhIP-treated Cyp1a2-null mice from other animal groups in the third principal component. However, it should be noted that N2-OH-PhIP-N3-glucuronide (XVII), a product of the N2-hydroxylation reaction, still occurred as a major metabolite in Cyp1a2-null mice (although in less amount than wild-type and humanized mice), indicating that other P450 enzymes might also be involved in the metabolism of PhIP. Overall, the differences of urinary PhIP metabolites among three mouse lines, as reflected in Table 1, were consistent with the conclusion from PCA analysis as indicated in the scores scatter plot and loadings scatter plot (Figure 1A,B).
Table 1.
Urinary Profiles of PhIP Metabolites in Wild-Type, Cyp1a2-Null, and CYP1A2-Humanized (hCYP1A2) Micea
| area % |
|||||||
|---|---|---|---|---|---|---|---|
| ID | metabolites | formula | [M + H]+ | RT (min) | wild type | Cyp1a2-null | hCYP1A2 |
| I | PhIP | C13H12N4 | 225.1140 | 3.95 | 14.76 ± 2.98 | 38.77 ± 4.59 | 26.31 ± 1.65 |
| II | N2-methyl-PhIP | C14H14N4 | 239.1283 | 4.51 | 1.65 ± 0.23 | 6.85 ± 1.94 | 3.03 ± 1.62 |
| III | 4′-OH-PhIP | C13H12N4O | 241.1089 | 2.81 | 16.51 ± 1.45 | 2.47 ± 0.06 | 5.75 ± 2.15 |
| IV | N2-OH-PhIP | C13H12N4O | 241.1089 | 3.83 | 5.47 ± 0.65 | 0.98 ± 0.16 | 3.50 ± 0.83 |
| V | 5-OH-PhIP | C13H12N4O | 241.1089 | 4.07 | 3.05 ± 0.53 | 1.21 ± 0.13 | 3.00 ± 0.46 |
| VI | N2-methyl-4′-OH-PhIP | C14HM14N4O | 255.1246 | 3.20 | ND | 11.80 ± 4.77 | 0.91 ± 0.66 |
| VII | 4′-OH-PhIP sulfate | C13H12N4O4S | 321.0658 | 2.59 | 5.41 ± 0.70 | 2.80 ± 0.40 | 2.16 ± 0.38 |
| VIII | 5-OH-PhIP sulfate | C13H12N4O4S | 321.0658 | 2.87 | 0.55 ± 0.21 | ND | ND |
| IX | N2,4′-diOH-PhIP sulfate | C13H12N4O5S | 337.0607 | 2.47 | 0.64 ± 0.06 | ND | ND |
| X | 5,4′-diOH-PhIP sulfate | C13H12N4O5S | 337.0607 | 2.67 | 5.17 ± 1.20 | ND | ND |
| XI | PhIP-N3-glucuronide | C19H20N4O6 | 401.1461 | 3.21 | 2.18 ± 0.80 | 2.33 ± 0.63 | 1.45 ± 0.57 |
| XII | PhIP-N2-glucuronide | C19H20N4O6 | 401.1461 | 3.72 | 4.24 ± 1.06 | 20.94 ± 1.58 | 3.05 ± 0.58 |
| XIII | 4′-OH-PhIP glucuronide | C19H20N4O7 | 417.1410 | 2.19 | 6.06 ± 0.59 | 1.10 ± 0.31 | 1.02 ± 0.82 |
| XIV | 5-OH-PhIP glucuronide | C19H20N4O7 | 417.1410 | 2.89 | 0.86 ± 0.11 | 0.36 ± 0.16 | ND |
| XV | 4′-OH-PhIP-N2-glucuronide | C19H20N4O7 | 417.1410 | 3.10 | 9.66 ± 0.18 | 0.45 ± 0.19 | ND |
| XVI | N2-OH-PhIP-N2-glucuronide | C19H20N4O7 | 417.1410 | 3.40 | 4.22 ± 0.82 | 1.56 ± 0.65 | 6.39 ± 1.07 |
| XVII | N2-OH-PhIP-N3-glucuronide | C19H20N4O7 | 417.1410 | 4.47 | 17.60 ± 5.39 | 8.37 ± 1.95 | 42.45 ± 3.17 |
| XVIII | N2,4′-diOH-PhIP glucuronide | C19H20N4O8 | 433.1359 | 2.25 | 1.97 ± 0.53 | ND | 0.97 ± 0.29 |
Twenty-four hour urine samples (n = 4 for each mouse line) after oral dosing of 10 mg/kg PhIP were collected and analyzed as described in the Experimental Procedures. In accordance with the results from metabolomic analysis, screening and identification of urinary metabolites were performed by using MetaboLynx software based on accurate mass measurement. After structural elucidation of PhIP metabolites by MS2 fragmentation (Figure 2 and Supporting Information, Figure 1), the signal intensity of each metabolite was represented as a relative peak area (area % ±SD) by calculating its percentage in the total peak area of PhIP and its urinary metabolites.
To examine the metabolism of PhIP at a dose more close to real-life human exposure, the quantities of urinary PhIP metabolites after oral administration of 100 μg/kg radiolabeled PhIP were measured. As shown in Figure 5, the metabolite profiles of radiolabeled PhIP in three mouse lines with high 4′-hydroxylation product (VII,4′-OH-PhIP sulfate) in wild-type mice, high parent PhIP compound (I) in Cyp1a2-null mice, and high N2-hydroxylation products (XVI, N2-OH-PhIP-N2-glucuronide; and XVII, N2-OH-PhIP-N3-glucuronide) in humanized mice were consistent with the results from metabolomic analysis. It should be noted that the discrepancy between the radioactivity assay and the LC-MS assay on the relative abundance of PhIP metabolites was largely due to dose-dependent metabolism (10 mg/kg for LC-MS and 100 μg/kg for radio-HPLC) and the nonquantitative nature of the LC-MS method when authentic standards are absent.
Figure 5.
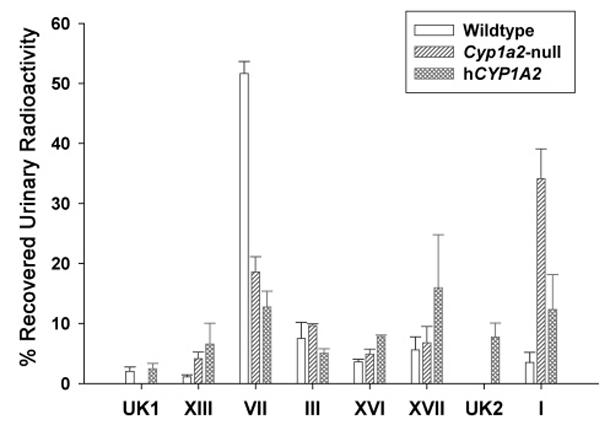
Relative abundances of radiolabeled PhIP metabolites in mouse urine. Total recovered radioactivity from the 24 h urine samples of wild-type, Cyp1a2-null, and CYP1A2- humanized mice treated with [14C]PhIP were set arbitrarily as 100%. Relative abundance of each identified and unknown (UK) PhIP metabolite was calculated as the percentage of recovered urinary radioactivity (n = 4).
Tissue DNA Adduction in Wild-Type, Cyp1a2-Null, and CYP1A2-Humanized Mice after PhIP Treatment
Because PhIP-induced DNA adduction was suggested as the initiation event of carcinogenesis, the levels of PhIP-DNA adducts in the liver, lung, colon, and mammary gland were examined after administration of radiolabeled PhIP (Figure 6). Results showed that humanized mice had a significantly higher level of PhIP-DNA adducts in examined tissues than wild-type and Cyp1a2- null mice (P < 0.01), which was consistent with the higher yield of bioactive N2-hydroxy metabolites in humanized mice. However, with the exception of colon, the levels of PhIP-DNA in liver, lung, and mammary gland of wild-type mice were comparable with that of Cyp1a2-null mice. This observation further suggested that PhIP was still actively metabolized into genotoxic species through non-CYP1A2 bioactivation pathways in Cyp1a2-null mice.
Figure 6.
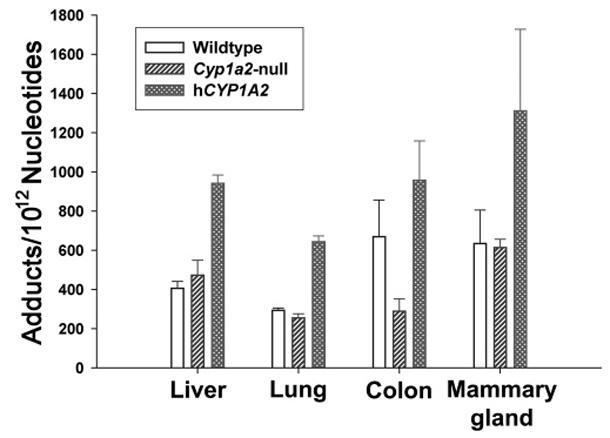
DNA adduction level after PhIP treatment. DNA isolation and DNA adduct analysis following [14C]PhIP dosing were described in the Experimental Procedures. DNA adduction levels in the liver, lung, colon, and mammary gland of wild-type, Cyp1a2-null, and CYP1A2-humanized mice were presented as the number of PhIP-DNA adducts per 1012 nucleotides (n = 4).
Comparison of in Vitro Metabolism of PhIP by MLM from Wild-Type, Cyp1a2-Null Mice, and CYP1A2-Humanized Mice and by HLM
To verify that the distinguished metabolite profiles of PhIP in the three mouse lines originated from metabolism in liver microsomes, PhIP was incubated with the MLMs from wild-type, Cyp1a2-null, and CYP1A2-humanized mice and pooled HLM, respectively. Consistent with the in vivo results, the 4′-hydroxylation activity of MLMs from Cyp1a2-null and humanized mice was significantly reduced as compared to MLM from wild-type mice (P < 0.01), and MLM from humanized mice possessed a much higher N2-hydroxylation activity than did wild-type (P < 0.01) (Figure 7). While overall enzymatic activity of HLM was significantly lower than MLM from humanized mice (P < 0.01), the ratio of 4′-OHPhIP vs N2-OH-PhIP was comparable between these two microsomal preparations (Figure 7), indicating that CYP1A2- humanized MLM can mimic HLM in the metabolism of PhIP. Furthermore, MLM from Cyp1a2-null mice still retained about 20% 4′-hydroxylation and 30% N2-hydroxylation activities of wild-type mice.
Figure 7.
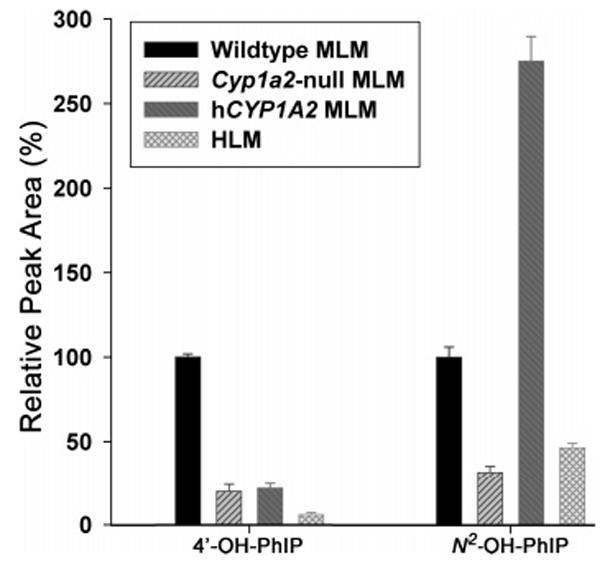
In vitro oxidation of PhIP by MLM from wild-type, Cyp1a2- null, and CYP1A2- humanized mice and by pooled HLM. Relative 4′-hydroxylase and N2-hydroxylase activities of MLMs and HLM were calculated by arbitrarily setting the yield of wild-type MLM as 100% (n = 3).
Potential Role of CYP2C Enzymes in the PhIP Metabolism
Although both metabolite profiling and DNA adduct assays confirmed the importance of CYP1A2 in PhIP metabolism, significant N2-hydroxylation of PhIP and extensive formation of DNA adduct were still observed in Cyp1a2-null mice, which implied the potential involvement of other P450s in the bioactivation of PhIP (Table 1 and Figure 6). Therefore, PhIP was incubated with a panel of recombinant human P450s,specifically CYP1A1, CYP1A2, CYP1B1, CYP2A6, CYP2B6, CYP2C8, CYP2C9, CYP2C18, CYP2C19, CYP2D6, CYP2E1, and CYP3A4. Results from the P450 panel incubation showed that, besides CYP1A2, the isozymes CYP1A1, CYP1B1, CYP2C19, and CYP2D6 can also function as PhIP-4′-hydroxylases and CYP1A1, CYP1B1, and CYP2C19 can function as PhIP-N2-hydroxylases (Figure 8A,B). Because of the insignificant hepatic levels of CYP1A1 and CYP1B1 enzymes (26) and the inability of CYP2D6 to form bioactive N2-OH-PhIP, subsequent studies were focused on the potential role of CYP2C enzymes in the PhIP metabolism. First, enzyme kinetics of human CYP1A2 and CYP2C19 enzymes were compared. As indicated in Figure 8C,D, the enzymatic efficiency (Vmax/Km) of CYP1A2 was about 3- and 13-fold that of CYP2C19 in the formation of 4-OH-PhIP and N2-OH-PhIP, respectively. Therefore, it is probable that in comparison to human CYP1A2, CYP2C19 may only function as a minor enzyme in the metabolism of PhIP in human liver. Second, 4′-hydroxylase and N2-hydroxylase activities of recombinant rat CYP1A2 and CYP2C11 enzymes were compared. As shown in Figure 9A, rat CYP2C11 differed from human CYP2C19 due to its inability to convert PhIP to 4′-OH-PhIP but nevertheless retained catalytic activity for generating N2-OH-PhIP, which was largely consistent with a previous report (27). Although this result may not represent the PhIP metabolism activity of other rodent CYP2C enzymes, the observed N2-hydroxylase activity of rat CYP2C11 implied that certain mouse CYP2C enzymes may also possess this activity. To examine this hypothesis, antibody inhibition assays were conducted to determine the relative contribution of mouse CYP1A2 and CYP2C enzymes to the formation of 4′-OH-PhIP and N2-OH-PhIP. For the MLM from wild-type mice, as shown in Figure 9B, anti-mCYP1A2 mAb (1-7-1) blocked about 60% of both 4′-hydroxylase and N2-hydroxylase activities whereas the anti-rCYP2C11 mAb (1-68-11) could only reduce N2-hydroxylase activity when used together with CYP1A2 antibody (P < 0.01, as compared to mCYP1A2 antibody alone). However, when applied to the MLM from Cyp1a2-null mice, anti-rCYP2C11 mAb dramatically inhibited both 4′-hydroxylase and N2-hydroxylase activities (Figure 9C), which indicated that mouse CYP2C enzymes may be the major PhIP metabolizing enzymes in the MLM of Cyp1a2-null mice.
Figure 8.
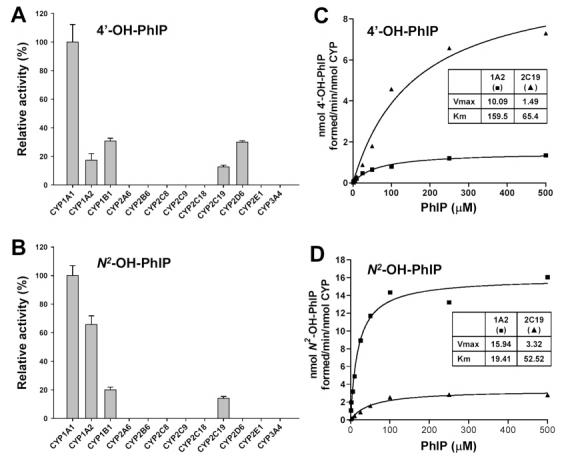
Relative 4′-hydroxylase and N2-hydroxylase activities of recombinant human P450s and enzyme kinetics of CYP1A2 and CYP2C19. (A) Relative activity of P450s for the generation of 4′-OH-PhIP. (B) Relative activity of P450s for the generation of N2-OH-PhIP. The enzymatic activity of the P450 isozyme with the highest yield of targeted metabolite was set arbitrarily as 100%. The relative activity was presented as the mean ± SD (n = 3). (C) Enzyme kinetics of recombinant human CYP1A2 (■) and CYP2C19 (▲) on the formation of 4′-OH-PhIP. (D) Enzyme kinetics of recombinant human CYP1A2 (■) and CYP2C19 (▲) on the formation of N2-OH-PhIP.
Figure 9.
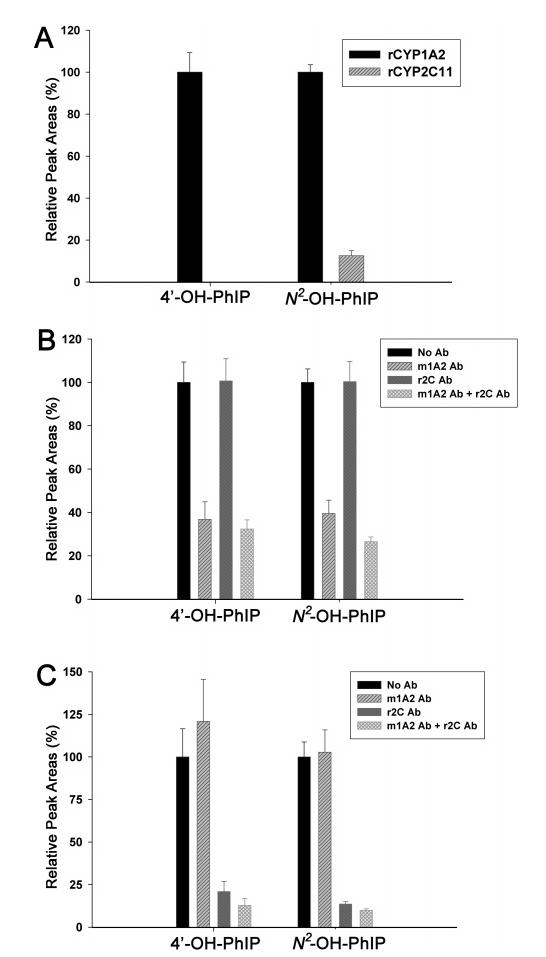
Inhibition of in vitro microsomal oxidation of PhIP by CYP1A2 and CYP2C antibodies. (A) Relative activity of rat CYP1A2 and rat CYP2C11 for the generation of 4′-OH-PhIP and N2-OH-PhIP. (B) Influence of anti-mCYP1A2 and anti-rCYP2C11 mAbs on the formation of 4′-OH-PhIP and N2-OH-PhIP by wild-type MLM. (C) Influence of anti-mCYP1A2 and anti-rCYP2C11 mAbs on the formation of 4′-OH-PhIP and N2-OH-PhIP by Cyp1a2-null MLM. The peak area of target metabolites from an antibody-free incubation was set arbitrarily as 100% (n = 3).
Discussion
As a potent rodent carcinogen and one of the major food derived heterocyclic aromatic amines in the human diet, in vivo and in vitro biotransformation of PhIP have been extensively investigated. At least nine metabolites (III, IV, V, VII, XI, XII, XIII, XVI, and XVII) were identified from these studies (9). In this report, through the combination of high-resolution LC-MS technology and comprehensive MDA on a relatively small sample size (four mice per genotype), eight novel metabolites (II, VI, VIII, IX, X, XIV, XV, and XVIII), some of which were present in urine in significant quantities, were identified and further structurally elucidated by MS2 fragmentation analysis. This result, in accordance with recent studies on the metabolism of arecoline (a bioactive alkaloid from areca nut) (28) and aminoflavone (a novel anticancer agent) (29), underscores the value of LC-MS-based metabolomic approach as a powerful tool for drug metabolism and chemical toxicology research (18). As compared to traditional radioactivity tracing methods, MDA-based metabolite profilings have a clear advantage for not being dependent on the preparation of radiolabeled parent compounds, which can be costly and time-consuming. By measuring exact masses of metabolites, a high-resolution LC-MS technical platform provides an excellent starting point for structural elucidation of novel metabolites. Furthermore, because the existence of parent compound and its metabolites in control and treated samples is a “none-andall” situation, by applying appropriate data-scaling techniques, the variables representing major metabolites in the multivariate model can be easily identified by an unsupervised PCA or a supervised partial least-squares-discriminant analysis (PLS-DA) based on their heavy contribution to the principal components and to the separation of control and treated samples, as evidenced by this PhIP study (Figure 1). For the same reason, this strategy does not discriminate metabolites from uncommon metabolism reactions against metabolites from common reactions as the mass defect filtering (MDF) methods did through examining the differences between the measured masses and the expected masses of metabolites generated by common metabolic reactions (30, 31). Therefore, when combined with accurate mass measurement and software-assisted metabolite screening, metabolomic analysis can potentially lead to the exhaustive detection of major and minor metabolites, whether they originated from common or uncommon metabolic reactions. By using this strategy, a novel N-methylation reaction of PhIP was identified in this study. Another interesting observation from this study was the relative low variance of the data on the relative composition of urinary PhIP metabolites (Table 1) in contrast to the high variance of the absolute quantitation of individual metabolites in urine (data not shown). This significant decrease of data variance was mainly attributed to the reduction of exogenous influence from urine volume, diet and fecal contaminations, and other factors by calculating the relative percentage of each metabolite in the whole metabolite cluster. Furthermore, the results from this study provided convincing evidence to support the application of metabolomic analysis as an efficient tool to examine the influence of genetic modification and drug-drug interaction on drug metabolism.
Although urinary levels of N2-OH-PhIP in wild-type, Cyp1a2- null, and CYP1A2- humanized mice were previously compared (19), comprehensive profiles of PhIP metabolism in these three mouse lines have not been reported. Results from metabolomic analysis and radiolabeled metabolite analysis in this study provided a detailed view on the distribution of each PhIP metabolite and its potential biotransformation pathway and further confirmed the importance of CYP1A2 in PhIP metabolism and the interspecies difference between human and rodent, which were consistent with conclusions from previous in vitro studies (9, 14). Interestingly, the clear dominance of CYP1A2 in PhIP metabolism did not correlate well with the results of DNA adduct assays that showed that wild-type and Cyp1a2- null mice had comparable levels of PhIP-DNA adducts in liver, lung, and mammary gland, although this latter observation was consistent with the result from a recent study showing comparable tumorigenesis in wild-type and Cyp1a2-null mice after PhIP treatment (15). To obtain more insight into this issue, several in vitro incubation experiments were conducted to examine the possible involvement of other P450s. Subsequently, human CYP2C19 was identified as another PhIP metabolizing enzyme, even though its enzymatic efficiency (Vmax/Km) was much lower than CYP1A2. The potential role of CYP2C enzymes in murine PhIP metabolism, especially in Cyp1a2-null mice, was further examined by antibody inhibition, in which anti-rCYP2C11 mAb abolished about 80% N2-hydroxylase activity of MLM from Cyp1a2-null mice. It should be noted that, as compared to the well-characterized human CYP2C subfamily, which is mainly comprised of CYP2C8, 2C9, 2C18, and 2C19, the mouse CYP2C subfamily contains at least 15 genes and four pseudo-genes (32), and catalytic functions of many mouse CYP2C enzymes are still largely unknown. In addition, the expression levels of mouse CYP2Cs is quite high in many extrahepatic tissues (33, 34), which implies that mouse CYP2C enzymes may have a more important role in xenobiotic metabolism than their human counterparts. Therefore, the role of CYP2C enzymes in PhIP metabolism can be tentatively defined as follows: First, in human, in comparison to CYP1A2, the contribution of CYP2C19 to PhIP metabolism is probably minimal for its low catalytic activity and low expression level in extrahepatic tissues. Second, in mouse, the contribution of CYP2C enzymes to hepatic PhIP metabolism may still be minor, based on the result of antibody inhibition of MLM from wild-type mice. However, their role in the extrahepatic metabolism of PhIP could be significant due to their abundance in those tissues. Further studies are required to validate this hypothesis.
Third, in Cyp1a2-null mice, CYP2C enzymes are the major enzymes responsible for the PhIP-metabolizing activity in liver. Because of the structural similarity among HCA compounds, to which PhIP belongs, all of the potential roles of CYP2C enzymes in the PhIP metabolism may also be well applicable to other HCAs, such as IQ and MeIQx. This hypothesis is supported by a recent study on the metabolism of aminoflavone (structurally related to HCAs), in which the potential role of CYP2C enzymes was also identified(29). With regard to the comparable levels of PhIP-DNA adducts and tumor incidence (15) in wild-type and Cyp1a2-null mice, similar studies on 4-aminobiphenyl, another HCA carcinogen, also showed that DNA adduction and chemical carcinogenesis were not reduced in Cyp1a2-null mice (35, 36). A possible explanation is that without the CYP1A2-mediated hepatic metabolism, more unchanged parent compound, as evidenced by the high amount of PhIP in Cyp1a2-null urine, can enter the circulation and move to nonliver tissues for further local metabolism, potentially by CYP2C enzymes or CYP1A1 as indicated by a recent study on the PhIP metabolism in lung (37). Therefore, significant or even higher extrahepatic metabolism of PhIP is expected in Cyp1a2- null mice than in wild-type mice. Future studies will provide more insight into this issue.
The use of genetically modified P450 animal models, including gene knockout and transgenic mice, provides a powerful tool for studying xenobiotics metabolism. Because of the important role of CYP1A2 enzyme in drug metabolism and chemical carcinogenesis, both Cyp1a2-null and CYP1A2- humanized mouse models have beneficial values for studying the metabolism of CYP1A2 substrates as well as interspecies differences between human and mouse (19, 38). Similarly, animal models on CYP1A1 (39), CYP1B1 (40), CYP2E1 (41), and CYP3A4 (42) have been proven to be useful tools for determining the role of P450s in the metabolism of xenobiotics and endogenous chemicals and the modulation of normal homeostasis and for understanding the mechanism of chemical carcinogenesis (43).
In summary, by combining high-resolution LC-MS technology and MDA used in metabolomics, 17 urinary PhIP metabolites including eight novel metabolites, from P450-dependent or independent oxidation as well as glucuronidation, sulfation, and methylation reactions, were identified and structurally elucidated, and a comprehensive in vivo metabolic pathway of PhIP was constructed (Figure 3). Significant differences in the relative composition of urinary metabolites among three mouse lines demonstrated that CYP1A2, especially human CYP1A2, plays an important role in the PhIP metabolism and bioactivation although it may not be the only enzyme capable of oxidizing PhIP. In vitro incubations of PhIP with microsomes and recombinant P450s, as well as enzyme kinetics and antibody inhibition assays, confirmed this conclusion and further indicated that CYP2C enzymes might also contribute to PhIP metabolism.
Supplementary Material
Figure 4.

Representative chromatograms of major PhIP metabolites in urine samples of wild-type, Cyp1a2-null, and CYP1A2- humanized mice. Ions within the 20 ppm range of theoretical accurate mass ([M + H]+) of PhIP and its metabolites (225.1140, 239.1283, 241.1089, 255.1246, 257.1039, 321.0658, 337.0607, 401.1461, 417.1410, and 433.1359) were extracted from each 10 min LC-MS run. The ion intensity of the most abundant metabolites was set arbitrarily as 100%. The identities and relative abundances of labeled metabolites were presented in Table 1.
Acknowledgments
We thank NCI Chemical Carcinogen Reference Standard Repository for providing N2-OH-PhIP standard and Dr. Minako Nagao of the Japan National Cancer Center Research Institute for 4′-OH-PhIP standard. This study was supported by the NCI Intramural Research Program of the NIH. This work was also partially performed under the auspices of the U.S. Department of Energy by the University of California, Lawrence Livermore National Laboratory, at the Research Resource for Biomedical AMS under Contract W-7405-Eng-48 and supported by National Cancer Institute Grants CA55861 and RR13461. J.R.I. is grateful to the U.S. Smokeless Tobacco Company for a grant for collaborative research.
Footnotes
Supporting Information Available: LC-MS/MS structural elucidation of urinary PhIP metabolites. This material is available free of charge via the Internet at http://pubs.acs.org.
- PhIP
- 2-amino-1-methyl-6-phenylimidazo[4,5-b]pyri-dine
- P450
- cytochrome P450
- PCA
- principal components analysis
- PLSDA
- partial least-squares–discriminant analysis
- MDA
- multivariate data analysis
- MLM
- mouse liver microsomes
- HLM
- human liver microsomes
- MS2
- tandem mass spectrometry
- LC-MS/MS
- liquid chromatography-tandem mass spectrometry
- UPLC
- ultraperformance liquid chromatography
- TOF-MS
- time-of-flight mass spectrometry
- OH-PHIP
- hydroxy-PhIP
- mAb
- monoclonal antibody
References
- (1).Felton JS, Jagerstad M, Knize MG, Skog K, Wakabayashi K. Contents in foods, beverages and tobacco. In: Nagao M, Sugimura T, editors. Food Borne Carcinogens. John Wiley & Sons; New York: 2000. pp. 31–72. [Google Scholar]
- (2).Ushiyama H, Wakabayashi K, Hirose M, Itoh H, Sugimura T, Nagao M. Presence of carcinogenic heterocyclic amines in urine of healthy volunteers eating normal diet, but not of inpatients receiving parenteral alimentation. Carcinogenesis. 1991;12:1417–1422. doi: 10.1093/carcin/12.8.1417. [DOI] [PubMed] [Google Scholar]
- (3).Peluso M, Castegnaro M, Malaveille C, Friesen M, Garren L, Hautefeuille A, Vineis P, Kadlubar F, Bartsch H. 32P Postlabelling analysis of urinary mutagens from smokers of black tobacco implicates 2-amino-1-methyl-6-phenylimidazo[4,5-b]pyridine (PhIP) as a major DNA-damaging agent. Carcinogenesis. 1991;12:713–717. doi: 10.1093/carcin/12.4.713. [DOI] [PubMed] [Google Scholar]
- (4).Esumi H, Ohgaki H, Kohzen E, Takayama S, Sugimura T. Induction of lymphoma in CDF1 mice by the food mutagen, 2-amino-1-methyl-6-phenylimidazo[4,5-b]pyridine. Jpn. J. Cancer Res. 1989;80:1176–1178. doi: 10.1111/j.1349-7006.1989.tb01651.x. [DOI] [PMC free article] [PubMed] [Google Scholar]
- (5).Ito N, Hasegawa R, Imaida K, Tamano S, Hagiwara A, Hirose M, Shirai T. Carcinogenicity of 2-amino-1-methyl-6-phenylimidazo[4,5-b]pyridine (PhIP) in the rat. Mutat. Res. 1997;376:107–114. doi: 10.1016/s0027-5107(97)00032-8. [DOI] [PubMed] [Google Scholar]
- (6).Frandsen H, Alexander J. N-acetyltransferase-dependent activation of 2-hydroxyamino-1-methyl-6-phenylimidazo[4,5-b]pyri-dine: Formation of 2-amino-1-methyl-6-(5-hydroxy)phenylimidazo [4,5-b]pyridine, a possible biomarker for the reactive dose of 2-amino-1-methyl-6-phenylimidazo[4,5-b]pyridine. Carcinogenesis. 2000;21:1197–1203. [PubMed] [Google Scholar]
- (7).Turesky RJ. Heterocyclic aromatic amine metabolism, DNA adduct formation, mutagenesis, and carcinogenesis. Drug Metab. Rev. 2002;34:625–650. doi: 10.1081/dmr-120005665. [DOI] [PubMed] [Google Scholar]
- (8).Snyderwine EG, Turesky RJ, Turteltaub KW, Davis CD, Sadrieh N, Schut HA, Nagao M, Sugimura T, Thorgeirsson UP, Adamson RH, Thorgeirsson SS. Metabolism of food-derived heterocyclic amines in nonhuman primates. Mutat. Res. 1997;376:203–210. doi: 10.1016/s0027-5107(97)00044-4. [DOI] [PubMed] [Google Scholar]
- (9).Langouet S, Paehler A, Welti DH, Kerriguy N, Guillouzo A, Turesky RJ. Differential metabolism of 2-amino-1-methyl-6-phenylimidazo[4,5-b]pyridine in rat and human hepatocytes. Carcinogenesis. 2002;23:115–122. doi: 10.1093/carcin/23.1.115. [DOI] [PubMed] [Google Scholar]
- (10).Reistad R, Frandsen H, Grivas S, Alexander J. In vitro formation and degradation of 2-amino-1-methyl-6-phenylimidazo[4,5-b]pyridine (PhIP) protein adducts. Carcinogenesis. 1994;15:2547–2552. doi: 10.1093/carcin/15.11.2547. [DOI] [PubMed] [Google Scholar]
- (11).Frandsen H, Frederiksen H, Alexander J. 2-Amino-1-methyl-6-(5-hydroxy-)phenylimidazo[4,5-b]pyridine (5-OH-PhIP), a biomarker for the genotoxic dose of the heterocyclic amine, 2-amino-1-methyl-6-phenylimidazo[4,5-b]pyridine (PhIP) Food Chem. Toxicol. 2002;40:1125–1130. doi: 10.1016/s0278-6915(02)00033-9. [DOI] [PubMed] [Google Scholar]
- (12).Malfatti MA, Ubick EA, Felton JS. The impact of glucuronidation on the bioactivation and DNA adduction of the cooked-food carcinogen 2-amino-1-methyl-6-phenylimidazo[4,5-b]-pyridine in vivo. Carcinogenesis. 2005;26:2019–2028. doi: 10.1093/carcin/bgi151. [DOI] [PubMed] [Google Scholar]
- (13).Kaderlik KR, Mulder GJ, Turesky RJ, Lang NP, Teitel CH, Chiarelli MP, Kadlubar FF. Glucuronidation of N-hydroxy heterocyclic amines by human and rat liver microsomes. Carcinogenesis. 1994;15:1695–1701. doi: 10.1093/carcin/15.8.1695. [DOI] [PubMed] [Google Scholar]
- (14).Turesky RJ, Constable A, Fay LB, Guengerich FP. Interspecies differences in metabolism of heterocyclic aromatic amines by rat and human P450 1A2. Cancer Lett. 1999;143:109–112. doi: 10.1016/s0304-3835(99)00137-8. [DOI] [PubMed] [Google Scholar]
- (15).Kimura S, Kawabe M, Yu A, Morishima H, Fernandez-Salguero P, Hammons GJ, Ward JM, Kadlubar FF, Gonzalez FJ. Carcinogenesis of the food mutagen PhIP in mice is independent of CYP1A2. Carcinogenesis. 2003;24:583–587. doi: 10.1093/carcin/24.3.583. [DOI] [PubMed] [Google Scholar]
- (16).Griffin JL. The Cinderella story of metabolic profiling: Does metabolomics get to go to the functional genomics ball? Philos. Trans. R. Soc. London, Ser. B. 2006;361:147–161. doi: 10.1098/rstb.2005.1734. [DOI] [PMC free article] [PubMed] [Google Scholar]
- (17).Nicholson JK, Lindon JC, Holmes E. ‘Metabonomics’: Understanding the metabolic responses of living systems to pathophysiological stimuli via multivariate statistical analysis of biological NMR spectroscopic data. Xenobiotica. 1999;29:1181–1189. doi: 10.1080/004982599238047. [DOI] [PubMed] [Google Scholar]
- (18).Plumb RS, Stumpf CL, Granger JH, Castro-Perez J, Haselden JN, Dear GJ. Use of liquid chromatography/time-of-flight mass spectrometry and multivariate statistical analysis shows promise for the detection of drug metabolites in biological fluids. Rapid Commun. Mass Spectrom. 2003;17:2632–2638. doi: 10.1002/rcm.1250. [DOI] [PubMed] [Google Scholar]
- (19).Cheung C, Ma X, Krausz KW, Kimura S, Feigenbaum L, Dalton TP, Nebert DW, Idle JR, Gonzalez FJ. Differential metabolism of 2-amino-1-methyl-6-phenylimidazo[4,5-b]pyridine (PhIP) in mice humanized for CYP1A1 and CYP1A2. Chem. Res. Toxicol. 2005;18:1471–1478. doi: 10.1021/tx050136g. [DOI] [PubMed] [Google Scholar]
- (20).Pineau T, Fernandez-Salguero P, Lee SS, McPhail T, Ward JM, Gonzalez FJ. Neonatal lethality associated with respiratory distress in mice lacking cytochrome P450 1A2. Proc. Natl. Acad. Sci. U.S.A. 1995;92:5134–5138. doi: 10.1073/pnas.92.11.5134. [DOI] [PMC free article] [PubMed] [Google Scholar]
- (21).Yu AM, Idle JR, Krausz KW, Kupfer A, Gonzalez FJ. Contribution of individual cytochrome P450 isozymes to the O-demethylation of the psychotropic beta-carboline alkaloids harmaline and harmine. J. Pharmacol. Exp. Ther. 2003;305:315–322. doi: 10.1124/jpet.102.047050. [DOI] [PubMed] [Google Scholar]
- (22).Park SS, Fujino T, West D, Guengerich FP, Gelboin HV. Monoclonal antibodies that inhibit enzyme activity of 3-methylcholanthrene-induced cytochrome P-450. Cancer Res. 1982;42:1798–1808. [PubMed] [Google Scholar]
- (23).Park SS, Waxman DJ, Lapenson DP, Schenkman JB, Gelboin HV. Monoclonal antibodies to rat liver cytochrome P-450 2c/RLM5 that regiospecifically inhibit steroid metabolism. Biochem. Pharmacol. 1989;38:3067–3074. doi: 10.1016/0006-2952(89)90017-8. [DOI] [PubMed] [Google Scholar]
- (24).Malfatti MA, Felton JS. N-glucuronidation of 2-amino-1-methyl-6-phenylimidazo[4,5-b]pyridine (PhIP) and N_hydroxy-PhIP by specific human UDP-glucuronosyltransferases. Carcinogenesis. 2001;22:1087–1093. doi: 10.1093/carcin/22.7.1087. [DOI] [PubMed] [Google Scholar]
- (25).Styczynski PB, Blackmon RC, Groopman JD, Kensler TW. The direct glucuronidation of 2-amino-1-methyl-6-phenylimidazo[4,5-b] pyridine (PhIP) by human and rabbit liver microsomes. Chem. Res. Toxicol. 1993;6:846–851. doi: 10.1021/tx00036a014. [DOI] [PubMed] [Google Scholar]
- (26).Guengerich FP. Human cytochrome P450 enzymes. In: Montellano P. R. O. d., editor. Cytochrome P450-Structure, Mechanism, and Biochemistry. Kluwer Academic/Plenum Publishers; New York: 2005. pp. 377–463. [Google Scholar]
- (27).Wallin H, Mikalsen A, Guengerich FP, Ingelman-Sundberg M, Solberg KE, Rossland OJ, Alexander J. Differential rates of metabolic activation and detoxication of the food mutagen 2-amino-1-methyl-6-phenylimidazo[4,5-b]pyridine by different cyto-chrome P450 enzymes. Carcinogenesis. 1990;11:489–492. doi: 10.1093/carcin/11.3.489. [DOI] [PubMed] [Google Scholar]
- (28).Giri S, Idle JR, Chen C, Zabriskie TM, Krausz KW, Gonzalez FJ. A metabolomic approach to the metabolism of the areca nut alkaloids arecoline and arecaidine in the mouse. Chem. Res. Toxicol. 2006;19:818–827. doi: 10.1021/tx0600402. [DOI] [PMC free article] [PubMed] [Google Scholar]
- (29).Chen C, Meng L, Ma X, Krausz KW, Pommier Y, Idle JR, Gonzalez FJ. Urinary metabolite profiling reveals CYP1A2-mediated metabolism of NSC686288 (aminoflavone) J. Pharmacol. Exp. Ther. 2006;318:1330–1342. doi: 10.1124/jpet.106.105213. [DOI] [PMC free article] [PubMed] [Google Scholar]
- (30).Mortishire-Smith RJ, O’Connor D, Castro-Perez JM, Kirby J. Accelerated throughput metabolic route screening in early drug discovery using high-resolution liquid chromatography/quadrupole time-of-flight mass spectrometry and automated data analysis. Rapid Commun. Mass Spectrom. 2005;19:2659–2670. doi: 10.1002/rcm.2111. [DOI] [PubMed] [Google Scholar]
- (31).Zhu M, Ma L, Zhang D, Ray K, Zhao W, Humphreys WG, Skiles G, Sanders M, Zhang H. Detection and characterization of metabolites in biological matrices using mass defect filtering of liquid chromatography/high resolution mass spectrometry data. Drug Metab. Dispos. 2006;34:1722–1733. doi: 10.1124/dmd.106.009241. [DOI] [PubMed] [Google Scholar]
- (32).Nelson DR, Zeldin DC, Hoffman SM, Maltais LJ, Wain HM, Nebert DW. Comparison of cytochrome P450 (CYP) genes from the mouse and human genomes, including nomenclature recommendations for genes, pseudogenes and alternative-splice variants. Pharmacogenetics. 2004;14:1–18. doi: 10.1097/00008571-200401000-00001. [DOI] [PubMed] [Google Scholar]
- (33).Tsao CC, Coulter SJ, Chien A, Luo G, Clayton NP, Maronpot R, Goldstein JA, Zeldin DC. Identification and localization of five CYP2Cs in murine extrahepatic tissues and their metabolism of arachidonic acid to regio- and stereoselective products. J. Pharmacol. Exp. Ther. 2001;299:39–47. [PubMed] [Google Scholar]
- (34).Wang H, Zhao Y, Bradbury JA, Graves JP, Foley J, Blaisdell JA, Goldstein JA, Zeldin DC. Cloning, expression, and characterization of three new mouse cytochrome p450 enzymes and partial characterization of their fatty acid oxidation activities. Mol. Pharmacol. 2004;65:1148–1158. doi: 10.1124/mol.65.5.1148. [DOI] [PubMed] [Google Scholar]
- (35).Tsuneoka Y, Dalton TP, Miller ML, Clay CD, Shertzer HG, Talaska G, Medvedovic M, Nebert DW. 4-aminobiphenyl-induced liver and urinary bladder DNA adduct formation in Cyp1a2(-/-) and Cyp1a2(+/+) mice. J. Natl. Cancer Inst. 2003;95:1227–1237. doi: 10.1093/jnci/djg025. [DOI] [PubMed] [Google Scholar]
- (36).Kimura S, Kawabe M, Ward JM, Morishima H, Kadlubar FF, Hammons GJ, Fernandez-Salguero P, Gonzalez FJ. CYP1A2 is not the primary enzyme responsible for 4-aminobiphenyl-induced hepatocarcinogenesis in mice. Carcinogenesis. 1999;20:1825–1830. doi: 10.1093/carcin/20.9.1825. [DOI] [PubMed] [Google Scholar]
- (37).Ma X, Idle JR, Malfatti MA, Krausz KW, Nebert DW, Chen CS, Felton JS, Waxman DJ, Gonzalez FJ. Mouse lung CYP1A1 catalyzes the metabolic activation of 2-amino-1-methyl-6-phenylimidazo[4,5-b]pyridine (PhIP) Carcinogenesis. doi: 10.1093/carcin/bgl184. Accepted for publication. [DOI] [PMC free article] [PubMed] [Google Scholar]
- (38).Buters JT, Tang BK, Pineau T, Gelboin HV, Kimura S, Gonzalez FJ. Role of CYP1A2 in caffeine pharmacokinetics and metabolism: Studies using mice deficient in CYP1A2. Pharmacogenetics. 1996;6:291–296. doi: 10.1097/00008571-199608000-00002. [DOI] [PubMed] [Google Scholar]
- (39).Uno S, Dalton TP, Dragin N, Curran CP, Derkenne S, Miller ML, Shertzer HG, Gonzalez FJ, Nebert DW. Oral benzo[a]pyrene in Cyp1 knockout mouse lines: CYP1A1 important in detoxication, CYP1B1 metabolism required for immune damage independent of total-body burden and clearance rate. Mol. Pharmacol. 2006;69:1103–1114. doi: 10.1124/mol.105.021501. [DOI] [PubMed] [Google Scholar]
- (40).Buters JT, Sakai S, Richter T, Pineau T, Alexander DL, Savas U, Doehmer J, Ward JM, Jefcoate CR, Gonzalez FJ. Cytochrome P450 CYP1B1 determines susceptibility to 7,12-dimethylbenz[a]anthracene-induced lymphomas. Proc. Natl. Acad. Sci. U.S.A. 1999;96:1977–1982. doi: 10.1073/pnas.96.5.1977. [DOI] [PMC free article] [PubMed] [Google Scholar]
- (41).Cheung C, Yu AM, Ward JM, Krausz KW, Akiyama TE, Feigenbaum L, Gonzalez FJ. The cyp2e1-humanized transgenic mouse: role of cyp2e1 in acetaminophen hepatotoxicity. Drug Metab. Dispos. 2005;33:449–457. doi: 10.1124/dmd.104.002402. [DOI] [PubMed] [Google Scholar]
- (42).Granvil CP, Yu AM, Elizondo G, Akiyama TE, Cheung C, Feigenbaum L, Krausz KW, Gonzalez FJ. Expression of the human CYP3A4 gene in the small intestine of transgenic mice: In vitro metabolism and pharmacokinetics of midazolam. Drug Metab. Dispos. 2003;31:548–558. doi: 10.1124/dmd.31.5.548. [DOI] [PubMed] [Google Scholar]
- (43).Gonzalez FJ. Role of gene knockout and transgenic mice in the study of xenobiotic metabolism. Drug Metab. Rev. 2003;35:319–335. doi: 10.1081/dmr-120026496. [DOI] [PubMed] [Google Scholar]
Associated Data
This section collects any data citations, data availability statements, or supplementary materials included in this article.