

Abstract
Beta amyloid (Aβ), a peptide generated from the amyloid precursor protein (APP) by neurons, is widely believed to underlie the pathophysiology of Alzheimer’s Disease. Recent studies indicate that this peptide can drive loss of surface AMPA and NMDA type glutamate receptors. We now show that Aβ employs signaling pathways of long-term depression (LTD) to drive endocytosis of synaptic AMPA receptors. Synaptic removal of AMPA receptors is necessary and sufficient to produce loss of dendritic spines and synaptic NMDA responses. Our studies indicate the central role played by AMPA receptor trafficking in Aβ-induced disruption of synaptic structure and function.
Introduction
Alzheimer’s Disease (AD), a progressive neurodegenerative disorder, is characterized by early deficits in learning and memory with eventual loss of higher cognitive functions (Selkoe and Schenk, 2003). Brains from AD patients reveal intracellular neurofibrillary tangles composed of hyperphosphorylated tau protein and Aβ-rich plaques. Evidence from human genetics and transgenic mouse studies has supported a role for Aβ in the etiology and pathogenesis of AD (Kobayashi and Chen, 2005; Selkoe and Schenk, 2003). Memory deficits in AD patients, however, do not correlate well with Aβ plaque burden, but rather loss of synaptic markers is a strong predictor for clinical symptoms and disease progression. Recent studies have suggested that Aβ is a homeostatic regulator of synaptic strength (Chang et al., 2006; Kamenetz et al., 2003). These data have lent support to the notion that perturbations in soluble Aβ levels, and their effects on synapses, might be directly linked to the learning and memory deficits in patients with AD (Carter et al., 2004; Lue et al., 1999; Masliah et al., 2001; Terry et al., 1991).
Excitatory synapses contain AMPA and NMDA ionotropic glutamate receptors as well as metabotropic type glutamate receptors (mGluRs) positioned on dendritic spines (Baude et al., 1993; Takumi et al., 1999). Basal transmission is largely mediated by AMPA receptors. Brief periods of high synaptic activity open NMDA receptors, leading to a long-lasting increase in postsynaptic AMPA receptor number, spine growth and long-term potentiation (LTP) of synaptic transmission (Bliss and Lomo, 1973; Engert and Bonhoeffer, 1999; Hayashi et al., 2000; Isaac, 1995; Kopec et al., 2006; Liao, 1995; Maletic-Savatic et al., 1999). Alternatively, low levels of synaptic stimulation can activate NMDA receptors to produce NMDA-dependent long-term depression (LTD) or mGluRs to produce mGluR-dependent LTD. These two forms of LTD can induce removal of postsynaptic AMPA receptors and loss of spines (Bolshakov and Siegelbaum, 1994; Carroll et al., 1999; Dudek and Bear, 1992; Mulkey and Malenka, 1992; Nagerl et al., 2004; Snyder et al., 2001; Xiao et al., 2001; Zhou et al., 2004). It is generally believed that plasticity, such as LTP and LTD, are important processes for learning and memory. Multiple signaling pathways, which include several protein kinases and phosphatases, are required for the generation of LTP and LTD (Sheng and Kim, 2002). These same pathways have been shown to influence in vivo phenomena, such as learning and memory (Rodrigues et al., 2004).
Studies from AD mouse models have lent further support to the hypothesis that Aβ causes “synaptic failure” before plaques develop and neuron death occurs (Selkoe, 2002; Small et al., 2001). Neurons from transgenic APP mice that express genes encoding mutant APP or presenilin linked to familial, autosomal dominant forms of AD (FAD) exhibit decreased synaptophysin and PSD95 staining as well as dendritic spine loss (Almeida et al., 2005; Hsia, 1999; Kauer, 1988; Lanz et al., 2003; Mucke et al., 2000; Spires et al., 2005). These mice develop mature amyloid plaques, are impaired on learning tasks and can show deficits in LTP (Billings et al., 2005; Chapman et al., 1999; Giacchino et al., 2000; Larson et al., 1999; Moechars et al., 1999; Oddo et al., 2003; Stern et al., 2004). Furthermore, application of Aβ, in vivo and in vitro, adversely affects LTP and synaptic transmission (Cleary et al., 2005; Cullen et al., 1997; Freir et al., 2001; Walsh et al., 2002). Interestingly, learning and synaptic dysfunction appear before the formation of plaques, suggesting that a physiological deficit rather than a loss of neurons underlies the initial development of the disease (Hsia, 1999; Kamenetz et al., 2003; Mucke et al., 2000; Oddo et al., 2003). Studies from our laboratory, and others, have shown that elevated Aβ levels results in depressed glutamatergic synaptic transmission and glutamate receptor endocytosis (Almeida et al., 2005; Hsia, 1999; Kamenetz et al., 2003; Oddo et al., 2003; Roselli et al., 2005; Snyder et al., 2005).
In this manuscript, we examine the mechanisms underlying Aβ-mediated synaptic depression. We find several parallels between LTD and Aβ-induced synaptic changes. Aβ over-expression decreases spine density, partially occludes mGluR-dependent LTD, decreases synaptic AMPA receptor number and requires second messenger pathways implicated in LTD for its depressive effects. Expression of an AMPA-R mutant that prevents its LTD-driven endocytosis blocks the morphological and synaptic depression induced by Aβ. Furthermore, Aβ can drive phosphorylation of AMPA-Rs at a site important for AMPA-R endocytosis during LTD, and mimicking this AMPA-R phosphorylation produces the morphological and synaptic depression induced by Aβ. Taken together, these results show that Aβ generates structural and synaptic abnormalities via endocytosis of AMPA receptors.
Results
Increased Aβ levels reduce pyramidal neuron spine density
To examine the effects of increased Aβ levels on dendritic spine structure, we imaged CA1 pyramidal neurons in organotypic slice cultures transfected with cDNA encoding APP and, as a cytoplasmic marker, EGFP, with 2-photon laser scanning microscopy (2PLSM) (Figure 1A). A point mutant of APP, APP(MV), was used as a control construct since this APP mutant is cleaved by alpha secretase, but not by beta-secretase (BACE), thus APP(MV) cannot produce Aβ (Citron et al., 1994). Furthermore, over-expression of APP(MV) does not affect glutamatergic synaptic transmission, while APP over-expression depresses glutamatergic synaptic transmission (Kamenetz et al., 2003) (Figure 1E). In Kamenetz et al., we showed that Aβ production from APP and its release is necessary and sufficient to induce this synaptic depression (Kamenetz et al., 2003). Thus, differences on synaptic structure and function observed between the effects of over-expressing APP or APP(MV) should be attributable to increased levels of Aβ
Figure 1. Aβ reduces spine density.
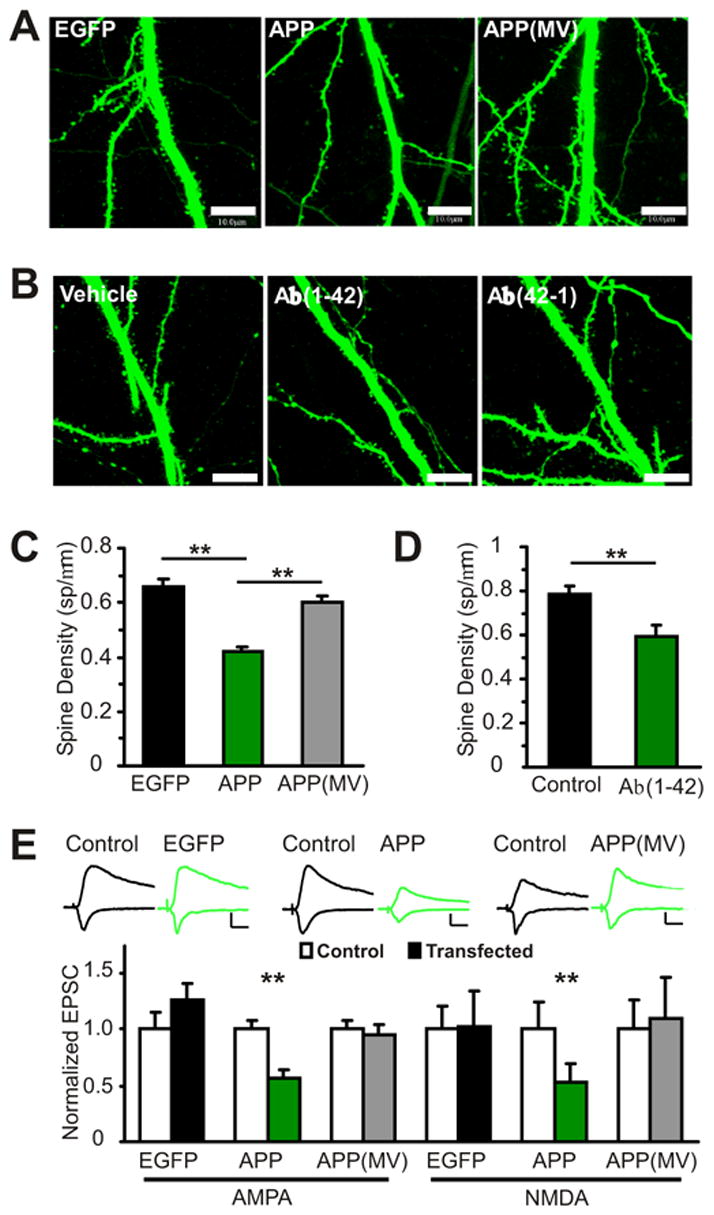
(A) CA1 pyramidal cells co-transfected with EGFP and either APP or APP(MV) as a control were imaged with 2 photon laser scanning microscopy (2PLSM) Scale: 10μm.
(B) CA1 pyramidal cells transfected with EGFP and incubated for 7 days in either vehicle (0.2% DMSO,0.5mM Tris), Aβ(1–42)(1μM) or reverse Aβ(42-1)(1μM).
(C) Over-expression of Aβ decreases spine density in comparison to EGFP expression alone or with APP(MV) (Spine Density (sp/μm), p values are in comparison to EGFP: EGFP: 0.66±0.03, 53 dendrites, 5 cells; APP: 0.42±0.02, 106 dendrites, 10 cells, p<0.01; APP(MV): 0.60±0.02, 114 dendrites, 10 cells, p=0.15; APP vs. APP(MV), p<0.01).
(D) Aβ(1–42) incubation for 7 days decreases spine density (Spine Density (sp/μm): Control (vehicle and Aβ(42-1) combined: 0.79±0.04, 66 dendrites, 8 cells, Aβ(1-42): 0.59± 0.05, 24 dendrites, 4 cells, p<0.01)
(E) Aβ over-expression depresses glutamatergic synaptic transmission (normalized to control(pA): AMPA: control: 1.0±0.07(40.4±2.7), APP: 0.56±0.08(22.7±3.2), n=13, p<0.01; NMDA: control: 1.0±0.24(32.3.0±7.7), APP: 0.53±0.16(17.2±5.0), n=11, p<0.01), while EGFP alone (AMPA: control: 1.0±0.15(33.3±5.0), EGFP: 1.25±0.14(41.7±4.7), n=14 pairs, p=0.4; NMDA: control: 1.0±0.20(24.3±4.8), EGFP: 1.03± 0.29(24.9±7.0), n=12, p=0.4) or with APP(MV) do not depress transmission (AMPA: control: 1.0±0.07(30.7±2.2), APP(MV): 0.95±0.09(29.3±2.6), n=20, p=0.6; NMDA: control: 1.0±0.25(12.2±3.0); APP(MV): 1.10±0.37(13.3±4.5), n=14, p=0.7). Scale: 20pA, 20ms. p values from t-test (spine density) and Wilcoxon test (EPSC). All data are reported as mean ± standard error of the mean (SEM). **=p<0.01.
Three days after transfection, spine density in APP expressing cells was decreased by 31% when compared to control APP(MV) expressing cells or by 36% when compared to cells expressing EGFP alone (Figure 1A,C). To confirm that Aβ is the causative agent that reduces spine density, we transfected slice cultures with EGFP and then incubated them with either synthetic Aβ(1–42), reverse Aβ(42-1), or vehicle for 7 days. EGFP labeled neurons exposed to Aβ(1–42) had lower spine density when compared to neurons exposed to reverse Aβ(42-1) or vehicle (Figure 1B,D). These results indicate that Aβ over-expressed by neurons or exogenously applied causes a loss of dendritic spines.
Aβ-induced synaptic depression partially occludes mGluR LTD
Aβ depresses excitatory glutamatergic synaptic transmission and induces spine loss; findings that are also observed in LTD (Cabelli et al., 1997; Dudek and Bear, 1992; Nagerl et al., 2004; Selig et al., 1995; Snyder et al., 2001; Zhou et al., 2004). To determine whether LTD and Aβ-mediated synaptic depression use common mechanisms, we performed an occlusion experiment (Figure 2). We examined the effect of LTD induction on a control cell and a neighboring cell in which synaptic transmission is depressed by Aβ production. To drive Aβ production, we expressed β-CTF, the BACE1-generated transmembrane product of APP that is the penultimate precursor of Aβ. We expressed β-CTF rather than APP to avoid complications with the activity-dependent nature of Aβ production from APP, which is circumvented by β-CTF (Cirrito et al., 2005; Kamenetz et al., 2003). After expressing β-CTF for 22 to 26 hours in hippocampal CA1 pyramidal cells, which depressed glutamatergic synaptic transmission, we examined the magnitude of mGluR-dependent LTD induced in control and infected neurons with bath application of DHPG (100μM, 5min), a mGluR group I agonist (Huber et al., 2001; Palmer et al., 1997). During baseline (before DHPG), β-CTF expressing neurons showed 34% depression of evoked AMPA-R transmission relative to uninfected cells (Figure 2A). After DHPG application, no significant difference in evoked synaptic transmission was observed between β-CTF and control cells (29.4% vs. 28.5% of control baseline). Both control and β-CTF over-expressing cells displayed significant mGluR LTD, but the magnitude of mGluR LTD induced in the control cells was greater (control: 70% depression; infected: 50%). To control for the possibility that expression of a transmembrane protein could affect LTD, we conducted similar experiments with a β-CTF chimera (APLP2/APP) where the Aβ domain is replaced with the corresponding region in the amyloid precursor-like protein 2 (APLP2). APLP2 belongs to the APP family of proteins and shows considerable homology to APP except at the Aβ region (Wasco, 1993). Expression of APLP2/APP did not depress synaptic transmission (as expected since no Aβ is formed) nor did it affect mGluR LTD induction (3 cell pairs, data not shown). Importantly, evoked synaptic currents were not different between infected and non-infected cells, either before or after LTD induction (Figure 2C). These results indicate that Aβ induces synaptic depression that partially occludes, and potentially shares mechanisms with mGluR LTD.
Figure 2. Aβ-induced synaptic depression partially mimics and occludes mGluR long-term depression (LTD).
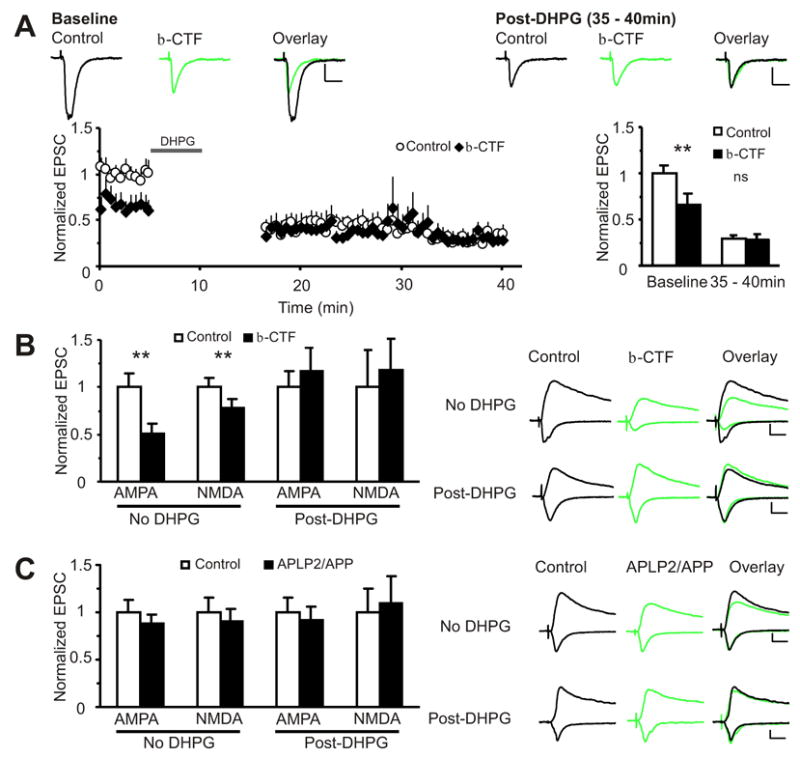
(A) Normalized EPSC amplitudes plotted against time from simultaneously patched pairs of uninfected (○) and β-CTF (♦) infected CA1 pyramidal neurons during baseline and after mGluR LTD induction (100μM DHPG, 5min) are shown on the left. Baseline and 35–40min data are summarized on the right. During baseline, the β-CTF infected neurons show depressed AMPA currents (normalized to control(pA): control: 1.0±0.08(82.7±7.0), β-CTF: 0.65±0.12(52.5±9.7), n=14, p<0.01). After DHPG, there is no difference in amplitude between control and infected neurons (normalized to control baseline(pA): control: 0.29±0.04(22.5±2.7), β-CTF: 0.28±0.06(19.6±2.4), n=9, p=0.6). Scale: 10pA, 20ms.
(B) Aβ-induced depression of NMDA currents occludes mGluR-dependent LTD. Without DHPG, AMPA and NMDA currents are depressed in β-CTF infected cells (AMPA: control: 1.0±0.15(43.9±6.4), β-CTF: 0.51±0.10(22.4±4.3), n=16, p<0.01; NMDA: control: 1.0±0.10(29.1±3.0), β-CTF: 0.78 ± 0.09(22.7±2.6), n=15, p<0.01). After 5 min of 100μM DHPG, AMPA and NMDA currents are equivalent between control and infected neurons (AMPA: control: 1.0± 0.13(26.2±3.5), β-CTF: 1.12±0.18(29.4±4.7), n=17, p=0.8; NMDA: control 1.0±0.3(5.4±1.7), β-CTF: 1.3±0.3(6.8±1.5), n=16, p=0.2).
(C) The APLP2/APP construct does not affect mGluR LTD induction. There is no difference in amplitude between control and infected cells before (AMPA: control: 1.0±0.13(47.0±6.3), APLP2/APP: 0.87±0.10(41.4±4.7), n=17 , p=0.3; NMDA: control: 1.0±0.16(24.9±3.9), APLP2/APP: 0.90±0.13(22.4±3.3), n=13, p=0.08) and after 5 min of 100μM DHPG (AMPA: control: 1.0±0.16(36.8±5.9), APLP2/APP: 0.92±0.14(33.9±5.0), n=13, p=0.3; NMDA: control: 1.0±0.25(35.8±8.8), APLP2/APP: 1.1±0.30(39.1±10.6), n=12, p=0.8). All p values from Wilcoxon test. All data are reported as mean ± SEM. **=p<0.01. Scale: 20pA, 20ms.
To examine if Aβ depression of NMDA-R synaptic transmission also occludes mGluR LTD of NMDA-R responses, we recorded excitatory postsynaptic currents (EPSCs) from pairs of control and β-CTF infected cells after DHPG application. NMDA-R EPSCs measured in cells expressing β-CTF were not significantly different from controls (Figure 2B). Therefore, Aβ-induced synaptic depression partially mimics and occludes mGluR LTD of both AMPA- and NMDA-R synaptic transmission.
p38 MAP Kinase and Calcineurin are required for Aβ-induced synaptic depression
The occlusion experiments suggest that Aβ-induced synaptic depression and LTD share similar signaling mechanisms. We thus examined if second messengers required for LTD also participate in Aβ-induced synaptic depression. p38 mitogen-activated protein kinase (MAPK) is required for, and is activated by, LTD (Bolshakov et al., 2000; Huang et al., 2004; Rush et al., 2002). Calcineurin (protein phosphatase 2B) is also required for LTD (Mulkey et al., 1994).
To test if p38 MAPK and calcineurin are also required for Aβ-mediated synaptic depression, APP infected slices were incubated with inhibitors of p38 MAPK (SB203580, 2μM) or calcineurin (FK506, 50μM). Whole-cell recordings were obtained from nearby infected and non-infected cells. Slices maintained in SB203580 or FK506 exhibited no depressed transmission in infected cells when compared to non-infected cells (Figure 3A). Since SB203580 also blocks JNK, we tested the JNK inhibitor, SP600125, to ensure that SB203580’s effects were specific to the p38 MAPK pathway (Whitmarsh et al., 1997). SP600125 did not block Aβ-mediated synaptic depression (Figure 3A). To ensure that these drugs did not affect BACE1-dependent Aβ production, we tested the effect of these compounds on β-CTF infected cells. The p38 MAPK and calcineurin inhibitors also blocked synaptic depression induced by β-CTF (Figure 3B), similar to cells expressing full-length APP. To further rule out effects on Aβ secretion, secreted Aβ was measured from slice cultures made from transgenic mice expressing APP with the familial Swedish mutation (Borchelt et al., 1997) and incubated with p38 MAPK and calcineurin inhibitors. p38 MAPK inhibitor had no effect on either Aβ40 or Aβ42 secretion, while calcineurin inhibitor slightly decreased Aβ40 and increased Aβ42 secretion (Figure 3C,D). As a positive control, the gamma secretase inhibitor L685,458 reduced Aβ40 secretion by about 50% (Figure 3C,D). To rule out the possibility that these drugs mimicked and occluded (rather than blocked) Aβ-induced depression, we tested their effects on basal synaptic transmission by monitoring their effects on spontaneous miniature events (minis). Slices incubated for 24 hours in p38 MAPK or calcineurin inhibitors showed no decrease in mini amplitude or frequency when compared to vehicle (DMSO), indicating that these drugs did not depress synaptic transmission (Figure 3E,F,G). Indeed, transmission in slices maintained in these drugs was significantly elevated, consistent with the view that slices maintained in normal media undergo some level of an LTD-like process in basal conditions (Zhu et al., 2002). These results indicate that Aβ-induced synaptic depression shares second messenger pathways with LTD.
Figure 3. Aβ-induced synaptic depression requires p38 MAPK and calcineurin activity.
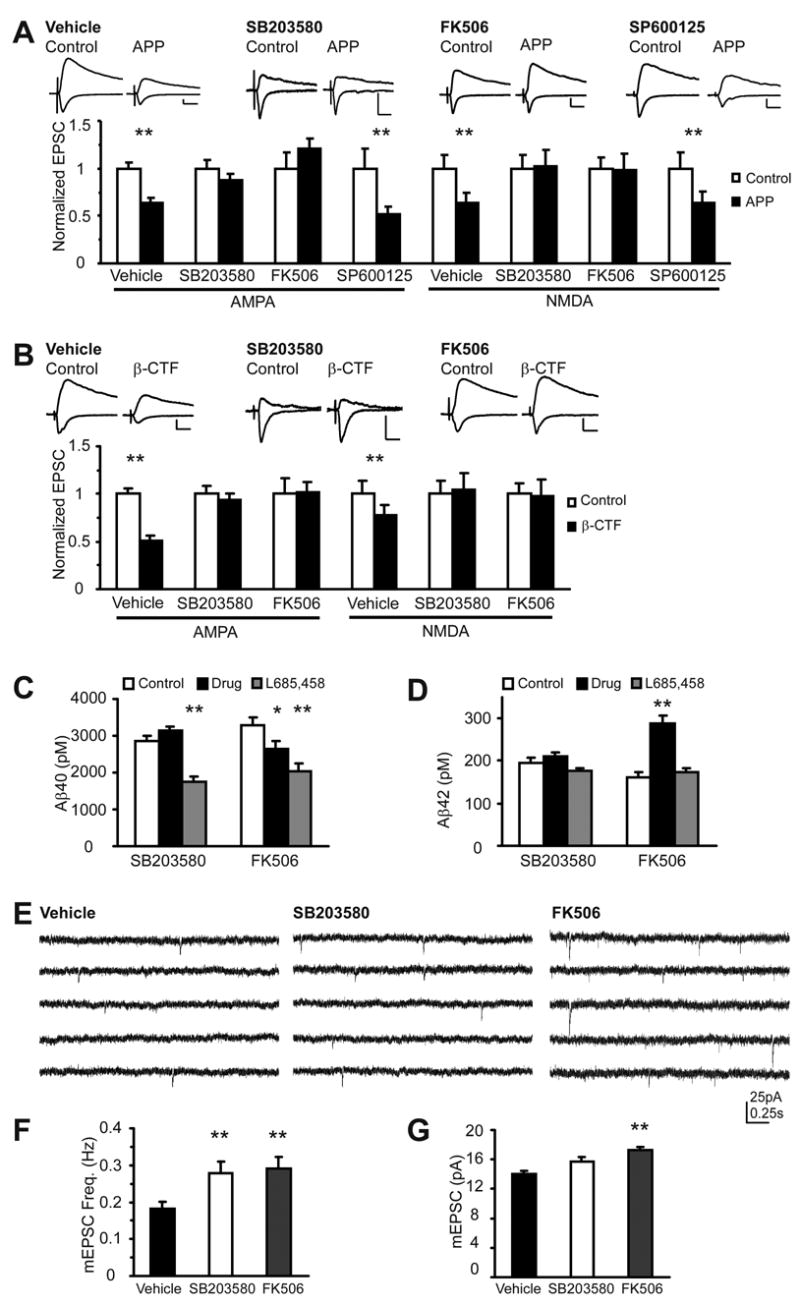
(A) AMPA and NMDA EPSCs recorded from pairs of non-infected or APP infected CA1 pyramidal neurons. Slices maintained in culture with vehicle (normalized to control (pA): AMPA: control: 1.0±0.06(42.5±2.7), APP: 0.63±0.06(26.9±2.4), n=22, p<0.01 ; NMDA: control: 1.0±0.14(42.1±6.0), APP: 0.64±0.11(27.1±4.5), n=19, p<0.01), p38 MAPK inhibitor, SB203580(2μM) (AMPA: control: 1.0±0.09(37.4±3.3), APP: 0.87±0.07(32.5±2.6), n=19, p=0.14; NMDA: control: 1.0±0.14(15.5± 2.2), APP: 1.02±0.18(15.9±2.7), n=19, p=0.9), calcineurin inhibitor, FK506(50μM) (AMPA: control: 1.0±0.16(37.3±6.1), APP: 1.2±0.11(45.1±4.0) n=9, p=0.2; NMDA: control: 1.0±0.11(25.0±2.8), APP: 0.99±0.17(24.6±4.2), n=9, p=0.95) or JNK inhibitor, SP600125(5μM) (AMPA: control: 1.0±0.2(57.6±11.7), APP: 0.52±0.08(29.7±4.6), n=11, p=0.01; NMDA: control: 1.0±0.16(47.8±7.7), APP: 0.64±0.11(30.6±5.6), n=11, p<0.01). p values from Wilcoxon test. Scale: 20pA, 20ms
(B) Results with cells expressing β-CTF. (Vehicle: AMPA: control: 1.0±0.15(43.9±6.4), β-CTF: 0.51±0.10(22.4±4.3), n=16, p<0.01; NMDA: control: 1.0±0.10(29.1±3.0), β-CTF: 0.78 ± 0.09(22.7±2.6), n=15, p<0.01; SB203580: AMPA: control: 1.0±0.14(29.4±4.1), β-CTF: 0.93±0.15(27.5±4.5), n=16, p=0.4; NMDA: control: 1.0±0.14(11.1±5.9), β-CTF: 1.05±0.15(11.6±1.6), n=15, p=0.6, FK506: AMPA: control: 1.0±0.17(32.4±5.7), β-CTF: 1.01±0.14(32.8±4.5), n=11, p=0.6; NMDA: control: 1.0±0.29(23.4±6.9), β-CTF: 0.98±0.22(23.1±5.2), n=10, p=0.8). p values from Wilcoxon test. Scale: 20pA, 20ms
(C,D) Incubation of transgenic APPSwe mouse hippocampal slices with p38 MAPK inhibitor (SB203580) does not affect Aβ40 or Aβ42 secretion (in pM: Vehicle: Aβ40: 2859±158, Aβ42: 194±12.5; SB203580: Aβ40: 3135±122, p=0.2, Aβ42: 211±9.0, p=0.3, n=4 for each condition) while calcineurin/PP2B inhibitor (FK506) slightly decreases Aβ40 and increases Aβ42 secretion (in pM: Vehicle: Aβ40: 3285±203, Aβ42: 162±10.0; FK506: Aβ40: 2626±216, p=0.04, Aβ42: 287±18.3, p<0.01, n=9 for each condition). A gamma secretase inhibitor (L-685,458, 2μM) decreases Aβ40 levels (in pM: for SB203580 trial: Aβ40: 1767±130, p<0.01, Aβ42: 175±5.6, p=0.2; for FK506 trial: Aβ40: 2049±208, p<0.001, Aβ42: 174±9.3, p=0.5). p values from t-test.
(E) Sample traces of mEPSCs recorded in vehicle, p38 MAPK inhibitor (SB203580) and calcineurin/PP2B inhibitor (FK506). Scale: 20pA, 0.25s.
(F) p38 MAPK inhibitor (SB203580) increases mEPSC frequency, while calcineurin/PP2B inhibitor (FK506) increases mEPSC frequency and amplitude (Frequency (Hz): Vehicle: 0.18±0.02, n=16, SB203580: 0.28±0.03, n=16, p=0.01, FK506: 0.29±0.03, n=16, p<0.01)(mEPSC amplitude (pA): Vehicle: 14.0±0.5, n=16, SB203580: 15.7±0.7, n=16, p=0.07, FK506: 17.3±0.9, n=16, p<0.01). p values from t-test. All data are reported as mean ± SEM. *=p<0.05. **=p<0.01.
Increased Aβ levels causes a decrease in surface and synaptic AMPA-Rs
LTD removes surface and synaptic glutamate receptors (Beattie et al., 2000; Lee et al., 2002; Luscher et al., 1999; Luthi et al., 1999). Furthermore, application of synthetic Aβ results in surface removal of NMDA and GluR1 receptors in dissociated cultured hippocampal neurons (Almeida et al., 2005; Snyder et al., 2005). We tested if Aβ removes surface and synaptic AMPA-Rs in organotypic slices, a model system that approximates trafficking of glutamate receptors in vivo better (i.e. following recombinant expression, GluR1 appears constitutively at synapses in dissociated cultured neurons (Passafaro et al., 2001; Shi et al., 2001), while it requires plasticity-inducing activity to reach synapses in organotypic slices or in vivo (Rumpel et al., 2005; Shi et al., 2001)).
To examine surface AMPA-Rs, we co-expressed APP (or APP(MV) as a control) together with an AMPA-R subunit tagged on its N-terminus with Super ecliptic pHluorin (SEP) (Figure 4A,B). SEP is a pH sensitive GFP variant that exhibits a nearly 30-fold decrease in fluorescence when it translocates from a neutral (i.e. cell surface) to an acidic environment (i.e. endocytic compartments), and thus, is a useful surface marker for transmembrane proteins that undergo recycling and/or endocytosis (Ashby et al., 2004; Kopec et al., 2006; Miesenbock et al., 1998). A third construct, encoding tDimer dsRed, was co-expressed as a cytoplasmic marker. The ratio of green (SEP) to red (tDimer dsRed) signal normalized for soma red signal is a volume-normalized measure of surface receptor (see methods for normalization measure). APP co-expression significantly reduced this normalized green to red ratio in spines and dendrites compared to APP(MV) or SEP-tagged receptor alone for both GluR1 and GluR2 subunits (Figure 4). This effect is not due to differences in AMPA-R expression, since AMPA-R expression was not different among the various groups as measured in the cell body (see supplemental figure 1). We conclude that surface AMPA-Rs on spines and dendrites are reduced by APP over-expression (Figure 4C,D). Since this effect was significantly greater in cells expressing APP than those expressing APP(MV), we conclude that Aβ leads to a loss of spine and dendritic surface AMPA receptors.
Figure 4. Aβ reduces surface and synaptic GluR2.
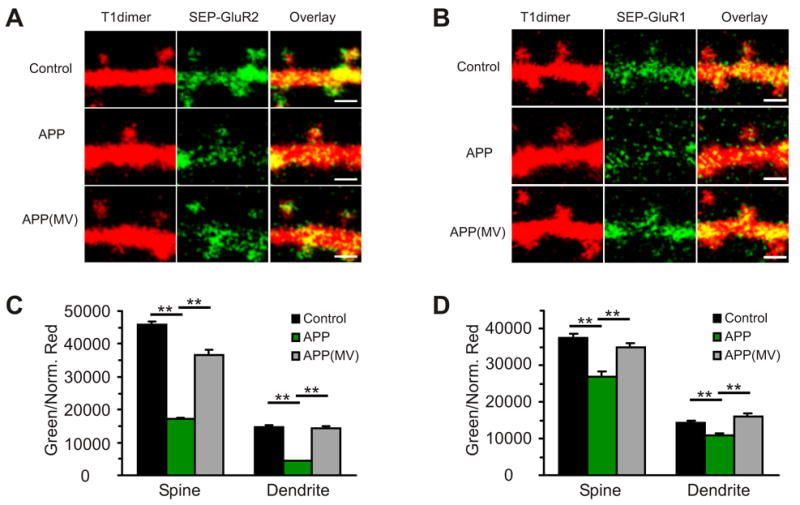
(A) 2PLSM images of neurons co-expressing GluR2 tagged with Super-ecliptic pHluorin (SEP-GluR2), T1dimer and APP or APP(MV). Note reduced surface SEP-GluR2 in cells expressing APP. Scale: 1μm.
(B) 2PLSM images of neurons co-expressing GluR1 tagged with Super-ecliptic pHluorin (SEP-GluR1), T1dimer and APP or APP(MV). Note reduced surface SEP-GluR1 in cells expressing APP. Scale: 1μm.
(C) The surface SEP-GluR2 (green signal) normalized by volume (red signal) (Green/Normalized Red) in spines and dendrites is decreased in APP co-expressing neurons compared to SEP-GluR2 expression alone or with APP(MV)(Spines: SEP-GluR2: 45996.2±926.7, n=1046 spines, APP/SEP-GluR2: 17144.3±402.0, n=482 spines, compare to SEP-GluR2: p<0.01; Dendrite: SEP-GluR2: 14760.8±463.8, n=1046 boxes, 4 cells, APP/SEP-GluR2: 4371.3±162.3, n=482 boxes, compare to SEP-GluR2: p<0.01, 5 cells; APP(MV)/SEP-GluR2: Spines: 36716.6±1517.3, n=554 spines, compare to APP/SEP-GluR2: p<0.01, Dendrites: 14378.2±745.4, n=554 boxes, compare to APP/SEP-GluR2: p<0.01, 5 cells).
(D) The surface SEP-GluR1 normalized by volume (Green/Normalized Red) in spines and dendrites is decreased in APP co-expressing neurons compared to SEP-GluR1 expression alone or with APP(MV)(Spines: SEP-GluR1: 37683.5±1022.6, n=512 spines, APP/SEP-GluR1: 27045.5±1224.4, n=315 spines, compare to SEP-GluR1: p<0.01; Dendrite: SEP-GluR1: 14259.5.8±710.8, n=512 boxes, 4 cells, APP/SEP-GluR1: 10893.6±533.5, n=315 boxes, compare to SEP-GluR1: p<0.01, 5 cells; APP(MV)/SEP-GluR1: Spines: 35050.6±1060.5, n=505 spines, compare to APP/SEP-GluR1: p<0.01, Dendrites: 16184.8±785.4, n=505 boxes, compare to APP/SEP-GluR1: p<0.01). All data are reported as mean ± SEM. p values from t-test. **=p<0.01.
While reduced surface receptor expression on spines is suggestive, it does not necessarily translate into synaptic depression. Surface receptors can be extrasynaptic and may not contribute to evoked currents (Borgdorff and Choquet, 2002; Schnell et al., 2002). To monitor synaptic receptors, we used an ‘electrophysiologically tagged’ GluR2 mutant, GluR2(R607Q), which was also tagged with a N-terminal GFP to allow identification of transfected neurons (Shi et al., 2001). This mutant, when over-expressed, forms inwardly rectifying homomeric receptors that replace endogenous synaptic receptors in a constitutive manner without affecting basal synaptic transmission or plasticity (Seidenman et al., 2003; Shi et al., 2001) (Figure 5B). Neurons expressing the receptor alone, or with the control APP(MV) construct, exhibit significantly increased rectification of AMPA-R mediated synaptic currents, indicating incorporation of the recombinant AMPA-R into synapses (Figure 5A). When APP is co-expressed, however, there is a significant decrease in rectification when compared to the rectification measured in cells expressing GluR2(R607Q) alone or co-expressing APP(MV) (Figure 5A). In agreement with our previous data (Kamenetz et al., 2003) (Figure 1E), co-expression of APP with GluR2(R607Q) depresses both AMPA and NMDA-mediated synaptic transmission, while APP(MV) co-expression does not (Figure 5B). APP over-expression did not affect the expression level of recombinant GluR2(R607Q) nor did it affect endogenous levels of GluR2 or GluR1 (see supplemental figure 1). To confirm that Aβ is responsible for the effects of APP overexpression on synaptic removal of AMPA receptors, we exposed slices expressing GluR2(R607Q) to 2 μM Aβ(1–42) peptide or reverse Aβ(42-1) 36-hours. In slices exposed to control (reverse) peptide, neurons expressing GluR2(R607Q) showed significantly increased rectification compared to neurons not expressing GluR2(R607Q), indicating that recombinant GluR2(R607Q) is incorporated into synapses (Figure 5C). In contrast, for slices exposed to Aβ peptide, neurons expressing GluR2(R607Q) showed no significant increase in rectification compared to neurons not expressing GluR2(R607Q). Therefore, Aβ exposure reduced recombinant GluR2 receptors at synapses. We conclude that Aβ over-expression decreases surface and synaptic AMPA receptors.
Figure 5. Aβ over-expression decreases synaptic GluR2 and depresses synaptic transmission. GluR2(R845A) blocks the Aβ-induced decrease in synaptic GluR2 and transmission.
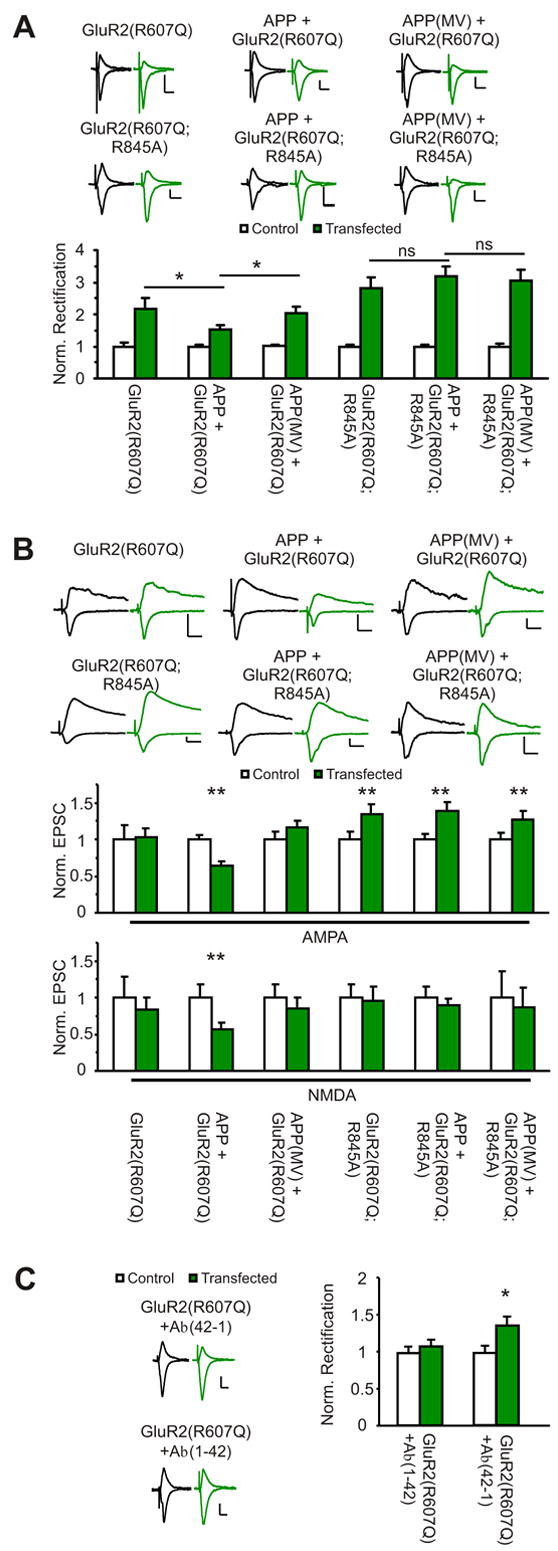
(A) The GluR2(R607Q) mutant increases rectification (normalized to control: control: 1.0±0.12, GluR2(R607Q): 2.17±0.33, n=12, p<0.01 ), which is not different from APP(MV)/GluR2(R607Q) expressing neurons (control: 1.0±0.04, APP(MV)/GluR2(R607Q): 2.03±0.22, n=18, p<0.01; compare to GluR2(R607Q): p=0.9). APP co-expression with GluR2(R607Q) decreases rectification (control: 1.0±0.06, APP/GluR2(R607Q): 1.53±0.12, n=20, p<0.01; compare to GluR2(R607Q): p=0.035; compare to APP(MV)/GluR2(R607Q): p<0.05 ). Over-expression of GluR2(R607Q;R845A) results in slightly increased rectification (control: 1.0±0.05, GluR2(R607Q;R845A): 2.83±0.31, n=13, p<0.01). Rectification of cells co-expressing GluR2(R607Q;R845A) with APP or APP(MV) is not statistically different from cells expressing receptor alone (control: 1.0±0.05, APP/GluR2(R607Q;R845A): 3.18±0.31, n=13, p<0.01, compare to GluR2(R607Q;R856A), p=0.4, compare to APP(MV)/GluR2(R607Q;R845A), p=0.6)(control: 1.0±0.18, APP(MV)/GluR2(R607Q;R845A): 3.05±0.33, n=15, p<0.01, compare to GluR2(R607Q;R845A), p=0.8). p values from t-test.
(B) AMPA and NMDA EPSCs recorded simultaneously from pairs of untransfected and transfected neurons. Over-expression of GluR2(R607Q) alone or with APP(MV) does not affect synaptic transmission. (Normalized to control(pA): AMPA: control: 1.0±0.19(33.2±6.5), GluR2(R607Q): 1.03±0.13(34.2±4.3), n=10, p=0.6; NMDA: control: 1.0±0.28(22.6±6.4), GluR2(R607Q): 0.84±0.17(18.9±3.8), n=9, p=0.8)(AMPA: control: 1.0±0.10(39.9±4.1), APP(MV)/GluR2(R607Q): 1.17±0.09(46.6±3.6), n=24, p=0.6; NMDA: control: 1.0±0.18(30.4±5.4), APP(MV)/GluR2(R607Q): 0.85±0.15(25.9±4.7), n=14, p=0.06). APP co-expression with GluR2(R607Q) depresses synaptic transmission (AMPA: control: 1.0±0.06(48.5±3.1), APP/GluR2(R607Q): 0.64±0.05(31.1±2.6), n=26, p<0.01; NMDA: control: 1.0±0.18(19.4±3.6), APP/GluR2(R607Q): 0.57±0.09(11.0±1.83), n=13, p<0.01). GluR2(R607Q;R845A) expression alone potentiates AMPA, while not affecting NMDA EPSCs (AMPA: control: 1.0±0.10(37.7±3.8), GluR2(R607Q;R845A): 1.34±0.14(50.7±5.2), n=24, p<0.01; NMDA: control: 1.0±0.18(29.5±5.4), GluR2(R607Q;R845A): 0.96±0.18(28.2±5.5), n=13, p=0.4). Co-expression with APP or APP(MV) does not significantly change synaptic transmission when compared to receptor alone (AMPA: control: 1.0±0.08(35.6±2.9), APP/GluR2(R607Q;R845A): 1.39±0.11(49.5±4.1), n=28, p=0.01; NMDA: control: 1.0±0.16(27.9±4.4), APP/GluR2(R607Q;R845A): 0.90±0.08(25.2±2.1), n=14, p=0.8) (AMPA: control: 1.0±0.09(37.7±3.3), APP(MV)/GluR2(R607Q;R845A): 1.28±0.12(48.2±4.5), n=21, p=0.03; NMDA: control: 1.0±0.37(14.7±5.4), APP(MV)/GluR2(R607Q;R845A): 0.87±0.26(12.7±3.8), n=6, p=0.5).
(C) Aβ application reduces synapticGluR2(R607Q). Hippocampal CA1 neurons were infected with GluR2(R607Q) and slices subsequently treated with 2 μM Aβ(1–42) or Aβ(42-1). Rectification was measured from neighboring infected and non-infected cells. (normalized rectification: Aβ (42-1): control: 1.0±0.09, GluR2(R607Q): 1.37±0.11; Aβ (1–42): control: 1.0±0.08, GluR2(R607Q): 1.09±0.08; each n=10; p<0.05). All data are reported as mean ± SEM. p values calculated with Wilcoxon test. ** =p<0.01. * =p<0.05. Scale: 20pA, 20ms.
AMPA-R endocytosis required for Aβ-induced synaptic depression
AMPA receptors containing GluR2 can undergo constitutive cycling in and out of the synapse, which maintains synaptic transmission constant (Brown et al., 2005; Lee et al., 2002; Luscher et al., 1999; Man et al., 2000; Shi et al., 2001), as well as activity-induced removal during LTD (Lee et al., 2004; Oliet et al., 1996). Aβ may cause synaptic depression by driving endocytic removal of GluR2. Alternatively, Aβ could prevent constitutive synaptic delivery and incorporation of GluR2. We tested if Aβ drives AMPA receptor endocytosis by employing a GluR2 mutant, GluR2(R845A), which blocks AP2 dependent GluR2 endocytosis and thereby blocks LTD (Brown et al., 2005; Lee et al., 2002). The R845A mutation was introduced into the inwardly rectifying GFP-GluR2(R607Q) mutant to monitor synaptic incorporation of the recombinant receptor. When expressed alone, GluR2(R607Q;R845A) increased the amplitude and inward rectification of evoked AMPA-R transmission, without affecting NMDA currents, as compared to neighboring non-transfected cells. These results are consistent with synaptic accumulation of the mutant receptor due to decreased clathrin-dependent receptor endocytosis that likely occurs under basal conditions (Figure 5, see also result shown in Figure 3F,G). Co-expression of GluR2(R607Q;R845A) with APP or APP(MV) also increased AMPA-mediated transmission and rectification without affecting NMDA currents (Figure 5A,B). In fact, there was no difference in the AMPA-mediated transmission or rectification when the three conditions (GluR2(R607;R845A alone, with APP or APP(MV)) were compared with each other (Figure 5A,B). These results indicate that Aβ produced by APP over-expression induces synaptic depression by driving endocytosis of AMPA type receptors. Interestingly, co-expression of APP with GluR2(R607Q;R845A) blocked Aβ-induced depression of NMDA-R mediated transmission (Figure 5B). Therefore, Aβ-induced NMDA depression is dependent on the endocytosis of GluR2-type AMPA receptors. This is further addressed in the discussion section.
Enhanced AMPA-R endocytosis mimics structural and functional effects of Aβ
To examine if enhanced endocytosis of synaptic AMPA receptors shows the same electrophysiological and morphological effects as over-expression of APP, we expressed a GluR2 phosphomimetic mutant (GluR2(R607Q;S880E)). The S880 residue in GluR2 is phosphorylated during LTD (Kim et al., 2001a), and phosphomimetic mutations at this site enhance GluR2 endocytosis via interactions with the PDZ containing protein, PICK. (Chung et al., 2000) (Seidenman et al., 2003). Expression of GluR2(S880E) led to the expected decrease in AMPA-R mediated synaptic transmission (Seidenman et al., 2003) but also to a decrease in NMDA-R mediated synaptic transmission (Figure 6C). We next examined the effects of GluR2(R607Q;S880E) on dendritic spines. Untagged GluR2 receptors were expressed to avoid potential morphological effects of masking the extracellular N-terminal of GluR2 (Passafaro et al., 2003). GluR2(R607Q;S880E) expression led to a significant decrease in spine density compared to expression of GluR2(R607Q) (Figure 6A,B). Interestingly, dissociated cortical neurons exposed to 2 μM exogenous Aβ (1–42) for 5 to 15 minutes showed a small but significant increase in phosphorylated GluR2-S880 when compared to vehicle-exposed cultures (see supplemental figure 2). We conclude that loss of synaptic AMPA receptors driven by Aβ-induced phosphorylation of GluR2(S880) leads to spine loss, as well as to a decrease in NMDA-R mediated synaptic transmission.
Figure 6. Expression of S880E mutant of GluR2, which drives synaptic AMPA receptor endocytosis, results in depressed AMPA and NMDA mediated currents and spine loss.
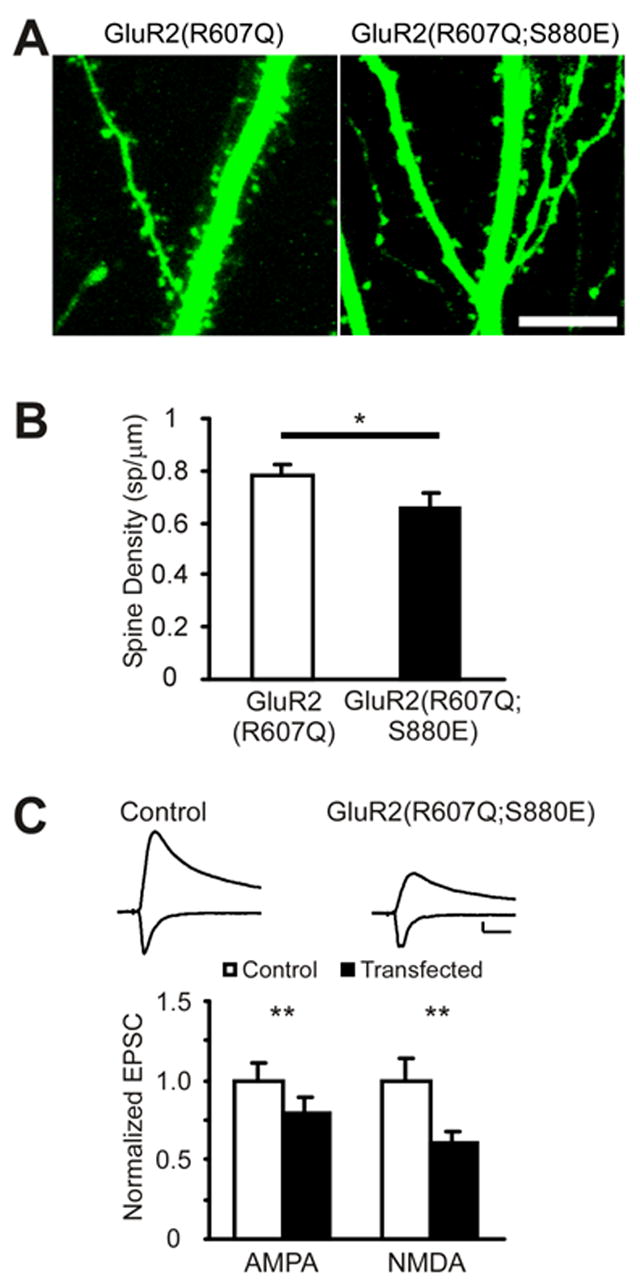
(A) Apical dendrites expressing GluR2(R607Q) or GluR2(R607Q;S880E). Scale: 10μm.
(B) Over-expression of GluR2(R607Q;S880E) results in a decrease in spine density (GluR2(R607Q) (spines/μm): 0.78±0.03, 43 dendrites, 6 cells, GluR2(R607Q;S880E): 0.66±0.03, n=63 dendrites, 6 cells, p=0.01). p value calculated with t-test
(C) Over-expression of GluR2(R607Q;S880E) depresses AMPA and NMDA EPSCs (normalized to control(pA): AMPA: control: 1.0±0.11(47.1±5.2), GluR2(R607Q;S880E): 0.80± 0.10(37.6±4.8), n=14, p=0.01; NMDA: control: 1.0±0.14(28.7±4.0), GluR2(R607Q:S880E): 0.61 ± 0.07(17.4±2.1), n=13, p<0.01). p values calculated with Wilcoxon test. Scale: 20pA, 20ms. **=p<0.01. *=p<0.05.
AMPA-R endocytosis required for Aβ-induced spine loss
GluR2(R607Q;R845A), when co-expressed with APP, prevents the synaptic depression induced by Aβ (Figure 5). In addition, increased GluR2 endocytosis leads to a morphological change in spine density that resembles the Aβ effects (Figure 6). These results point toward the possibility that blocking GluR2 endocytosis could prevent the morphological changes induced by Aβ. As observed with APP over-expression (Figure 1A,C), co-expression of APP, GluR2(R607Q) and cytoplasmic EGFP reduces spine density when compared to cells expressing GluR2(R607Q) and EGFP alone (Figure 7A,B). Co-expression of APP with GluR2(R607Q;R845A), however, reveals no difference in spine density when compared to GluR2(R607Q;R845A) expressed alone. These results show that expression of GluR2(R607Q;R845A) blocks APP-induced synaptic depression and APP-induced spine loss. Thus, endocytosis and removal of synaptic AMPA receptors is required for the structural and functional changes induced by Aβ. Taken together, we show that Aβ uses parts of the LTD pathway to execute its effects on neurons.
Figure 7. GluR2(R845A) blocks Aβ-induced loss in spine number.
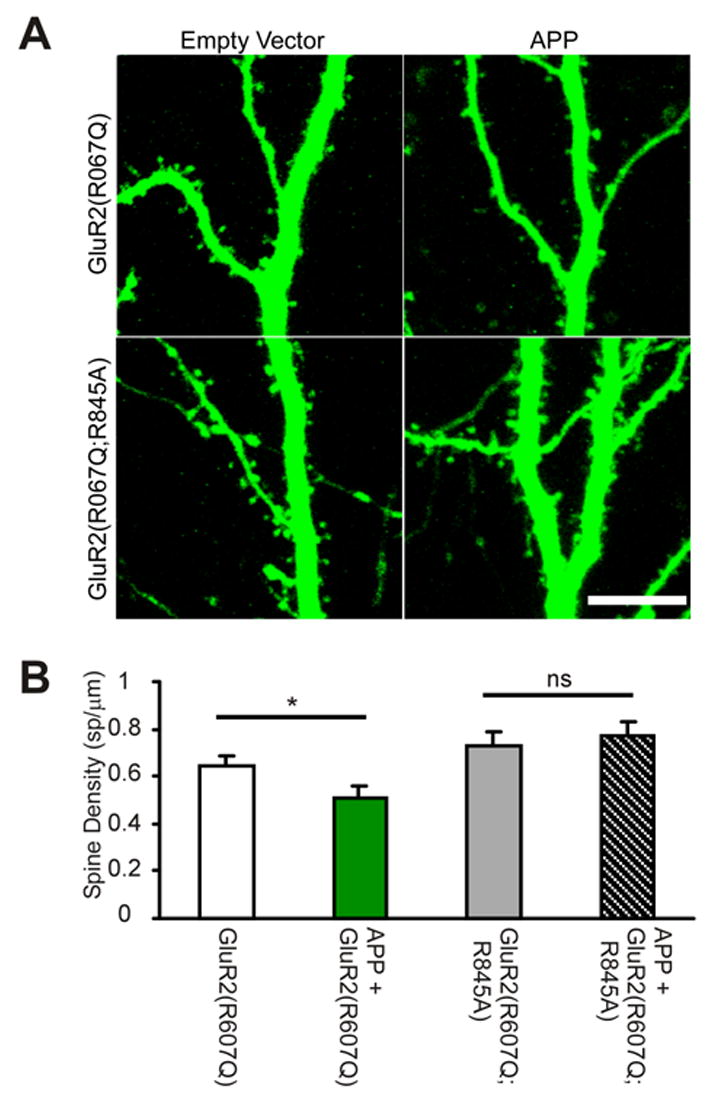
(A) Apical dendrites expressing indicated constructs (along with EGFP) were imaged with 2PLSM. Scale: 10μm.
(B) Co-expression of APP with GluR2(R607Q) decreases spine density when compared to GluR2(R607Q) expression alone (Spine Density (sp/μm): GluR2(R607Q): 0.65±0.04, 32 dendrites; APP/GluR2(R607Q): 0.51±0.05, 33 dendrites, 4 cells/construct, p=0.036). When GluR2(R607Q;R845A) is co-expressed with APP, there is no difference in spine density when compared to GluR2(R607Q;R845A) expression alone (Spine Density (sp/μm): GluR2(R607Q;R845A): 0.73±0.06, 27 dendrites; APP/GluR2(R607Q;R845A): 0.77±0.05, 29 dendrites; 4 cells/construct, p=0.6). All data are reported as mean ± SEM. p values calculated with t-test. *=p<0.05.
Discussion
APP and its catabolite, Aβ, play critical roles in the etiology of Alzheimer’s disease (Selkoe and Schenk, 2003). In addition to neuronal death, the histopathology of AD includes significant loss of synaptic markers, synaptic receptors and postsynaptic spines (Carter et al., 2004; Einstein et al., 1994; Masliah et al., 2001; Terry et al., 1991; Thorns et al., 1997). Transgenic mouse models of AD also display loss in synaptic markers. Furthermore, synaptic dysfunction and learning deficits in these animals appear before amyloid plaque deposition (Hsia, 1999; Moechars et al., 1999; Mucke et al., 2000; Spires et al., 2005). Previous studies from this lab, and others, have shown that increased Aβ levels depress glutamatergic synaptic transmission and surface receptor number (Almeida et al., 2005; Cullen et al., 1997; Hsia, 1999; Kamenetz et al., 2003; Oddo et al., 2003; Snyder et al., 2005). In the present study, we examine the mechanisms underlying Aβinduced depression of glutamatergic synaptic transmission.
Spine loss and synaptic depression
Our results indicate that Aβ, either formed by over-expression of recombinant APP or applied directly, decreases spine density. Spines are a major site of glutamatergic synapses (Nimchinsky et al., 2002; Yuste and Bonhoeffer, 2001), and thus their loss can explain our previous observations that Aβ induces glutamatergic synaptic depression (Kamenetz et al., 2003). A decrease in spine density has also been observed in transgenic mouse models of AD and in brain sections from patients with the disease (Einstein et al., 1994; Lanz et al., 2003; Moolman et al., 2004; Spires et al., 2005; Tsai et al., 2004). This spine loss can be produced by APP over-expression in organotypic slices after 3 days or incubation with synthetic Aβ(1–42) for 7 days (this study Figure 1). Additionally, incubation of dissociated neuronal cultures with synthetic Aβ peptides results in degradation and loss of PSD95, a synaptic scaffolding protein (Almeida et al., 2005; Roselli et al., 2005). Taken together, we conclude that Aβ can cause loss of synapses that ultimately results in behavioral deficits that occur prior to plaque formation or cell death.
Aβ-induced depression and LTD share common mechanisms
To gain more insight into the mechanisms underlying Aβ-induced depression, we tested interactions with mGluR-dependent LTD. We observe that neurons generating increased Aβ show depressed transmission and exhibit lowered mGluR-dependent LTD. This indicates a partial occlusion of LTD and suggests that Aβ-induced depression shares some mechanisms employed by LTD. This is consistent with reports showing that Aβ interacts with pathways activated by group I mGluRs (Tyszkiewicz and Yan, 2005; Wang et al., 2004) and can facilitate LTD induction in vivo (Kim et al., 2001b). Recently, Chang et al. have demonstrated that aged double knock-in mice also exhibit deficits in LTD induction (Chang et al., 2006).
LTD requires both calcineurin and p38 MAP kinase activity (Bolshakov et al., 2000; Brown et al., 2005; Mulkey et al., 1994; Rush et al., 2002; Zhu et al., 2002). We now report that Aβ-induced synaptic depression is blocked by drugs which inhibit these enzymes. Calcineurin activity is also required for Aβ-induced reductions in NMDA receptor function in dissociated cultured neurons (Snyder et al., 2005), consistent with our findings. And lastly, we find that Aβ application leads to phosphorylation of GluR2 at a site important for LTD. In cerebellar LTD this GluR2 residue appears to be phosphorylated by PKC (Xia et al., 2000), while in the hippocampus, the responsible kinase has not been identified (Kim et al., 2001). We conclude that Aβ-induced synaptic depression uses second messenger pathways that likely depress synaptic transmission under physiological conditions.
AMPA receptor endocytosis mediates Aβ-induced synaptic effects
The expression of LTD is believed to result from endocytic removal of synaptic AMPA receptors (Carroll et al., 1999; Lee et al., 2002; Lin et al., 2000; Man et al., 2000; Snyder et al., 2001; Xiao et al., 2001). Using ‘electrophysiological tagging’ of GluR2 (Shi et al., 2001) we find that Aβ reduces synaptic AMPA receptors. These results are further supported by our imaging studies using a SEP-tagged AMPA receptor (Ashby et al., 2004; Kopec et al., 2006; Miesenbock et al., 1998) in which we demonstrate that increased Aβ expression reduces AMPA-Rs on the surface of spines. These results are consistent with studies showing that bath application of Aβ induces endocytosis of surface GluR1 and NMDA-R in dissociated cultured neurons and that cultured neurons from Alzheimer’s disease mouse models also show reduced surface GluR1 and NMDA-Rs (Almeida et al., 2005; Snyder et al., 2005). Our synaptic tagging experiments demonstrate that not only surface, but indeed synaptic receptors are lost in conditions with increased Aβ. This finding is important since there can be loss of surface receptors with little effect on synaptic transmission (e.g. GluR1 KO animals have dramatic loss of extrasynaptic surface receptors but synaptic transmission is intact (Zamanillo et al., 1999). Interestingly, increased Aβ also decreased SEP-tagged GluR1 and GluR2 from dendritic surface regions, suggesting that synaptic AMPA-Rs may be in equilibrium with a pool of dendritic surface receptors.
The removal of receptors during LTD uses clathrin-mediated endocytosis that requires AP2 interactions and dynamin (Lee et al., 2002; Luscher et al., 1999; Luthi et al., 1999). A mutation (R845A) introduced in the cytoplasmic terminus of GluR2 weakens AP2 interactions and inhibits LTD (Brown et al., 2005; Lee et al., 2002). We demonstrate that this GluR2 mutant blocks the synaptic depression produced by increased Aβ production, a finding that provides strong support for the view that Aβ-induced depression of AMPA-R mediated transmission is the result of endocytosis of AMPA receptors. GluR2(R845A) also prevents APP-induced reduction of NMDA-R mediated transmission. Recent studies have shown that incubation of dissociated cultured neurons with synthetic Aβ enhances NMDA receptor endocytosis via calcineurin and striatal enriched phosphatase (STEP) activity (Snyder et al., 2005). Our results indicate that Aβ-mediated endocytosis of NMDA receptors requires endocytosis of GluR2-containing AMPA receptors. Indeed, expression of a mutant GluR2 that promotes its endocytosis led to decreased AMPA as well as NMDA mediated synaptic responses. Our results thus suggest that NMDA receptor endocytosis (as shown by Snyder et al.(2005)) is an event that occurs downstream of AMPA receptor endocytosis.
How could synaptic loss of AMPA receptors lead to loss of synaptic NMDA receptors? Electron microscopic studies show a positive correlation between spine size, synapse size and synaptic AMPA receptor number (Harris et al., 1992; Nusser et al., 1998; Takumi et al., 1999). Furthermore, small spines have shorter life-times than larger spines in chronic in vivo imaging studies (Holtmaat et al., 2005; Zuo et al., 2005). Thus, one may hypothesize that AMPA receptors (and especially GluR2, see (Passafaro et al., 2003)) stabilize synaptic spines, and that removal of AMPA receptors could lead to spine elimination. Loss of spines likely includes endocytosis of synaptic NMDA receptors, which can explain the effects seen by Snyder et al. (2005). Our results, showing that expression of a phosphomimetic mutant AMPA-R that drives its endocytosis leads to loss of spines, further support the hypothesis that AMPA-Rs stabilize spines. With this view, Aβ induces endocytosis of AMPA receptors, which then causes loss of spines and NMDA responses. Most importantly, we find that blocking the Aβ-induced removal of AMPA receptors prevents a reduction in spine number and blocks the decrease in NMDA-R response. In conclusion, our results indicate that Aβ drives the removal of synaptic AMPA receptors and this plays a key role in the toxic effects of Aβ on spines. In the future, strategies that target stabilization of synaptic AMPA-Rs may prove useful in the treatment of Alzheimer’s disease.
Experimental Procedures
DNA Constructs
Virally expressed human APP695, β-CTF, APP(MV) were co-expressed with EGFP using an internal ribosomal entry site (IRES) construct as described, (Hayashi et al., 2000; Kamenetz et al., 2003). The GFP-GluR1, GFP-GluR2(R607Q), SEP-GluR1 and SEP-GluR2(R607Q) constructs were described previously (Kopec et al., 2006; Shi et al., 2001). The R845A and S880E mutations were introduced into the GFP-GluR2(R607Q) construct using the QuickChange system (Stratagene, Cedar Creek, TX) and verified by sequencing. Untagged GluR2 constructs were generated from GFP-tagged constructs by cutting out the GFP with NheI and ApaI and re-ligating the plasmid. All electrophysiology was performed with GFP-tagged receptors, while untagged receptors were used in imaging experiments described in figures 6 and 7. The red fluorescent protein (tDimer dsRed), a fast maturing obligate dimer version of dsRed (provided by R. Tsien), and EGFP (Clontech, Mountain View, CA) were used as cytoplasmic markers. For biolistic transfection (BioRad, Hercules, CA), constructs were subcloned into the pCI expression vector (Promega, Madison, WI).
Hippocampal Slice Cultures, Transfection and Sindbis Pseudoviruses Infection
Organotypic hippocampal slice cultures were made from postnatal day 6 or 7 rat pups as described (Stoppini et al., 1991). Slice cultures were maintained in culture for 6–9 days and then transfected using either Sindbis virus (Invitrogen, Carlsbad, CA) or biolistic GeneGun transfection (BioRad, Hercules, CA). Cells were recorded 22 to 26 hours after Sindbis virus infection, whereas biolistically transfected neurons were recorded/imaged 3–4 days after transfection, except for Aβ application experiment where cells were imaged 7 days after transfection. Sindbis pseudovirus was prepared as described previously (Hayashi et al., 2000). Biolistic transfection was used to co-express multiple constructs; bullets were made as described in the GeneGun manual. For GeneGun bullets, constructs were used in a 1:1 molar ratio except for cytoplasmic marker plasmids, which were used in 1:8 (EGFP) or a 1:4 (tDimer) molar ratio to the other constructs. For control conditions (i.e. Figure 1A, EGFP control), empty pCI vector was used in lieu of APP or APP(MV) expressing vectors.
Dissociated cortical cultures and immunoblot for phospho-GluR2
Dissociated cortical cultures were prepared from embryonic day 18 old rats following the standard protocol from Brewer (1995). In short, the cortices were dissected, digested in Papain (Sigma), titurated to isolate cells and plated with a density of 2x10⁵ cells per well on previously poly-D-lysine (Sigma) coated 6-well plates. After 2 weeks in culture, freshly prepared Aβ (see below) or vehicle (5% NH4OH, 0.05M Tris pH7.5) was added to the medium and the cells were incubated for 5–15 minutes. The neurons were washed and harvested with ice-cold buffer (in mM: 167 NaCl, 5.4 KCl, 11 glucose, 1.8 CaCl2 and 10 HEPES, pH7.3, 320 mOsm). Lysis took place in 1% SDS, the cells were first sonicated and afterwards boiled at 100°C for 10 minutes. Per lane, 10g of protein were analysed by Immunoblot with an anti-phospho-GluR2(Ser880) antibody (Upstate) followed by stripping the blot and reprobing it with an anti-GluR2 antibody (Chemicon) as loading control. The signal for phosphoGluR2 was normalized against total GluR2 in vehicle and Aβ treated cultures. Both groups were compared with the Wilcoxon test.
Image Acquisition and Quantification
Images were collected using a custom-built two-photon microscope based on an Olympus Fluoview laser-scanning microscope (Olympus America, Melville, NY) with a 60x, 0.8 numerical aperture water immersion lens. The light source was a mode-locked Ti:sapphire laser (Mira 900F, Coherent, Santa Clara, CA) tuned to 910 nm. Laser power was set from ~ 50 to 100 mW, where fluorescence signal did not saturate, photobleaching did not occur, and further increases in laser power did not reveal more structures (i.e. spines). Slices were placed in an imaging chamber with circulating artificial cerebrospinal fluid (see below) maintained at 28°C. Stacks of images (each image was an average of 3 scans) were acquired, each image was taken every 0.5 μm in the z-axis. CA1 pyramidal cells were identified with epifluorescence. Typically, 1 to 2 CA1 cells were transfected per slice and analyzed. Cell soma and ~200 μm apical dendrites, starting 50 μm from the soma, were imaged and were analyzed blind to the experimental protocol. Spines were analyzed using custom software written in MatLab. Because of optical constraints, spines emerging above or below the dendrite were not analyzed. Spine density was the number of manually counted spines divided by dendrite segment length. Spine density values are compared across conditions with an unpaired 2-tail Student’s t-test. Significance was set at p<0.05.
To measure the content of tDimer or SEP-tagged receptor in a spine, a 10x10 pixel (box) region of interest was drawn to encompass a spine or dendritic region. Fluorescence signal was defined as signal greater than three standard deviations above background. Signal was background subtracted and leak from one channel to the other was corrected by independent measurements of cells expressing either only tDimer or EGFP (leak values: red → green ~ 0.15; green → red ~ 0.01). Background and leak corrected fluorescence signal was calculated for subsequent z stacks containing the spine. Structures were identified in the red channel with z boundaries defined by the full-width at half max of fluorescence signal; the red and green signals were integrated over this volume. Red signal was normalized for level of expression by dividing the integrated red signal (Rint) of a structure by the peak red signal measured in a 10x10 pixel (box) region of interest in the cell soma (Rmax). As shown in supplemental figure 1, this is a valid normalization since spine tDimer fluorescence correlates well with tDimer fluorescence in cell body, as expected for a freely diffusible cytoplasmic protein. The green signal (Gint) in spines and dendrites was not normalized by soma green signal (Gmax) since the amount of recombinant receptor in spines is not dependent on recombinant receptor expression levels (see supplemental figure 1). Dendrite expression of recombinant receptors is also independent of levels of soma over-expression (Kessels et al., submitted). The green/normalized red ratio was calculated by dividing the spine or dendrite integrated green signal (Gint) by the normalized spine or dendrite integrated red signal (Rint/Rmax). Data were compared using an unpaired 2-tail Student’s t-test.
To determine if EGFP, APP, or APP(MV) over-expression with Sindbis virus affected endogenous GluR1 and GluR2 levels, immunohistochemistry was performed on slices infected for 22–26 hours with either EGFP, APP IRES EGFP or APP(MV) IRES EGFP expressing Sindbis virus. Slices were fixed at 4°C in 4% paraformaldehyde/4% sucrose for 1 hour, washed in PBS, then permeabilized for 45 minutes in 0.3% Triton-PBS at 4°C. After washing and blocking in 10% horse serum PBS, slices were incubated overnight in primary anti-GluR1 or anti-GluR2 (Chemicon). Texas Red conjugated secondary antibodies (Molecular Probes) were used to visualize labeled structures. Somas were imaged using 2PLSM with the imaging conditions described above. Leak values were calculated for Texas Red (red→green 0.005). 3 contiguous z stacks were collapsed for analysis. 10 pixel wide profiles were drawn over somas where the apical dendrite originates and the peak red signal was measured. Sindbis infected neurons were identified in the green channel. The red signal in the Sindbis infected neurons was normalized to the red signals of uninfected neurons within the same image. Data were compared using an unpaired 2-tail Student’s t-test.
Electrophysiology and Pharmacological Treatments
Simultaneous whole-cell recordings were obtained from pairs of neighboring (<50μm) control and infected/transfected CA1 pyramidal neurons under visual guidance using differential interference contrast and fluorescence microscopy. The recording chamber was perfused with ACSF containing the following (in mM): 119 NaCl, 2.5 KCl, 26 NaHCO3, 1 NaH2PO4, 11 glucose, and 0.1 picrotoxin (Sigma, St. Louis, MO), bubbled with 5% CO2 and 95% O2, pH 7.4. To measure evoked responses in hippocampal slice cultures, 4 mM CaCl2 and 4 mM MgCl2 were added. To prevent bursting, 2μM 2-chloradenosine (Sigma) was added to the ACSF. All recording were at 28°C. Patch pipettes (3–6MΩ) were filled with internal solution containing the following (in mM): 115 cesium methanesulfonate, 20 CsCl, 10 HEPES, 2.5 MgCl2, 4 Na2ATP, 0.4 Na3GTP, 10 sodium phosphocreatine, and 0.6 EGTA, pH 7.25, 290 mOsm. For rectification recordings, 0.1mM spermine (Sigma) was included in the internal solution. For mGluR LTD experiments, 130 mM potassium gluconate and 5 mM KCl were substituted for cesium methansulfonate and CsCl. Whole cell recordings were performed using two Axopatch-1D amplifiers (Axon Instruments, Union City, CA) and filtered at 1 kHz. Data were acquired (ITC-18 computer interface; Instrutech, Port Washington, NY) and analyzed using custom software written in Igor Pro (WaveMetrics, Lake Oswego, OR). Synaptic responses were evoked using bipolar electrodes (Frederick Haer, Bowdoinham, ME) giving single voltage pulses (200μ s, 0.5–10V) at 0.33 Hz frequency. Electrodes were placed over Schaffer collaterals ~300–500 μm away from the recording site. Stimulus intensity was adjusted to produce ~40 pA response in control cells. Average EPSC amplitudes were obtained from 50–100 sweeps at each holding potential. All recordings were done by stimulating two independent synaptic inputs; results from each pathway were averaged and counted as n = 1. The AMPA-mediated EPSC was measured as peak inward current at −60V; the NMDA-mediated component was measured as the late component (80 ms after stimulus) of the outward current at +40mV. Rectification was calculated as the ratio of the peak AMPA current in 100 μM D,L-APV (Tocris, Ellisville, MO) at −60 and +40 mV, corrected by current at 0 mV. Some rectification data were acquired from single neuron recordings (instead of pairs).
For pharmacological experiments, drugs were added to media before transfection, maintained every 12 hours, and included in ACSF during recordings. Treatments used: 2μM SB203580 (Vehicle: water, Calbiochem, San Diego, CA), 50 μM FK506 (Vehicle: DMSO, Fujisawa, Tokyo, Japan), 2μM L-685-458 (Vehicle: DMSO, Merck), 5μM SP600125 (Vehicle: DMSO, Calbiochem). mGluR LTD was induced by 5min bath application of 100μM (R,S)-3,5-dihydroxyphenylglycine (DHPG) (Vehicle: water, Tocris). The cell was held in current clamp during DHPG application and 5 min afterwards (Huber et al., 2001).
For mEPSC studies, drugs were applied to slice cultures at 7DIV and recordings were performed at 8 DIV. 1μM TTX (Vehicle: water, Sigma) was included in ACSF to block sodium channels. The same ACSF was used as described above, except Ca+2 and Mg+2 concentrations were changed to 2.5mM and 1.2mM, respectively. Data were acquired at 5 kHz, filtered at 2 kHz, and analyzed with template matching using Axograph (Axon instruments) with the following mEPSC criteria: 5ms baseline, event length 30ms, rise time 0.2–5ms, decay τ<7ms, threshold = 3* standard deviation of noise. Average mEPSC amplitude and interevent interval were calculated for each cell.
All data are reported as mean ± SEM. Statistical analysis for paired recordings used the Wilcoxon test. To compare rectification values across constructs, the rectification of transfected cells were normalized by the mean control cell rectification, then tested across groups using an unpaired 2-tail Student’s t-test. For LTD experiments, the Wilcoxon test was used for pairwise comparisons, while the Student’s t-test was used to compare magnitude of LTD induction. Drug conditions for mEPSC recordings were compared using a 2-tailed Student’s t-test. Significance was set at p<0.05.
Aβ Peptides
Peptides (Biosource, CA) were dissolved in vehicle and sonicated until dissolved, then aliquoted and stored at −80°C. 1μM Aβ(1–42) or Aβ(42-1) or vehicle (dependent on the manufacturer’s instructions 0.2 % DMSO or 5% NH4OH in Tris buffer) was included in the media of EGFP transfected 7 DIV slice cultures and were maintained every 2–3 days for a week. There was no statistical difference in spine density between the Aβ(42–1) and vehicle condition, so the data were pooled and considered as a control group.
Quantification of Aβ Secretion by Two-site ELISAs
Organotypic hippocampal slice cultures were prepared from 6–7 day old APPSwe transgenic mice (Borchelt et al., 1997) and cultured for 7 days. Five slices were placed on each membrane. Slices were maintained with or without drugs for 4 days whereupon slice culture media was collected and mixed with 0.075% CHAPS and 0.2% BSA to prevent protein precipitation. Aβ was measured using a two-site ELISA that specifically detects the C-terminus of Aβ, as described (Tomita et al., 1997)
Supplementary Material
Supplemental Figure 1. (A) Over-expression of EGFP, APP IRES EGFP or APP(MV) IRES EGFP with Sindbis virus does not significantly affect endogenous GluR2 levels. Neurons infected with Sindbis virus are labeled with anti-GluR2 antibody on the left; the quantification is shown on the right (values normalized to signal of non-infected cells: EGFP: non-infect: 1.0±0.04, n=17, infect: 0.89±0.09, n=10, p=0.2, APP IRES EGFP: non-infect: 1.0±0.04, n=30, infect: 1.06±0.05 , n=11, p=0.4, APP(MV) IRES EGFP: non-infect: 1.0±0.03, n=26, infect: 1.07±0.06, n=17, p=0.25).
(B) Over-expression of EGFP, APP IRES EGFP or APP(MV) IRES EGFP with Sindbis virus does not significantly affect endogenous GluR1 levels. Neurons infected with Sindbis virus are labeled with anti-GluR1 antibody on the left; the quantification is shown on the right (values normalized to signal of non-infected cells: EGFP: 1.0±0.04, n=20, infect: 1.0±0.05, n=12, p=0.98, APP IRES EGFP: non-infect: 1.0±0.02, n=14, infect: 1.14±0.10 , n=10 , p=0.09, APP(MV) IRES EGFP: non-infect: 1.0±0.03, n=15, infect: 1.08±0.05, n=12, p=0.17).
(C) There are no significant differences in the average absolute SEP-GluR2 signal at the soma (Gmax) between cells expressing SEP-GluR2 alone or with APP or APP(MV) (Fluorescence in arbitrary units: SEP-GluR2: 6357 ± 727, 4 cells, 16 boxes; APP/SEP-GluR2: 9081±1587 , 5 cells, 40 boxes, APP(MV)/SEP-GluR2: 7724.7±1814 , 5 cells, 40 boxes)
(D) There are no significant differences in the average absolute SEP-GluR1 signal at the soma (Gmax) between cells expressing SEP-GluR1 alone or with APP or APP(MV) (Fluorescence in arbitrary units: SEP-GluR1: 11978±1107 , 4 cells, 32 boxes; APP/SEP-GluR1: 15415±2367, 5 cells, 40 boxes; APP(MV)/SEP-GluR1:11145 ±490 , 5 cells, 40 boxes)
(E) SEP-GluR2 signal (green) in spines is not correlated with SEP-GluR2 signal (Gmax) at the cell soma. The SEP-GluR2 spine data of all 14 cells analyzed (SEP-GluR2 only, APP/SEP-GluR2 and APP(MV)/SEP-GluR2) are combined and analyzed as a group, where each point represents a cell (Pearson R value: 0.213, p=0.465).
(F) tDimer signal (red) in spines of cells co-expressing SEP-GluR2 is correlated with tDimer signal (Rmax) at the cell soma. The tDimer spine data of all 14 cells analyzed are combined and analyzed as a group (Pearson R value: 0.686, p<0.01).
(G) SEP-GluR1 signal (green) in spines is not correlated with SEP-GluR1 signal (Gmax) at the cell soma. The SEP-GluR2 spine data of all 14 cells analyzed (SEP-GluR1 only, APP/SEP-GluR1 and APP(MV)/SEP-GluR1) are combined and analyzed as a group, where each point represents a cell (Pearson R value: 0.112, p=0.703).
(H) tDimer signal (red) in spines of cells co-expressing SEP-GluR1 is correlated with tDimer signal (Rmax) at the cell soma. The tDimer spine data of all 14 cells analyzed are combined and analyzed as a group (Pearson R value: 0.865, p<0.01).
Supplemental Figure 2. Aβ-induced phosphorylation of GluR2-S880 Increase in the phosphorylation of GluR2-S880 after Aβ application (2 μM) in dissociated cortical cultures in comparison to vehicle treated cultures. (normalized vehicle: 1.0±0.06; Aβ: 1.26±0.07; n=6; p<0.05).
Acknowledgments
We thank Graziella DiCristo, Emiliano Verde and members of the Malinow laboratory for helpful discussions, William Benjamin for careful reading of the manuscript, and Nancy Dawkins for expert technical assistance. We thank Takeda Pharmaceutical Company for Aβ enzyme-linked immunosorbent assay and Richard L. Huganir for providing us with anti-phospho-GluR2(S880). This work was supported by grants from the Program for Promotion of Fundamental Studies in Health Sciences of the National Institute of Biomedical Innovation (NIBIO) (TI and TT), the Ministry of Education, Science, Culture and Sports for the 21st Century Center of Excellence Program, Japan (TI and TT), the Fidelity Foundation (RM), National Institutes of Health (AG021494, SS), the Alzheimer’s Association (JB) and the National Institute of Neurological Disorders and Stroke (NRSA, HH).
Footnotes
Publisher's Disclaimer: This is a PDF file of an unedited manuscript that has been accepted for publication. As a service to our customers we are providing this early version of the manuscript. The manuscript will undergo copyediting, typesetting, and review of the resulting proof before it is published in its final citable form. Please note that during the production process errors may be discovered which could affect the content, and all legal disclaimers that apply to the journal pertain.
References
- Almeida CG, Tampellini D, Takahashi RH, Greengard P, Lin MT, Snyder EM, Gouras GK. Beta-amyloid accumulation in APP mutant neurons reduces PSD-95 and GluR1 in synapses. Neurobiol Dis. 2005;20:187–198. doi: 10.1016/j.nbd.2005.02.008. [DOI] [PubMed] [Google Scholar]
- Ashby MC, De La Rue SA, Ralph GS, Uney J, Collingridge GL, Henley JM. Removal of AMPA receptors (AMPARs) from synapses is preceded by transient endocytosis of extrasynaptic AMPARs. J Neurosci. 2004;24:5172–5176. doi: 10.1523/JNEUROSCI.1042-04.2004. [DOI] [PMC free article] [PubMed] [Google Scholar]
- Baude A, Nusser Z, Roberts JD, Mulvihill E, McIlhinney RA, Somogyi P. The metabotropic glutamate receptor (mGluR1 alpha) is concentrated at perisynaptic membrane of neuronal subpopulations as detected by immunogold reaction. Neuron. 1993;11:771–787. doi: 10.1016/0896-6273(93)90086-7. [DOI] [PubMed] [Google Scholar]
- Beattie EC, Carroll RC, Yu X, Morishita W, Yasuda H, von Zastrow M, Malenka RC. Regulation of AMPA receptor endocytosis by a signaling mechanism shared with LTD. Nat Neurosci. 2000;3:1291–1300. doi: 10.1038/81823. [DOI] [PubMed] [Google Scholar]
- Billings LM, Oddo S, Green KN, McGaugh JL, Laferla FM. Intraneuronal Abeta causes the onset of early Alzheimer’s disease-related cognitive deficits in transgenic mice. Neuron. 2005;45:675–688. doi: 10.1016/j.neuron.2005.01.040. [DOI] [PubMed] [Google Scholar]
- Bliss TV, Lomo T. Long-lasting potentiation of synaptic transmission in the dentate area of the anaesthetized rabbit following stimulation of the perforant path. J Physiol. 1973;232:331–356. doi: 10.1113/jphysiol.1973.sp010273. [DOI] [PMC free article] [PubMed] [Google Scholar]
- Bolshakov VY, Carboni L, Cobb MH, Siegelbaum SA, Belardetti F. Dual MAP kinase pathways mediate opposing forms of long-term plasticity at CA3-CA1 synapses. Nat Neurosci. 2000;3:1107–1112. doi: 10.1038/80624. [DOI] [PubMed] [Google Scholar]
- Bolshakov VY, Siegelbaum SA. Postsynaptic induction and presynaptic expression of hippocampal long-term depression. Science. 1994;264:1148–1152. doi: 10.1126/science.7909958. [DOI] [PubMed] [Google Scholar]
- Borchelt DR, Ratovitski T, van Lare J, Lee MK, Gonzales V, Jenkins NA, Copeland NG, Price DL, Sisodia SS. Accelerated amyloid deposition in the brains of transgenic mice co-expressing mutant presenilin 1 and amyloid precursor proteins. Neuron. 1997;19:939–945. doi: 10.1016/s0896-6273(00)80974-5. [DOI] [PubMed] [Google Scholar]
- Borgdorff AJ, Choquet D. Regulation of AMPA receptor lateral movements. Nature. 2002;417:649–653. doi: 10.1038/nature00780. [DOI] [PubMed] [Google Scholar]
- Brewer GJ. Serum-free B27/neurobasal medium supports differentiated growth of neurons from the striatum, substantia nigra, septum, cerebral cortex, cerebellum, and dentate gyrus. J Neurosci Res. 1995;42:674–683. doi: 10.1002/jnr.490420510. [DOI] [PubMed] [Google Scholar]
- Brown TC, Tran IC, Backos DS, Esteban JA. NMDA receptor-dependent activation of the small GTPase Rab5 drives the removal of synaptic AMPA receptors during hippocampal LTD. Neuron. 2005;45:81–94. doi: 10.1016/j.neuron.2004.12.023. [DOI] [PubMed] [Google Scholar]
- Cabelli RJ, Shelton DL, Segal RA, Shatz CJ. Blockade of endogenous ligands of trkB inhibits formation of ocular dominance columns. Neuron. 1997;19:63–76. doi: 10.1016/s0896-6273(00)80348-7. [DOI] [PubMed] [Google Scholar]
- Carroll RC, Lissin DV, von Zastrow M, Nicoll RA, Malenka RC. Rapid redistribution of glutamate receptors contributes to long-term depression in hippocampal cultures. Nat Neurosci. 1999;2:454–460. doi: 10.1038/8123. [DOI] [PubMed] [Google Scholar]
- Carter TL, Rissman RA, Mishizen-Eberz AJ, Wolfe BB, Hamilton RL, Gandy S, Armstrong DM. Differential preservation of AMPA receptor subunits in the hippocampi of Alzheimer’s disease patients according to Braak stage. Exp Neurol. 2004;187:299–309. doi: 10.1016/j.expneurol.2003.12.010. [DOI] [PubMed] [Google Scholar]
- Chang EH, Savage MJ, Flood DG, Thomas JM, Levy RB, Mahadomrongkul V, Shirao T, Aoki C, Huerta PT. AMPA receptor downscaling at the onset of Alzheimer’s disease pathology in double knockin mice. Proc Natl Acad Sci U S A. 2006;103:3410–3415. doi: 10.1073/pnas.0507313103. [DOI] [PMC free article] [PubMed] [Google Scholar]
- Chapman PF, White GL, Jones MW, Cooper-Blacketer D, Marshall VJ, Irizarry M, Younkin L, Good MA, Bliss TV, Hyman BT, et al. Impaired synaptic plasticity and learning in aged amyloid precursor protein transgenic mice. Nat Neurosci. 1999;2:271–276. doi: 10.1038/6374. [DOI] [PubMed] [Google Scholar]
- Chung HJ, Xia J, Scannevin RH, Zhang X, Huganir RL. Phosphorylation of the AMPA receptor subunit GluR2 differentially regulates its interaction with PDZ domain-containing proteins. J Neurosci. 2000;20:7258–7267. doi: 10.1523/JNEUROSCI.20-19-07258.2000. [DOI] [PMC free article] [PubMed] [Google Scholar]
- Cirrito JR, Yamada KA, Finn MB, Sloviter RS, Bales KR, May PC, Schoepp DD, Paul SM, Mennerick S, Holtzman DM. Synaptic activity regulates interstitial fluid amyloid-beta levels in vivo. Neuron. 2005;48:913–922. doi: 10.1016/j.neuron.2005.10.028. [DOI] [PubMed] [Google Scholar]
- Citron M, Vigo-Pelfrey C, Teplow DB, Miller C, Schenk D, Johnston J, Winblad B, Venizelos N, Lannfelt L, Selkoe DJ. Excessive production of amyloid beta-protein by peripheral cells of symptomatic and presymptomatic patients carrying the Swedish familial Alzheimer disease mutation. Proc Natl Acad Sci U S A. 1994;91:11993–11997. doi: 10.1073/pnas.91.25.11993. [DOI] [PMC free article] [PubMed] [Google Scholar]
- Cleary JP, Walsh DM, Hofmeister JJ, Shankar GM, Kuskowski MA, Selkoe DJ, Ashe KH. Natural oligomers of the amyloid-beta protein specifically disrupt cognitive function. Nat Neurosci. 2005;8:79–84. doi: 10.1038/nn1372. [DOI] [PubMed] [Google Scholar]
- Cullen WK, Suh YH, Anwyl R, Rowan MJ. Block of LTP in rat hippocampus in vivo by beta-amyloid precursor protein fragments. Neuroreport. 1997;8:3213–3217. doi: 10.1097/00001756-199710200-00006. [DOI] [PubMed] [Google Scholar]
- Dudek SM, Bear MF. Homosynaptic long-term depression in area CA1 of hippocampus and effects of N-methyl-D-aspartate receptor blockade. Proc Natl Acad Sci U S A. 1992;89:4363–4367. doi: 10.1073/pnas.89.10.4363. [DOI] [PMC free article] [PubMed] [Google Scholar]
- Einstein G, Buranosky R, Crain BJ. Dendritic pathology of granule cells in Alzheimer’s disease is unrelated to neuritic plaques. J Neurosci. 1994;14:5077–5088. doi: 10.1523/JNEUROSCI.14-08-05077.1994. [DOI] [PMC free article] [PubMed] [Google Scholar]
- Engert F, Bonhoeffer T. Dendritic spine changes associated with hippocampal long-term synaptic plasticity. Nature. 1999;399:66–70. doi: 10.1038/19978. [DOI] [PubMed] [Google Scholar]
- Freir DB, Holscher C, Herron CE. Blockade of long-term potentiation by beta-amyloid peptides in the CA1 region of the rat hippocampus in vivo. J Neurophysiol. 2001;85:708–713. doi: 10.1152/jn.2001.85.2.708. [DOI] [PubMed] [Google Scholar]
- Giacchino J, Criado JR, Games D, Henriksen S. In vivo synaptic transmission in young and aged amyloid precursor protein transgenic mice. Brain Res. 2000;876:185–190. doi: 10.1016/s0006-8993(00)02615-9. [DOI] [PubMed] [Google Scholar]
- Harris KM, Jensen FE, Tsao B. Three-dimensional structure of dendritic spines and synapses in rat hippocampus (CA1) at postnatal day 15 and adult ages: implications for the maturation of synaptic physiology and long-term potentiation. J Neurosci. 1992;12:2685–2705. doi: 10.1523/JNEUROSCI.12-07-02685.1992. [DOI] [PMC free article] [PubMed] [Google Scholar]
- Hayashi Y, Shi SH, Esteban JA, Piccini A, Poncer JC, Malinow R. Driving AMPA receptors into synapses by LTP and CaMKII: requirement for GluR1 and PDZ domain interaction. Science. 2000;287:2262–2267. doi: 10.1126/science.287.5461.2262. [DOI] [PubMed] [Google Scholar]
- Holtmaat AJ, Trachtenberg JT, Wilbrecht L, Shepherd GM, Zhang X, Knott GW, Svoboda K. Transient and persistent dendritic spines in the neocortex in vivo. Neuron. 2005;45:279–291. doi: 10.1016/j.neuron.2005.01.003. [DOI] [PubMed] [Google Scholar]
- Hsia A, Masliah E, McConlogue L, Yu G, Tatsuno G, Hu K, Kholodenko D, Malenka R, Ricoll R, Mucke L. Plaque-independent Disruption of Neuroal Circuits in Alzheimer’s Disease Mouse Models. Proc Natl Acad Sci. 1999;96:3228–3233. doi: 10.1073/pnas.96.6.3228. [DOI] [PMC free article] [PubMed] [Google Scholar]
- Huang CC, You JL, Wu MY, Hsu KS. Rap1-induced p38 mitogen-activated protein kinase activation facilitates AMPA receptor trafficking via the GDI.Rab5 complex. Potential role in (S)-3,5-dihydroxyphenylglycene-induced long term depression. J Biol Chem. 2004;279:12286–12292. doi: 10.1074/jbc.M312868200. [DOI] [PubMed] [Google Scholar]
- Huber KM, Roder JC, Bear MF. Chemical induction of mGluR5- and protein synthesis--dependent long-term depression in hippocampal area CA1. J Neurophysiol. 2001;86:321–325. doi: 10.1152/jn.2001.86.1.321. [DOI] [PubMed] [Google Scholar]
- Isaac J, Nicoll R, Malenka R. Evidence for silent synapses: implication for the expression of LTP. Neuron. 1995;15:427–434. doi: 10.1016/0896-6273(95)90046-2. [DOI] [PubMed] [Google Scholar]
- Kamenetz F, Tomita T, Hsieh H, Seabrook G, Borchelt D, Iwatsubo T, Sisodia S, Malinow R. APP processing and synaptic function. Neuron. 2003;37:925–937. doi: 10.1016/s0896-6273(03)00124-7. [DOI] [PubMed] [Google Scholar]
- Kauer JA, Malenka R, Nicoll R. A persistent postsynaptic modification mediates long-term potentiation in the hippocampus. Neuron. 1988;1:911–917. doi: 10.1016/0896-6273(88)90148-1. [DOI] [PubMed] [Google Scholar]
- Kim CH, Chung HJ, Lee HK, Huganir RL. Interaction of the AMPA receptor subunit GluR2/3 with PDZ domains regulates hippocampal long-term depression. Proc Natl Acad Sci U S A. 2001a;98:11725–11730. doi: 10.1073/pnas.211132798. [DOI] [PMC free article] [PubMed] [Google Scholar]
- Kim JH, Anwyl R, Suh YH, Djamgoz MBA, Rowan MJ. Use-Dependent Effects of Amyloidogenic Fragments of beta-Amyloid Precursor Protein on Synaptic Plasticity in Rat Hippocampus In Vivo. Journal of Neuroscience. 2001b;21:1327–1333. doi: 10.1523/JNEUROSCI.21-04-01327.2001. [DOI] [PMC free article] [PubMed] [Google Scholar]
- Kobayashi DT, Chen KS. Behavioral phenotypes of amyloid-based genetically modified mouse models of Alzheimer’s disease. Genes Brain Behav. 2005;4:173–196. doi: 10.1111/j.1601-183X.2005.00124.x. [DOI] [PubMed] [Google Scholar]
- Kopec CD, Li B, Wei W, Boehm J, Malinow R. Glutamate receptor exocytosis and spine enlargement during chemically induced long-term potentiation. J Neurosci. 2006;26:2000–2009. doi: 10.1523/JNEUROSCI.3918-05.2006. [DOI] [PMC free article] [PubMed] [Google Scholar]
- Lanz TA, Carter DB, Merchant KM. Dendritic spine loss in the hippocampus of young PDAPP and Tg2576 mice and its prevention by the ApoE2 genotype. Neurobiol Dis. 2003;13:246–253. doi: 10.1016/s0969-9961(03)00079-2. [DOI] [PubMed] [Google Scholar]
- Larson J, Lynch G, Games D, Seubert P. Alterations in synaptic transmission and long-term potentiation in hippocampal slices from young and aged PDAPP mice. Brain Res. 1999;840:23–35. doi: 10.1016/s0006-8993(99)01698-4. [DOI] [PubMed] [Google Scholar]
- Lee SH, Liu L, Wang YT, Sheng M. Clathrin adaptor AP2 and NSF interact with overlapping sites of GluR2 and play distinct roles in AMPA receptor trafficking and hippocampal LTD. Neuron. 2002;36:661–674. doi: 10.1016/s0896-6273(02)01024-3. [DOI] [PubMed] [Google Scholar]
- Lee SH, Simonetta A, Sheng M. Subunit rules governing the sorting of internalized AMPA receptors in hippocampal neurons. Neuron. 2004;43:221–236. doi: 10.1016/j.neuron.2004.06.015. [DOI] [PubMed] [Google Scholar]
- Liao D, Hessler N, Malinow R. Activation of postsynaptically silent synapses during pairing-induced LTP in CA1 region of hippocampal slices. Nature. 1995;375:400–404. doi: 10.1038/375400a0. [DOI] [PubMed] [Google Scholar]
- Lin JW, Ju W, Foster K, Lee SH, Ahmadian G, Wyszynski M, Wang YT, Sheng M. Distinct molecular mechanisms and divergent endocytotic pathways of AMPA receptor internalization. Nat Neurosci. 2000;3:1282–1290. doi: 10.1038/81814. [DOI] [PubMed] [Google Scholar]
- Lue LF, Kuo YM, Roher AE, Brachova L, Shen Y, Sue L, Beach T, Kurth JH, Rydel RE, Rogers J. Soluble amyloid beta peptide concentration as a predictor of synaptic change in Alzheimer’s disease. Am J Pathol. 1999;155:853–862. doi: 10.1016/s0002-9440(10)65184-x. [DOI] [PMC free article] [PubMed] [Google Scholar]
- Luscher C, Xia H, Beattie EC, Carroll RC, von Zastrow M, Malenka RC, Nicoll RA. Role of AMPA receptor cycling in synaptic transmission and plasticity. Neuron. 1999;24:649–658. doi: 10.1016/s0896-6273(00)81119-8. [DOI] [PubMed] [Google Scholar]
- Luthi A, Chittajallu R, Duprat F, Palmer MJ, Benke TA, Kidd FL, Henley JM, Isaac JT, Collingridge GL. Hippocampal LTD expression involves a pool of AMPARs regulated by the NSF-GluR2 interaction. Neuron. 1999;24:389–399. doi: 10.1016/s0896-6273(00)80852-1. [DOI] [PubMed] [Google Scholar]
- Maletic-Savatic M, Malinow R, Svoboda K. Rapid dendritic morphogenesis in CA1 hippocampal dendrites induced by synaptic activity. Science. 1999;283:1923–1927. doi: 10.1126/science.283.5409.1923. [DOI] [PubMed] [Google Scholar]
- Man HY, Lin JW, Ju WH, Ahmadian G, Liu L, Becker LE, Sheng M, Wang YT. Regulation of AMPA receptor-mediated synaptic transmission by clathrin-dependent receptor internalization. Neuron. 2000;25:649–662. doi: 10.1016/s0896-6273(00)81067-3. [DOI] [PubMed] [Google Scholar]
- Masliah E, Mallory M, Alford M, DeTeresa R, Hansen LA, McKeel DW, Jr, Morris JC. Altered expression of synaptic proteins occurs early during progression of Alzheimer’s disease. Neurology. 2001;56:127–129. doi: 10.1212/wnl.56.1.127. [DOI] [PubMed] [Google Scholar]
- Miesenbock G, De Angelis DA, Rothman JE. Visualizing secretion and synaptic transmission with pH-sensitive green fluorescent proteins. Nature. 1998;394:192–195. doi: 10.1038/28190. [DOI] [PubMed] [Google Scholar]
- Moechars D, Dewachter I, Lorent K, Reverse D, Baekelandt V, Naidu A, Tesseur I, Spittaels K, Haute CV, Checler F, et al. Early phenotypic changes in transgenic mice that over-express different mutants of amyloid precursor protein in brain. J Biol Chem. 1999;274:6483–6492. doi: 10.1074/jbc.274.10.6483. [DOI] [PubMed] [Google Scholar]
- Moolman DL, Vitolo OV, Vonsattel JP, Shelanski ML. Dendrite and dendritic spine alterations in Alzheimer models. J Neurocytol. 2004;33:377–387. doi: 10.1023/B:NEUR.0000044197.83514.64. [DOI] [PubMed] [Google Scholar]
- Mucke L, Masliah E, Yu GQ, Mallory M, Rockenstein EM, Tatsuno G, Hu K, Kholodenko D, Johnson-Wood K, McConlogue L. High-level neuronal expression of abeta 1–42 in wild-type human amyloid protein precursor transgenic mice: synaptotoxicity without plaque formation. J Neurosci. 2000;20:4050–4058. doi: 10.1523/JNEUROSCI.20-11-04050.2000. [DOI] [PMC free article] [PubMed] [Google Scholar]
- Mulkey RM, Endo S, Shenolikar S, Malenka RC. Involvement of a calcineurin/inhibitor-1 phosphatase cascade in hippocampal long-term depression. Nature. 1994;369:486–488. doi: 10.1038/369486a0. [DOI] [PubMed] [Google Scholar]
- Mulkey RM, Malenka RC. Mechanisms underlying induction of homosynaptic long-term depression in area CA1 of the hippocampus. Neuron. 1992;9:967–975. doi: 10.1016/0896-6273(92)90248-c. [DOI] [PubMed] [Google Scholar]
- Nagerl UV, Eberhorn N, Cambridge SB, Bonhoeffer T. Bidirectional activity-dependent morphological plasticity in hippocampal neurons. Neuron. 2004;44:759–767. doi: 10.1016/j.neuron.2004.11.016. [DOI] [PubMed] [Google Scholar]
- Nimchinsky EA, Sabatini BL, Svoboda K. Structure and function of dendritic spines. Annu Rev Physiol. 2002;64:313–353. doi: 10.1146/annurev.physiol.64.081501.160008. [DOI] [PubMed] [Google Scholar]
- Nusser Z, Lujan R, Laube G, Roberts JD, Molnar E, Somogyi P. Cell type and pathway dependence of synaptic AMPA receptor number and variability in the hippocampus. Neuron. 1998;21:545–559. doi: 10.1016/s0896-6273(00)80565-6. [DOI] [PubMed] [Google Scholar]
- Oddo S, Caccamo A, Shepherd JD, Murphy MP, Golde TE, Kayed R, Metherate R, Mattson MP, Akbari Y, LaFerla FM. Triple-transgenic model of Alzheimer’s disease with plaques and tangles: intracellular Abeta and synaptic dysfunction. Neuron. 2003;39:409–421. doi: 10.1016/s0896-6273(03)00434-3. [DOI] [PubMed] [Google Scholar]
- Oliet SH, Malenka RC, Nicoll RA. Bidirectional control of quantal size by synaptic activity in the hippocampus. Science. 1996;271:1294–1297. doi: 10.1126/science.271.5253.1294. [DOI] [PubMed] [Google Scholar]
- Palmer MJ, Irving AJ, Seabrook GR, Jane DE, Collingridge GL. The group I mGlu receptor agonist DHPG induces a novel form of LTD in the CA1 region of the hippocampus. Neuropharmacology. 1997;36:1517–1532. doi: 10.1016/s0028-3908(97)00181-0. [DOI] [PubMed] [Google Scholar]
- Passafaro M, Nakagawa T, Sala C, Sheng M. Induction of dendritic spines by an extracellular domain of AMPA receptor subunit GluR2. Nature. 2003;424:677–681. doi: 10.1038/nature01781. [DOI] [PubMed] [Google Scholar]
- Passafaro M, Piech V, Sheng M. Subunit-specific temporal and spatial patterns of AMPA receptor exocytosis in hippocampal neurons. Nat Neurosci. 2001;4:917–926. doi: 10.1038/nn0901-917. [DOI] [PubMed] [Google Scholar]
- Rodrigues SM, Schafe GE, LeDoux JE. Molecular mechanisms underlying emotional learning and memory in the lateral amygdala. Neuron. 2004;44:75–91. doi: 10.1016/j.neuron.2004.09.014. [DOI] [PubMed] [Google Scholar]
- Roselli F, Tirard M, Lu J, Hutzler P, Lamberti P, Livrea P, Morabito M, Almeida OF. Soluble beta-amyloid1-40 induces NMDA-dependent degradation of postsynaptic density-95 at glutamatergic synapses. J Neurosci. 2005;25:11061–11070. doi: 10.1523/JNEUROSCI.3034-05.2005. [DOI] [PMC free article] [PubMed] [Google Scholar]
- Rumpel S, LeDoux J, Zador A, Malinow R. Postsynaptic receptor trafficking underlying a form of associative learning. Science. 2005;308:83–88. doi: 10.1126/science.1103944. [DOI] [PubMed] [Google Scholar]
- Rush AM, Wu J, Rowan MJ, Anwyl R. Group I metabotropic glutamate receptor (mGluR)-dependent long-term depression mediated via p38 mitogen-activated protein kinase is inhibited by previous high-frequency stimulation and activation of mGluRs and protein kinase C in the rat dentate gyrus in vitro. J Neurosci. 2002;22:6121–6128. doi: 10.1523/JNEUROSCI.22-14-06121.2002. [DOI] [PMC free article] [PubMed] [Google Scholar]
- Schnell E, Sizemore M, Karimzadegan S, Chen L, Bredt DS, Nicoll RA. Direct interactions between PSD-95 and stargazin control synaptic AMPA receptor number. Proc Natl Acad Sci U S A. 2002;99:13902–13907. doi: 10.1073/pnas.172511199. [DOI] [PMC free article] [PubMed] [Google Scholar]
- Seidenman KJ, Steinberg JP, Huganir R, Malinow R. Glutamate receptor subunit 2 Serine 880 phosphorylation modulates synaptic transmission and mediates plasticity in CA1 pyramidal cells. J Neurosci. 2003;23:9220–9228. doi: 10.1523/JNEUROSCI.23-27-09220.2003. [DOI] [PMC free article] [PubMed] [Google Scholar]
- Selig DK, Hjelmstad GO, Herron C, Nicoll RA, Malenka RC. Independent mechanisms for long-term depression of AMPA and NMDA responses. Neuron. 1995;15:417–426. doi: 10.1016/0896-6273(95)90045-4. [DOI] [PubMed] [Google Scholar]
- Selkoe DJ. Alzheimer’s disease is a synaptic failure. Science. 2002;298:789–791. doi: 10.1126/science.1074069. [DOI] [PubMed] [Google Scholar]
- Selkoe DJ, Schenk D. Alzheimer’s disease: molecular understanding predicts amyloid-based therapeutics. Annu Rev Pharmacol Toxicol. 2003;43:545–584. doi: 10.1146/annurev.pharmtox.43.100901.140248. [DOI] [PubMed] [Google Scholar]
- Sheng M, Kim MJ. Postsynaptic signaling and plasticity mechanisms. Science. 2002;298:776–780. doi: 10.1126/science.1075333. [DOI] [PubMed] [Google Scholar]
- Shi S, Hayashi Y, Esteban JA, Malinow R. Subunit-specific rules governing AMPA receptor trafficking to synapses in hippocampal pyramidal neurons. Cell. 2001;105:331–343. doi: 10.1016/s0092-8674(01)00321-x. [DOI] [PubMed] [Google Scholar]
- Small DH, Mok SS, Bornstein JC. Alzheimer’s disease and Abeta toxicity: from top to bottom. Nat Rev Neurosci. 2001;2:595–598. doi: 10.1038/35086072. [DOI] [PubMed] [Google Scholar]
- Snyder EM, Nong Y, Almeida CG, Paul S, Moran T, Choi EY, Nairn AC, Salter MW, Lombroso PJ, Gouras GK, Greengard P. Regulation of NMDA receptor trafficking by amyloid-beta. Nat Neurosci. 2005;8:1051–1058. doi: 10.1038/nn1503. [DOI] [PubMed] [Google Scholar]
- Snyder EM, Philpot BD, Huber KM, Dong X, Fallon JR, Bear MF. Internalization of ionotropic glutamate receptors in response to mGluR activation. Nat Neurosci. 2001;4:1079–1085. doi: 10.1038/nn746. [DOI] [PubMed] [Google Scholar]
- Spires TL, Meyer-Luehmann M, Stern EA, McLean PJ, Skoch J, Nguyen PT, Bacskai BJ, Hyman BT. Dendritic spine abnormalities in amyloid precursor protein transgenic mice demonstrated by gene transfer and intravital multiphoton microscopy. J Neurosci. 2005;25:7278–7287. doi: 10.1523/JNEUROSCI.1879-05.2005. [DOI] [PMC free article] [PubMed] [Google Scholar]
- Stern EA, Bacskai BJ, Hickey GA, Attenello FJ, Lombardo JA, Hyman BT. Cortical synaptic integration in vivo is disrupted by amyloid-beta plaques. J Neurosci. 2004;24:4535–4540. doi: 10.1523/JNEUROSCI.0462-04.2004. [DOI] [PMC free article] [PubMed] [Google Scholar]
- Stoppini L, Buchs PA, Muller D. A simple method for organotypic cultures of nervous tissue. J Neurosci Methods. 1991;37:173–182. doi: 10.1016/0165-0270(91)90128-m. [DOI] [PubMed] [Google Scholar]
- Takumi Y, Ramirez-Leon V, Laake P, Rinvik E, Ottersen OP. Different modes of expression of AMPA and NMDA receptors in hippocampal synapses. Nat Neurosci. 1999;2:618–624. doi: 10.1038/10172. [DOI] [PubMed] [Google Scholar]
- Terry RD, Masliah E, Salmon DP, Butters N, DeTeresa R, Hill R, Hansen LA, Katzman R. Physical basis of cognitive alterations in Alzheimer’s disease: synapse loss is the major correlate of cognitive impairment. Ann Neurol. 1991;30:572–580. doi: 10.1002/ana.410300410. [DOI] [PubMed] [Google Scholar]
- Thorns V, Mallory M, Hansen L, Masliah E. Alterations in glutamate receptor 2/3 subunits and amyloid precursor protein expression during the course of Alzheimer’s disease and Lewy body variant. Acta Neuropathol (Berl) 1997;94:539–548. doi: 10.1007/s004010050748. [DOI] [PubMed] [Google Scholar]
- Tomita T, Maruyama K, Saido TC, Kume H, Shinozake K, Tokuhiro S, Capell A, Walter J, Grunberg J, Hass C, Iwatsubo T. The presenilin 2 mutation (N141I) linked to familial Alzheimer disease (Volga German families) increases the secretion of amyloid beta protein ending at the 42nd (or 43rd) residue. Proc Natl Acad Sci. 1997;94:2025–2030. doi: 10.1073/pnas.94.5.2025. [DOI] [PMC free article] [PubMed] [Google Scholar]
- Tsai J, Grutzendler J, Duff K, Gan WB. Fibrillar amyloid deposition leads to local synaptic abnormalities and breakage of neuronal branches. Nat Neurosci. 2004;7:1181–1183. doi: 10.1038/nn1335. [DOI] [PubMed] [Google Scholar]
- Tyszkiewicz JP, Yan Z. beta-Amyloid peptides impair PKC-dependent functions of metabotropic glutamate receptors in prefrontal cortical neurons. J Neurophysiol. 2005;93:3102–3111. doi: 10.1152/jn.00939.2004. [DOI] [PubMed] [Google Scholar]
- Walsh DM, Klyubin I, Fadeeva JV, Cullen WK, Anwyl R, Wolfe MS, Rowan MJ, Selkoe DJ. Naturally secreted oligomers of amyloid beta protein potently inhibit hippocampal long-term potentiation in vivo. Nature. 2002;416:535–539. doi: 10.1038/416535a. [DOI] [PubMed] [Google Scholar]
- Wang Q, Walsh DM, Rowan MJ, Selkoe DJ, Anwyl R. Block of long-term potentiation by naturally secreted and synthetic amyloid beta-peptide in hippocampal slices is mediated via activation of the kinases c-Jun N-terminal kinase, cyclin-dependent kinase 5, and p38 mitogen-activated protein kinase as well as metabotropic glutamate receptor type 5. J Neurosci. 2004;24:3370–3378. doi: 10.1523/JNEUROSCI.1633-03.2004. [DOI] [PMC free article] [PubMed] [Google Scholar]
- Wasco W, Gurubhagavatula S, Paradis M, Romano D, Sisodia S, Human B, Neve R, Tanze R. Isolation and Characterization of APLP2 encoding a homologue of the Alzheimer’s Associated Amyloid Beta Protein Precursor. Nature Genetics. 1993;5:95–100. doi: 10.1038/ng0993-95. [DOI] [PubMed] [Google Scholar]
- Whitmarsh AJ, Yang SH, Su MS, Sharrocks AD, Davis RJ. Role of p38 and JNK mitogen-activated protein kinases in the activation of ternary complex factors. Mol Cell Biol. 1997;17:2360–2371. doi: 10.1128/mcb.17.5.2360. [DOI] [PMC free article] [PubMed] [Google Scholar]
- Xia J, Chung HJ, Wihler C, Huganir RL, Linden DJ. Cerebellar long-term depression requires PKC-regulated interactions between GluR2/3 and PDZ domain-containing proteins [In Process Citation] Neuron. 2000;28:499–510. doi: 10.1016/s0896-6273(00)00128-8. [DOI] [PubMed] [Google Scholar]
- Xiao MY, Zhou Q, Nicoll RA. Metabotropic glutamate receptor activation causes a rapid redistribution of AMPA receptors. Neuropharmacology. 2001;41:664–671. doi: 10.1016/s0028-3908(01)00134-4. [DOI] [PubMed] [Google Scholar]
- Yuste R, Bonhoeffer T. Morphological changes in dendritic spines associated with long-term synaptic plasticity. Annu Rev Neurosci. 2001;24:1071–1089. doi: 10.1146/annurev.neuro.24.1.1071. [DOI] [PubMed] [Google Scholar]
- Zamanillo D, Sprengel R, Hvalby O, Jensen V, Burnashev N, Rozov A, Kaiser KM, Koster HJ, Borchardt T, Worley P, et al. Importance of AMPA receptors for hippocampal synaptic plasticity but not for spatial learning. Science. 1999;284:1805–1811. doi: 10.1126/science.284.5421.1805. [DOI] [PubMed] [Google Scholar]
- Zhou Q, Homma KJ, Poo MM. Shrinkage of dendritic spines associated with long-term depression of hippocampal synapses. Neuron. 2004;44:749–757. doi: 10.1016/j.neuron.2004.11.011. [DOI] [PubMed] [Google Scholar]
- Zhu JJ, Qin Y, Zhao M, Van Aelst L, Malinow R. Ras and Rap control AMPA receptor trafficking during synaptic plasticity. Cell. 2002;110:443–455. doi: 10.1016/s0092-8674(02)00897-8. [DOI] [PubMed] [Google Scholar]
- Zuo Y, Lin A, Chang P, Gan WB. Development of long-term dendritic spine stability in diverse regions of cerebral cortex. Neuron. 2005;46:181–189. doi: 10.1016/j.neuron.2005.04.001. [DOI] [PubMed] [Google Scholar]
Associated Data
This section collects any data citations, data availability statements, or supplementary materials included in this article.
Supplementary Materials
Supplemental Figure 1. (A) Over-expression of EGFP, APP IRES EGFP or APP(MV) IRES EGFP with Sindbis virus does not significantly affect endogenous GluR2 levels. Neurons infected with Sindbis virus are labeled with anti-GluR2 antibody on the left; the quantification is shown on the right (values normalized to signal of non-infected cells: EGFP: non-infect: 1.0±0.04, n=17, infect: 0.89±0.09, n=10, p=0.2, APP IRES EGFP: non-infect: 1.0±0.04, n=30, infect: 1.06±0.05 , n=11, p=0.4, APP(MV) IRES EGFP: non-infect: 1.0±0.03, n=26, infect: 1.07±0.06, n=17, p=0.25).
(B) Over-expression of EGFP, APP IRES EGFP or APP(MV) IRES EGFP with Sindbis virus does not significantly affect endogenous GluR1 levels. Neurons infected with Sindbis virus are labeled with anti-GluR1 antibody on the left; the quantification is shown on the right (values normalized to signal of non-infected cells: EGFP: 1.0±0.04, n=20, infect: 1.0±0.05, n=12, p=0.98, APP IRES EGFP: non-infect: 1.0±0.02, n=14, infect: 1.14±0.10 , n=10 , p=0.09, APP(MV) IRES EGFP: non-infect: 1.0±0.03, n=15, infect: 1.08±0.05, n=12, p=0.17).
(C) There are no significant differences in the average absolute SEP-GluR2 signal at the soma (Gmax) between cells expressing SEP-GluR2 alone or with APP or APP(MV) (Fluorescence in arbitrary units: SEP-GluR2: 6357 ± 727, 4 cells, 16 boxes; APP/SEP-GluR2: 9081±1587 , 5 cells, 40 boxes, APP(MV)/SEP-GluR2: 7724.7±1814 , 5 cells, 40 boxes)
(D) There are no significant differences in the average absolute SEP-GluR1 signal at the soma (Gmax) between cells expressing SEP-GluR1 alone or with APP or APP(MV) (Fluorescence in arbitrary units: SEP-GluR1: 11978±1107 , 4 cells, 32 boxes; APP/SEP-GluR1: 15415±2367, 5 cells, 40 boxes; APP(MV)/SEP-GluR1:11145 ±490 , 5 cells, 40 boxes)
(E) SEP-GluR2 signal (green) in spines is not correlated with SEP-GluR2 signal (Gmax) at the cell soma. The SEP-GluR2 spine data of all 14 cells analyzed (SEP-GluR2 only, APP/SEP-GluR2 and APP(MV)/SEP-GluR2) are combined and analyzed as a group, where each point represents a cell (Pearson R value: 0.213, p=0.465).
(F) tDimer signal (red) in spines of cells co-expressing SEP-GluR2 is correlated with tDimer signal (Rmax) at the cell soma. The tDimer spine data of all 14 cells analyzed are combined and analyzed as a group (Pearson R value: 0.686, p<0.01).
(G) SEP-GluR1 signal (green) in spines is not correlated with SEP-GluR1 signal (Gmax) at the cell soma. The SEP-GluR2 spine data of all 14 cells analyzed (SEP-GluR1 only, APP/SEP-GluR1 and APP(MV)/SEP-GluR1) are combined and analyzed as a group, where each point represents a cell (Pearson R value: 0.112, p=0.703).
(H) tDimer signal (red) in spines of cells co-expressing SEP-GluR1 is correlated with tDimer signal (Rmax) at the cell soma. The tDimer spine data of all 14 cells analyzed are combined and analyzed as a group (Pearson R value: 0.865, p<0.01).
Supplemental Figure 2. Aβ-induced phosphorylation of GluR2-S880 Increase in the phosphorylation of GluR2-S880 after Aβ application (2 μM) in dissociated cortical cultures in comparison to vehicle treated cultures. (normalized vehicle: 1.0±0.06; Aβ: 1.26±0.07; n=6; p<0.05).