

Abstract
Assessment of optic disk size is an important, but often overlooked, component of the diagnostic evaluation for glaucoma. Measured values of optic disk size vary with the measurement technique utilized. Available methods for disk size measurement and their respective strengths and limitations will be discussed. Further, actual disk size varies with race and possibly other demographic characteristics. Disk size is also associated with variation of specific anatomical structures of the optic nerve head and the retinal nerve fiber layer. These disk size-dependent variations may influence the susceptibility to glaucoma or the likelihood of glaucoma diagnosis. This manuscript reviews the published evidence relating to disk size and glaucoma.
Keywords: demographics, disk morphology, glaucoma, measurement techniques, optic disk size
I. Introduction
Detection of characteristic glaucomatous optic disk damage involves the measurement of the size and shape of the neuroretinal rim and optic cup. Assessment of optic disk size is an important component of optic nerve examination as the size of the neuroretinal rim and the optic cup vary with disk size. 13,60,75,127 Several factors make the determination of whether disk size is an independent risk factor for glaucoma susceptibility difficult. First, measurement techniques can provide different estimates of disk size, limiting comparison among studies. 2, 4, 8, 9, 13, 19, 31, 42, 91, 102, 103, 122, 156, 158, 167, 168, 182 Second, there is a large variation in disk size within a population and also among populations. 11, 72, 86, 93, 100, 103, 106, 125, 126, 128, 146, 154 Third, disk size itself may influence the likelihood that a clinician makes a diagnosis of glaucoma, thus providing a potential source of bias. 8,37 It is often easier to detect a glaucomatous appearing optic nerve head if the disk is large compared to one that is small. If disk size is in fact an independent risk factor for the development of glaucoma, it is relevant to consider the anatomical features that are responsible for the increased susceptibility.
This review addresses the impact of measurement technique and population characteristics on reported optic disk size. In addition, the influence of disk size on the appearance of the optic disk and nerve fiber layer and how this may relate to glaucoma susceptibility is discussed.
II. Techniques for Measuring Disk Size
The estimate of optic disk size is dependent on the instrument and method used for measurement. 1, 2, 4, 5, 13, 17, 52, 58, 102, 122, 131, 137, 138, 165, 167, 171, 182 Systematic measurement error may occur depending on the instrument and technique used. The size of an optic disk image is dependent on instrument magnification and the magnification properties of the eye. Corneal curvature, axial length, and ametropia may all affect the latter. Direct measurement of the optic disc size is only possible during vitreoretinal surgery or histologically. 52 Therefore, several correction factors have been developed to correct for the camera magnification and eye magnification error. 5,16,122,123 The advantages and limitations of each method are shown in Table 1 and are outlined below.
Table 1.
Advantages and Limitations of different measurement methods
| Method | Application | Magnification correction required? | Pupil Dilation required? | Subjective identification of disk margin? | Rapid? | Other limitations | Author |
|---|---|---|---|---|---|---|---|
| Histomorphometry | Research | No | - | - | No | Post mortem change in tissue, special equipment required | Jonas, 100,103, Quigley, 149 |
| Biomicroscopy | Clinical/Research | Yes | Yes | Yes | Yes | Subjective, measurements vary with the fundus lens used | Akman, 2 Ansari, 4 Lichter, 120 Lim, 121 Montgomery, 137,138 Ruben, 158 |
| Planimetry | Research | Yes | Yes | Yes | No | Subjective | Jonas, 72, 74, 80, 82, 91, 96 Miller, 134 Mitchell, 136 Peigne, 147 Varma, 179 Garway-Heath 52 |
| Computerized Planimetry | Research | Yes | Yes | Yes | No | Britton, 10 Bottoni, 20, 167 Garway-Heath 49 Tomita 176 Tuulonen 178 | |
| Confocal Scanning Laser Ophthalmoscopy (CSLO) | Clinical/Research | Yes | No | Yes | Yes | Measurements based on reference plane | Agarwal, 1 Bathija, 10 Bowd, 21 Burk, 28,29 Hoffmann, 65 Iester, 70,71 Kiriyama, 112 Medeiros, 130 Spencer, 167 Weinreb, 183 Zangwill, 189,191 Wollstein 184 |
| Optical Coherence Tomography (OCT) | Clinical/Research | Yes | No/Yes | No | Yes | Interpolation between scans | Hoffmann, 65 Medeiros, 130 Schuman, 162,163,164 Wollstein 185 |
ILM: Inner limiting membrane, RPE: retinal pigment epithelium
A. HISTOMORPHOMETRY
Histomorphometry of histological preparations is an invaluable research tool for assessing structural features of the optic disk. This type of evaluation is complicated, time-consuming, expensive, and has been performed only by a few researchers. 94, 100, 149, 150, 188 Disk size estimates are dependent on the histological techniques used, and results may differ amongst different research groups. Mean disk size measurements using histomorphometric techniques in normal eyes range from 2.57 mm2 to 2.81 mm2. 142, 149, 152 Further limitations are the cost and availability of eyes, the changes in the tissue postmortem, the fixation method, and the specialized equipment required. The major advantage of this direct measurement method is its independence from magnification correction error.
B. SLIT-LAMP BIOMICROSCOPY
Slit-lamp biomicroscopy is an easy, rapid, and inexpensive method for estimating the size of the optic disk. 2, 4, 158, 168 Using this measurement technique, the average disk area and vertical disk diameter are easily estimated using different handheld high power convex lenses (e.g., +60 D, +78 D, Superfield NC, or +90 D) and an adjustable vertical beam height on the slit-lamp. The development of several lens-specific correction factors allows estimation of the size of the optic disk. 52,102 Slit-lamp biomicroscopic measurements of the optic disk show an acceptable intra- and interobserver variability (coefficient of variation using a 78-D lens: 2.45 %, interobserver differences in mean disk diameter measurements using a 60-D lens: − 0.04 mm). 58,168 Examination of the optic disk without pupil dilation reads to significantly poorer interobserver agreement compared to dilated pupils (Vertical disk diameter measurement: 95% limits of agreement 0.2404 without dilation and 0.1607 with dilation, P=0.0125).113
A limitation of using indirect lenses is that the distance from the lens to the eye may vary and influence the accuracy of the magnification correction, particularly in the presence of a high refractive error. In addition, Ansari and colleagues 4 showed that a single magnification correction factor for each lens is not appropriate. The reason for this inaccuracy is that under myopic conditions, fundus lenses underestimate the true size of the examined object, while hyperopia leads to an overestimation.4,5 Therefore, Ansari and colleagues calculated individual fundus lens correction factors p (°/mm) for several fundus lenses. The total change in magnification over a range of ametropia (−12.5 D to + 12.6 D) was highest for the +60-D fundus lens, compared to the +78-D, + 66-D stereo fundus lens, +90-D, and Superfield NC lens (Table 2). High-magnification minimizes the depth of the field and should reduce errors in the measurement.
Table 2.
Correction factors p determined by Ansari and colleagues 4,5 for high power funduscopy lenses and change in total magnification over a wide range of ametropia
| Lens | Volk +60 D | Volk +78 D | Volk +90 D | Volk Superfield NC | Volk +66 D Stereo |
|---|---|---|---|---|---|
| Correction factor p | 3.04 (0.04)* | 3.69 (0.06)** | 4.64 (0.02)** | 4.61 (0.03)** | 3.56 (0.06)** |
| Total magnification change from myopia (− 12.5 D) to hyperopia (+12.6 D) | −21.1% to +24.0% | −13.2% to +13.9% | −15.1% to +13.7% | −13.3% to +14.0% | −12.9% to +16.2% |
Correction factor constant over a range of refraction from −12.5 D to + 12.6 D
Correction factor constant over a range of refraction from −5 D to + 5 D
Values are given in mean (SD)
C. PLANIMETRY
Planimetry provides quantitative optic disk measurements by plotting disk stereophotographs on paper and measuring them manually or with the help of computerized techniques. 29, 30, 32, 156, 169, 171 Both, Jonas 102 and the investigators of the Blue Mountains Eye Study 136 demonstrated good inter- and intra-observer agreement for experienced observers using planimetry (Interobserver intraclass correlation coefficient was reported to be 0.91 for disk area measurements in the Blue Mountains Study). Mean disk area measurements in the normal white population using planimetry range from 1.70 mm2 to 2.89 mm2.49,59,88
There are several limitations to the use of planimetry for measuring disk size. It is a time-consuming technique, and also depends upon the subjective judgment of the edge of the optic disk. In general, the use of refraction to correct for magnification is less accurate than the use of axial length and can lead to biased estimates of disk size. 52 Using spherical error as the correction factor may underestimate the size of the disk in large eyes and overestimate the size of the disk in small eyes. 52
D. IMAGING
Confocal scanning laser ophthalmoscopy (CSLO) provides rapid, objective and highly reproducible measurements of optic disk size. The average disk area measured with CSLO in normal Caucasian subjects ranges from 1.74 mm2 to 2.47 mm2. 21, 70, 96, 177, 184 The Heidelberg Retina Tomograph (HRT, Heidelberg Engineering, Heidelberg, Germany) employs a 670 nm diode laser to sequentially scan the retinal surface in the x and y directions at multiple focal planes. Using confocal scanning principles, a three-dimensional topographic image is constructed from a series of optical image sections at consecutive focal planes. 115 With the current version of the HRT II software (version 1.7.0.2) an operator outlines the optic disk margin, and topographic measurements, including disk area are calculated automatically. The recently released software (software version 3.0) includes the provision of topographic measurements that does not require the outlining of the disk margin. Magnification is corrected using keratometry and refraction. Advantages of CSLO imaging include the reduced need for dilated pupils and clear media, and the automated analyses available. The images are acquired rapidly and easily. Limitations include the reliance on an operator to define the optic disk margin and for some topographic optic disk parameters a reference plane to identify the plane of measurement.
The optical coherence tomograph (Stratus OCT, Carl Zeiss Meditec, Dublin, California) also has been used to assess optic disk topography in clinical practice. This instrument provides in-vivo cross sectional scans of retinal structures by the use of low-coherence interferometry. 68, 130, 162, 163 The optic nerve head scan consists of six radial scans in a spoke like pattern centered on the optic nerve head. The OCT interpolates between the scans to provide measurements throughout the optic nerve head. OCT provides an automated demarcation of the disk margin as the end of the retinal pigment epithelium/choriocapillaris layer. The demarcation can be manually adjusted in cases where the software does not appropriately determine the border of the retinal pigment epithelium. The average disk area measurement in the normal white population using the OCT ranges from 2.10 mm 2 – 2.35 mm 2. 130, 164, 185 The OCT has further been shown to provide reproducible assessment of optic disk topography and retinal nerve fiber layer. 162,163 The transverse scan size (circle diameter or line length) displayed for StratusOCT is determined assuming zero refractive correction and average axial eye length. If these conditions are not true for the eye being scanned, the scan size at the retina will be different than the value shown. StratusOCT does not adjust scan size to compensate for refractive error or axial length. The normative data limits for retinal and RNFL thickness reflects the range of refractive corrections and axial lengths for the population used to determine these limits (personal communication Thomas Will, Carl Zeiss Meditec, Jena, Germany, January 2006). Advantages of the OCT include the automated determination of the disk margin and the automated analysis of topographic parameters and retinal nerve fiber layer thickness. Limitations include the need to interpolate between six radial scans to obtain topographic measurements, the need for pupil dilation in some eyes and to adjust the automated disk margin in selected eyes. In addition, for some subjects pupil dilation is necessary to obtain good quality scans.
E. COMPARISON OF DISK AREA ESTIMATES USING DIFFERENT MEASUREMENT TECHNIQUES
Although disk area measurements obtained using various techniques are generally strongly correlated, the absolute disk size measurement may differ considerably. Larger disk size estimates have been reported using planimetry compared to a Goldmann three-mirror contact lens (Horizontal mean disk diameter 1.77 mm ± 0.24 mm vs. vs. 1.39 mm ± 0.22 mm). 102,168 However, using a +90 D fundus lens, Ruben and colleagues found good agreement between planimetry and biomicroscopic disk size estimates. 158 Jonas and associates found that planimetric measurements of disk size were larger compared to CSLO measurements in a mixed group (n = 432) of healthy subjects, patients with ocular hypertension and glaucoma patients. (Planimetry: 2.79 mm 2 ± 0.66 mm 2 vs. CSLO 2.56 mm 2 ± 0.63 mm 2).96 These discrepancies may be due to differences in the correction of the image magnification, 5, 16, 17, 52, 123 misalignment between patient and fundus camera or CSLO, 6,143,145 and a different outlining of the optic disk boundaries. 144,170 In contrast, Garway-Heath et al reported no difference in optic disk size estimates between planimetric and CSLO measurements in healthy subjects (Planimetry: 1.97 mm 2 ± 0.36 mm 2 vs. CSLO: 1.98 mm 2 ± 0.35 mm 2, n = 88). 53 Correlation between disk size estimates using the CLSO and +60-D, +78-D, and +90-D fundoscopy lenses is reported to be moderate to good (correlation coefficients range from 0.59–0.80). 121 OCT topographic optic disk measurements are well correlated with CSLO measurements. 66,130,164 However, in one study OCT measurements of disk area tend to be larger than that of the CSLO (2.15 mm 2 ± 0.36 mm 2 vs. 1.85 mm 2 ± 0.30 mm 2, normal subjects). 164 Another study found no statistically significant difference between the CSLO and Stratus OCT disk area measurements. 66
F. SUMMARY OF MEASUREMENT TECHNIQUE
Various techniques are available for estimating optic disk size. Each has specific strengths and limitations when applied to certain types of clinical and research objectives. Some of the measurement techniques are more applicable to clinical practice than others. The levels of skill required to obtain good quality information can vary by technique. It is important to understand that these various techniques provide different estimates of disk size, which should be taken into consideration when comparing disk size measurements among different patient populations.
III. Patient Factors That Influence Disk Size
A. RACE
1. Race and Disk Size
African-Americans have larger disks than individuals from other races. However, using a variety of methods, estimates of the mean disk area in African-Americans range from 2.14 mm 2 to 3.75 mm 2,125, 181 compared with 1.73 mm 2 to 2.63 mm 2 in Caucasians, 35,51,54,55,110,125,177,181,191 and 2.46 mm 2 to 2.67 mm 2 in Hispanics, 177 and 2.47 mm 2 to 3.22 mm 2 in Asians 125 (Table 3). Larger optic disks in African-Americans have also been shown in normal, 35 54, 55, 125, 126, 191 post-mortem, 149 and glaucomatous 54,128 eyes, including evidence from population-based studies. 181 Population-based studies provide non-selected samples and have larger numbers of participants. Therefore, the possibility of selection bias is reduced, providing more representative and robust estimates of disk size in the population.
Table 3.
Race and Disk Size
| Author | Subjects (n) | Race | Diagnostic Groups | Design | Parameter | Method | Correction | Results |
|---|---|---|---|---|---|---|---|---|
| Chi 1989 35 | N (61) | Black (30)
White (31) |
Normals | Cross-Sectional Cohort study | MDA | Rodenstock Optic Disk Analyzer | N/A | MDA Blacks 2.15 (0.056) vs. Whites 1.73 (0.061), p<0.0001 |
| Zangwill 2004 191 | OHT (451) | White (337)
Black (75) Hispanic (25) |
OHT | Other OHTS Ancillary Study | MDA | HRT I | Keratometry and ametropia | MDA Blacks 2.17 (0.41) vs Whites 1.87 (0.38), P<0.001 |
| Mansour 1992 126 | N(66) Children | Black (30)
White (36) |
Normals | Cross-sectional | MDA | Stereophotographs | N/A | MDA Blacks 3.08 (0.55) vs. Whites 2.66 (0.54), P<0.002 |
| Varma 1994 181 | N (4877) | Black (1534)
White (1853) |
Normals | Population-based study | MDA | Topcon Optic Disk Analyzer | Littmann | MDA Blacks 2.94 (0.74) vs. Whites 2.63 (0.46), P =0.0001 |
| Tsai 1995 177 | N(132) | Black (43)
White (44) Asian (45) |
Normals | Cross-sectional | MDA | HRT I | Keratometry and ametropia | MDA Blacks 2.67 (0.44) vs. Whites 2.40 (0.28)
p=0.011 |
| Mansour 1991 125 | N (125) | White (51)
Black (21) Hispanic (24) Indian (15) Oriental (14) |
Normals | Cross-sectional | MDA | Stereophotographs | Littmann | MDA Blacks 3.33 (0.12) vs. Whites 2.66 (0.11)
P N/A |
| Girkin 2003 54 | N (150) | White (68)
Black (84) |
Normals | Cross-Sectional Cohort study | MDA | HRT II | Keratometry and ametropia | MDA Blacks 2.26 (0.45) vs. Whites 1.98 |
| Girkin 2003 54 | N (149) | White (63)
Blacks (86) |
Glaucoma | Cross-Sectional Cohort study | MDA | HRT II | Keratometry and ametropia | MDA Blacks 2.45 (0.60) vs. Whites 2.24 (0.40)
P N/A |
| Girkin 2005 55 | N (126) | Black (73)
White (53) |
Normals | Cross-Sectional Cohort study | MDA | HRT II | Keratometry and ametropia | MDA Blacks right eye 2.14 (0.05) vs. Whites 1.96 (0.06)
P=0.01 MDA Blacks left eye 2.18 (0.05) vs. Whites 2.02 (0.06) P=0.04 |
MDA (SD): Mean disk area, OHT: Ocular Hypertension, N: Normal, N/A.: not available, NS: not significant, Correction: Magnification Correction
From the Confocal Scanning Laser Ophthalmoscopy Ancillary Study to the Ocular Hypertension Treatment Study (OHTS), Zangwill and colleagues 191 found that African-Americans have significantly larger optic disks (2.17 mm 2 ± 0.41 mm 2) than other racial groups (1.87 mm 2 ± 0.38 mm 2). African-Americans further had larger cup area and larger neuroretinal rim area than the other participants. However, after adjusting for optic disk area, these differences between the African-American race and other racial groups were no longer statistically significant. Therefore, differences in topographic parameters between the African-American race and other groups can be largely explained by larger optic disk areas in the African-American population. This study emphasizes the importance of considering disk size when assessing the neuroretinal rim and optic cup in glaucoma management decisions. 37, 51, 61, 75, 110
2. Race, Disk Size, and Glaucoma Susceptibility
The high prevalence of glaucoma in individuals of certain African and African-Carribean populations (2.8% 157 to 8.8% 129) combined with the presence of larger optic disks compared to the Caucasian population 35, 55, 125, 126, 153, 181 has led to the hypothesis that large optic disks might be more prone to glaucomatous damage than small disks. 28 The Confocal Scanning Laser Ophthalmoscopy Ancillary Study to the OHTS evaluated the hypothesis that large disks may be an important predictor of POAG in OHTS participants. However, disk size was not associated with the development of POAG in OHTS participants. 190 Jonas also reported that susceptibility to glaucoma was independent of disk size in white patients. 83
Recent evidence from the OHTS further suggests that the increased risk conferred by African-American race may be accounted for by other variables measured in the study. Higginbotham and colleagues 64 reported that after adjusting for baseline cup/disk ratio, age, sex, central corneal thickness, systemic diseases, and IOP in the OHTS, African-American race was not associated with a statistically significant increased risk of developing POAG when applying multivariate statistics. 56,64 It is likely therefore, that various factors may explain the higher rates of glaucoma in African-Americans. These may include genetic susceptibility to POAG, 45 higher prevalence of comorbidity, such as cardiovascular disease, diabetes and systemic hypertension, 63,108,173 or thin corneas. 62,116,141
B. SEX
1. Sex and Disk Size
Several studies have evaluated the influence of gender on optic disk size (Table 4). 1,21,181,192 Using the CSLO, Bowd and colleagues demonstrated that optic disk area did not differ significantly between males and females (P > 0.05).21 This was supported by several other studies that measured disk size using confocal scanning laser opthalmoscopes. 1,42,109
Table 4.
Sex and Disk Size
| Females | Males | |||||
|---|---|---|---|---|---|---|
| Author | Method of measurement | Subjects (n) | Disk area mm 2 (SD) | Subjects (n) | Disk area mm 2 (SD) | Statistical significance |
| Baltimore Eye Survey, Varma 1994 181 | Topcon Image Analyzer | 1992 (white) | 2.60 (0.47)* | 1483 (white) | 2.66 (0.55)* | Yes (p<0.03) |
| Baltimore Eye Survey, Varma 1994 181 | Topcon Image Analyzer | 854 (black) | 2.91 (0.61)* | 1049 (black) | 3.00 (0.57)* | Yes (p<0.005) |
| Britton 1987 22 | computerized planimetry | 69 | 2.10 (0.5), m+f | 44 | 2.10 (0.5), m+f | No (p > 0.05) |
| Mansour 1991 125 | Zeiss Funduscamera | 57 | 2.89 (0.56) | 68 | 3.09 (0.57) | Yes (p<0.04) |
| Mansour 1992 126 | Zeiss Funduscamera | 18 (white) | 2.57 (0.49) | 18 (white) | 2.74 (0.59) | No (p>0.05) |
| Mansour 1992 126 | Zeiss Funduscamera | 16 (black) | 3.05 (0.54) | 14 (black) | 3.11 (0.56) | No (p>0.05) |
| Miglior 1994 132 | computer-aided morphometry | 144 | 2.43 (0.55) | 91 | 2.58 (0.59) | Yes (p<0.05) |
| Kashiwagi 2000 109 | Confocal Scanning Laser Tomogaph (TopSS) | 48 | 2.63 (0.48) | 44 | 2.75 (0.47) | No (p >0.2) |
| OHTS Zangwill 2004 191 | HRT I | 260 | 1.90 (0.39) | 191 | 1.96 (0.41) | No (p=.127) |
| Durukan 2004 42 | HRT II | 298 | 2.12 (0.41) | 245 | 2.11 (0.43) | No (p=0,58) |
| Bowd 2002 21 | HRT I | 93 | 1.80 (0.36) | 45 | 1.78 (0.38) | No (p=0.74) |
The standard deviation was not provided in the study by Varma, therefore, we adopted the calculation from Meyer and colleagues 131
M+F: male and female, HRT: Heidelberg Retina Tomograph
In studies that have reported differences in disk size between genders, the differences were small. Population-based studies with a large number of subjects, such as the Baltimore Eye Survey 153,181 tended to report significantly larger disks in males compared to females. The Baltimore Eye Survey 181 examined a population-based sample of black and white Americans in their race, age-, sex-, and refractive error related differences in optic disk topography using the Topcon Image Analyzer. This survey found significantly larger disk areas in male compared to female subjects. Despite the statistically significant sex differences, the difference was not very large [mean disk area (95% CI) Caucasian females vs. Caucasian males: 2.60 mm 2 (2.57–2.63 mm 2) vs. 2.66 mm 2 (2.62–2.70 mm 2), respectively].
2. Sex and Glaucoma Susceptibility
Reports on the role of sex as a risk factor for glaucoma, are inconclusive. The Blue Mountains Eye Study, 136 the Baltimore Eye Survey, the Beaver Dam Eye Study 114 and the Los Angeles Latino Eye Study 180 found no association between sex and the prevalence of glaucoma. However, the Barbados Eye Study 69,118 reported a higher prevalence of glaucoma in men (13.3%) than women (8.5%) and reported that male sex was a risk factor for glaucoma in their predominantly black study population. In contrast, the Blue Mountains Eye Study reported a higher prevalence of glaucoma in women in each age group, with a borderline significance after adjusting for age (odds ratio 1.55; CI 1.03–2.32) using logistic regression.
Although there might be small differences in disk size between females and males, no studies have directly evaluated whether sex and disk size influences the susceptibility of glaucoma.
C. AGE
1. Age and Disk Size
Age does not appear to be associated with disk size in humans. 1, 21, 22, 53, 99, 110, 181 This evidence is supported by population-based studies including the Baltimore Eye Survey, 181 the Rotterdam Study, 155 and the Reykjavik Eye Study.43 In the Baltimore Eye Survey, a moderate to high percentage of older subjects was excluded due to poor quality stereophotographs or unreliable analyses. The following percentages (according to five age groups) were excluded: 40–49 years: 15.6%, 50–59 years: 21.0%, 60–69 years: 29.9%, 70–79 years: 48.5%, and 80+ years: 78.9%. Therefore, the results of the relationship between age and disk size have to be interpreted with caution. One cross-sectional population-based study from Bengtsson and colleagues 14 found a small increase in optic disk diameter with age in a population of 1,287 subjects in Sweden. However, the increase in disk diameter of approximately 0.001 mm per year was very small. Others suggested that the slight increase in disk size with age might be artefactual 7 and related to the method used for magnification correction. 53 Histological evaluations by Cavallotti 33,34 also found an age-related increase in optic disk size in the rat and human optic nerve head, respectively. However, one has to bear in mind that cross-sectional studies are susceptible to cohort effects. Therefore, longitudinal studies are needed to investigate aging effects on disk size.
2. Age and Glaucoma Susceptibility
There is, however, a strong relationship between increasing age and glaucoma. The prevalence of glaucoma does increase with age from about 1% at the age of 50 years to about 4% at the age of 80 years. 114 The age-specific prevalence rates are comparable in the large population–based studies, ranging from 1.2 % to 1.4% in subjects under 65 years old 107,114,136 to 2.0% to 8.7% in subjects of 70 – 85 years old. 39, 107, 114, 136, 174 No evidence for a relationship between age, disk size and glaucoma susceptibility has been reported yet.
D. MYOPIA
1. Myopia, Disk size, and Glaucoma Susceptibility
Myopic eyes may show larger and more elongated optic disks than emmetropic eyes, especially eyes with high myopia > −8D. 1,92 However, in a range of −5D to +5D of refractive error, optic disk size is not associated with refractive error. 76, 104, 159 The enlargement of the optic disk size is explained, in part, by a stretching of the disk and therefore, a deformation of the lamina cribrosa. One might hypothesize that the deformation of the lamina cribrosa in highly myopic eyes is similar to alterations and thinning of the lamina cribrosa in glaucoma. 94,152 How this deformation in myopic eyes influences the risk for developing glaucoma is still unclear, although Jonas and associates 78 suggested higher glaucoma susceptibility in highly myopic eyes (−8 D) with large optic disks compared to non-highly myopic eyes. Population – based studies including the Blue Mountains Eye Study 135 and the Barbados Eye Study 186 found a strong relationship between myopia and glaucoma. The Blue Mountains Eye Study reported prevalences that ranged from 1.5% in emmetropes to 4.4% in moderate to high myopes. 135 The Barbados Eye Study found that myopia (worse than −5 diopters) increased the odds of having glaucoma while hyperopia reduces the odds of having glaucoma (1.48 (1.12, 1.95, 95% CI versus 0.52 (0.41, 0.67, 95% CI) in black participants. Hospital-based studies, which are subject to selection bias, report results for 57,118,135 and against 81,98,151 an increased prevalence of glaucoma in myopic patients.
E. NORMAL-TENSION GLAUCOMA
1. Normal-tension Glaucoma and Disk Size
Many attempts have been made to investigate possible differences in optic disk size in subjects with Normal Tension Glaucoma (NTG), POAG and in non glaucomatous eyes. 28, 176, 178, 187 The size of the optic nerve head has been reported to be either similar 44, 71, 77, 134, 140 or larger 28, 72, 112, 178 in patients with NTG compared to POAG (Table 5). Although there may be different patterns of optic disk cupping and disk size in NTG, there is wide variability of the definition of NTG. 46, 117, 119, 175 More than a century ago, Donders 40 already proposed that all cases of NTG are misclassified POAG. The reason for the misclassification was reported to be a failure to detect the abnormal intraocular pressure peaks. Some studies define NTG based on some degree of diurnal IOP testing while others do not. It is possible that many cases of apparent NTG (in non-Japanese individuals) are misclassified POAG, because the existence of abnormal high intraocular pressure peaks was not ruled out with certainty in these NTG patients.
Table 5.
Comparison of glaucoma types and optic disk size measured by different methods
| Author | Subjects (n) | Race | Design | Parameters | Method | Correction | Results |
|---|---|---|---|---|---|---|---|
| Tuulonen 1992 178 | POAG (61)
NTG (50) PEX (54) |
White | Retrospective | MDA | Computer-assisted Planimetry | N/A | MDA NTG 2.33 (0.48) vs. OAG 2.07 (0.43) vs. PEX 1.94 (0.3)
p< 0.001 |
| Jonas 1992 72 | POAG (549)
PEX (78) NTG (22) N (561) |
White | Cross-sectional | MDA | Planimetry | Littmann | MDA NTG 2.96 (0.73) > N 2.69 (0.69) > POAG 2.63 (0.61) > PEX 2.53 (0.51)
P< 0.05 |
| Burk 1992 28 | Mixed (148) | White | Prospective | MDA | Scanning Laser Tomography | Keratometry and ametropia | MDA NTG 2.28 (0.58) vs HTG 2.01 (0.46) p<0.0003 |
| Jonas 2000 77 | NTG (52)
Juvenile OAG (28) |
White | Cross-sectional | MDA | Planimetry | Littmann | MDA NTG 2.9 (0.46) vs. MDA juvenile OAG 2.63 (0.63)
P=0.11 |
| Healey 1999 59 | POAG (106)
OHT (135) PEX (81) N (3320) |
White | Population-based | MVDD | Planimetry | Refraction | MVDD POAG 1.56 (0.20) > MVDD OHT 1.49 (0.17), PEX 1.50 (0.2), N 1.50 (0.18)
P<0.05 |
| Jonas 1998 82 | PG (62)
POAG (566) |
White | prospective | MDA | Planimetry | Littmann | MDA PG 2.67 (0.79) and MDA POAG 2.69 (0.62)
NS |
| Iester 1999 71 | NTG (50)
HTG (132) |
N/A | Cross-sectional | MDA | HRT | Keratometry and ametropia | MDA HTG 2.33 (0.62) vs. NTG 2.33 (0.89), NS |
| Jonas 1988 90 | OAG (233)
N (253) |
white | Retrospective cross-sectional | MDA | Planimetry | Littmann | MDA OAG 2.57 (0.60) vs. N 2.64 (0.80), NS |
|
| |||||||
| Kiriyama 2003 112 | POAG (17)
NTG (23) OHT (15) |
N/A | Prospective | MDA | HRT | Keratometry and ametropia | MDA POAG 2.23 (0.53) vs. NTG 2.33 (0.48) vs. OHT 2.31 (0.46)
NS |
Data are presented as Mean (SD) unless otherwise indicated
Correction: Correction for magnification
NTG: Normal Tension Glaucoma, POAG: Primary Open Angle Glaucoma, OAG: Open Angle Glaucoma, PEX: Pseudo-Exfoliative Glaucoma, PG: Pigmentary Glaucoma, HTG: High Tension Glaucoma, OHT: Ocular Hypertension, N: Normal
N/A: Not available, NS: not significant
MDA: Mean disk area
MVDD: Mean vertical disk diameter
MHDD: Mean Horizontal disk diameter
Moreover, selection bias may influence the results of many non population – based studies. For example, the chance of diagnosing a patient with NTG may be higher in patients with a large disk than a small disk. The larger the disk and the cup/disk ratio, the higher is the likelihood that glaucoma is diagnosed. Similarly, small glaucomatous disks may have lower cup/disk ratios and may be underdiagnosed, providing a further source for bias. 72,80 The population – based Blue Mountains Eye Study found that mean disk diameter was similar between OAG and NTG patients using planimetric measurement techniques. 59 More population – based studies are needed to evaluate the relationship between disk size and various types of glaucoma. Table 5 presents an overview of studies that compare optic disk size in various types of glaucoma and healthy eyes.
F. OCULAR HYPERTENSION
1. Ocular Hypertension and Disk Size
Jonas and colleagues have evaluated a large number of patients with ocular hypertension (n= 265 eyes) and compared the optic disk size in these patients to patients with primary open-angle glaucoma (n=274 eyes), normal-pressure glaucoma (n= 193 eyes), and secondary open-angle glaucoma (n=31 eyes) using planimetry. 99 They found no difference in disk size among the groups. This is in concordance with a previous report from Iester et al, who measured disk size of healthy individuals (n= 62), ocular hypertensives (n= 182), and patients with primary open-angle glaucoma (n= 182) using CSLO. 70 The results of the Blue Mountains Eye Study on the other hand showed that ocular hypertensive eyes (n= 254) had significantly smaller disks than patients with primary open angle glaucoma (n= 184), 59 but the difference was small (POAG mean vertical disk diameter: 1.56 mm ± 0.2 mm vs. OHT mean vertical disk diameter 1.49 ± 0.18 mm, Table 5).
G. ANGLE-CLOSURE GLAUCOMA
1. Angle-closure Glaucoma and Disk Size
The prevalence of angle-closure glaucoma varies considerably depending on the population studied. Estimates range from 0.1% in the Caucasian population 15,67 to 2% – 5% in Eskimos. 3,36,41 According to Sihota, disk size measured with OCT is smaller in angle-closure glaucoma patients compared to primary open-angle glaucoma patients is smaller (2.57 mm 2 ± 0.4 mm 2 vs. 2.85 mm 2 ± 0.3 mm 2, respectively). 166 More studies comparing optic disk size among angle-closure glaucoma and other types of glaucoma are warranted.
H. SUMMARY OF PATIENT FACTORS
There is consistent and strong evidence that black individuals have larger disks compared to white individuals. Disk size is significantly, but only slightly larger in males than in females in some studies. Selection bias must be considered when interpreting the relationship between the type of glaucoma and disk size in non population-based studies.
IV. The Effect of Disk Size on Optic Disk Morphology
A. DISK SIZE, NEURORETINAL RIM AREA AND RETINAL NERVE FIBER LAYER (RNFL)
The number of retinal nerve fibers in healthy eyes varies between individuals and ranges from 750,000 to 1,500,000 million.100,103,111 The intrapapillary retinal nerve fibers form the neuroretinal rim. There is consistent evidence, regardless of the measurement technique that rim area increases with increasing disk size. 21, 22, 24, 31, 48, 49, 79, 86, 110 This raises the question, as to whether large disks have more optic nerve fibers than small disks. A larger number of nerve fibers may represent a larger anatomical reserve in various optic neuropathies including glaucoma.
Some histologic studies have reported a positive correlation between disk size and the number of nerve fibers, 103,150 while other studies have not confirmed this relationship 133,188 (Table 6). Specifically, Quigley et al 150 found that the number of nerve fibers increased linearly with increasing disk size in monkey eyes (n = 25). This association was subsequently confirmed by Jonas and colleagues 103 who demonstrated that in humans (n = 72), larger disks have more nerve fibers compared to small disks. However, conflicting data were reported by Mikelberg and colleagues. 133 In their study, there was no correlation between the optic nerve fiber count and disk size in humans (n = 16). In laser– induced glaucoma of 10 monkey eyes, Yucel et al 188 also did not find a correlation between the number of nerve fibers and the disk area measured with a confocal scanning laser ophthalmoscope (Heidelberg Retina Tomograph). Another study from Savini and colleagues found a positive correlation between optic disk size and 360° retinal nerve fiber layer thickness both measured by optical coherence tomography (r = 0.50, P= 0.0001). 160 Funaki and coworkers investigated the relationship between the size of the optic disk and retinal nerve fiber layer thickness as measured by scanning laser polarimetry in 60 healthy eyes. They found a positive correlation (r = 0.497, P >0.0001) between optic disk size and the integral of peripapillary retinal thickness. 47 These contradictory results among studies may be explained at least in part by differences in the methodology used for estimating disk size (histological vs. imaging technique), differences in histomorphologic technique, species (animal vs. human) and the number of eyes examined.
Table 6.
Optic Disc Characteristics: Morphology
| MORPHOLOGY | Method | Sample Size (n) | Results |
|---|---|---|---|
| Number of Nerve fibers | Histology (human) 103
Histology (monkey) 150 Histology (human) 133 Histology (monkey) 188 |
72
25 16 10 |
Positive correlation with disk size
Positive correlation with disk size Independent from disk size |
| RNFL density | Histology (human) 103
Histology (monkey) 150 |
72
25 |
Negative correlation with disk size
Independent from disk size |
| Size of Neuroretinal rim | Optical Imaging 184
Optical Imaging 31 Planimetry 86 Planimetry 91 Computerized Planimetry 22 Optical Imaging 48 Optical Imaging 21 Planimetry 24 Planimetry 49 |
131
38 234 457 113 194 155 193 139 |
Positive correlation with disk size |
| Cup Disk Ratio | Computerized Planimetry 51
Planimetry 91 Planimetry 37 |
200
319 6678 |
Positive correlation with disk size |
| Number of Lamina Cribrosa Pores | Histology (human) 97 | 40 | Positive correlation with disk size |
| Number of Photoreceptors | Histology (human) 146 | 46 | Positive correlation with disk size |
| Number of cilioretinal arteries | Stereophoto 84 | 163 | Positive correlation with disk size |
B. DISK SIZE AND CUP/DISK RATIO
There is large variation in cup disk ratios within any given population. Jonas and colleagues have performed several groundbreaking studies on morphometry of the optic nerve head and the importance of considering disk size in glaucoma diagnosis. 23,74,105 According to Jonas, cup/disk ratio can range from 0.0 to 0.9 in the healthy population, 91 and there is considerable overlap between normal and glaucomatous eyes. The vertical cup/disk ratio is positively associated with optic disk size in normal and glaucomatous eyes. 22, 37, 51, 75, 91 The Blue Mountains Eye Study 37 (6,678 eyes) showed a positive relationship between cup/disk ratio and disk size. In this population-based sample the median cup/disk ratio increased from 0.35 to 0.55 from small (1.1 – 1.3 mm) to large (1.8 – 2.0 mm) disk diameter with a linear increase in median and 95 th percentiles values in vertical disk diameter (Fig. 1).
Figure 1.
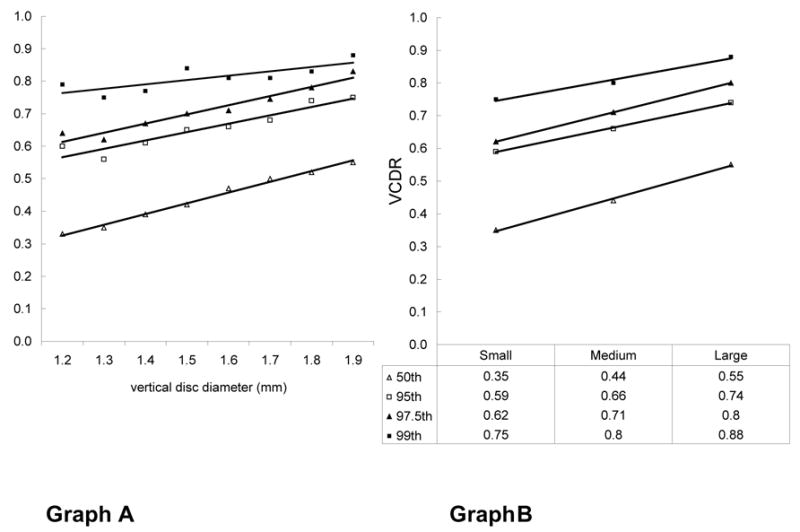
Graph A shows the influence of vertical disk diameter on the 50 th, 95 th, 97.5 th, and 99 th percentiles for vertical cup/disk ratio. Graph B shows the relationship between the vertical cup/disk ratio and the vertical disk diameter after grouping the data into small (1.1 – 1.3 mm), medium (>1.3 – < 1.8 mm) and large (1.8 – 2.0 mm) optic disks. An increase of 0.2 in median vertical cup/disk ratio (0.35 – 0.55) was observed between small and large disks. An equivalent increase of 0.2 (0.59 – 0.74) was observed for the 97.5 th percentile from small to large disk (with Permission from the Br J Ophthalmology and the Blue Mountains Eye Study)
The importance of assessing cup/disk ratio corrected for disk size has been extensively studied by Jonas and coworkers. 76 They showed for example, that the vertical cup/disk ratio corrected for disk size had the highest diagnostic power compared to other optic disk parameters for separating normal subjects from preperimetric glaucoma patients. 75
Although cup/disk ratio measurements can be easily performed by most ophthalmologists and do not require additional imaging equipment, the single measurement has limited value in the estimation of glaucomatous damage if not adjusted for disk size. 37 This is, because the relationship between disk size and cup/disk area ratio is important since a large cup/disk ratio can be physiologic in a large disk, while an average cup/disk ratio may be present in a small disk with glaucoma. A tendency for overdiagnosis in large disks and underdiagnosis in small disks is therefore possible.
Nevertheless, the estimation of the vertical cup/disk ratio is one of the most frequently performed clinical methods for a simple assessment of the optic disk in glaucoma diagnosis and follow-up. 22,37,51 Table 6 presents differences in optic disk morphology in relation to disk size.
Estimation of the disk size is also important in diagnosing diseases other than glaucoma as some optic nerve anomalies such as optic disk drusen, pseudopapilledema, optic nerve hypoplasia, or anterior ischemic optic neuropathy occur preferentially in small optic disks, 73, 85, 87, 89, 139 while other conditions, such as morning glory syndrome and optic disk pits are more common in large disks. 80, 95, 101
C. DISK SIZE AND LAMINA CRIBROSA
The lamina cribrosa pores represent the canals through which the optic nerve axons travel from the retina to the brain. Lamina pores have been evaluated in several recent clinical and histopathological studies. 18, 124, 161, 172 The largest pores of a healthy human optic nerve head are arranged in a vertical hourglass distribution, with more pores and larger pores at the inferior and superior poles. 148 Some studies found less connective tissue at the poles, indicating less structural support for the nerve fibers passing through. 38,142 This may explain the preferential nerve fiber loss in the superior and inferior pole region. Larger disks have a larger total lamina cribrosa area and more lamina pores than small disks, 80,97 potentially allowing more space for nerve fibers to travel through and therefore, possibly reducing the likelihood of focal compression to the axons. On the other hand, the pressure differential across the lamina cribrosa could produce an increased deformation and displacement of the central tissue in large disks, leading to greater glaucoma susceptibility in large disks. Burgoyne and co-workers have described the optic nerve head as a biomechanical structure and their paradigm suggests that mechanical failure of the connective tissue of the lamina cribrosa underlies glaucomatous cupping. Therefore, large disks may be more susceptible to pressure damage as per Laplace’s law. 12,26
As the influence on disk size on the lamina cribrosa resistance and amount of connective tissue is complex, 12,25,26,27,149 further investigation is needed.
D. SUMMARY OF OPTIC DISK MORPHOLOGY
Structural characteristics associated with large disks may include a larger number of nerve fibers, more and larger lamina cribrosa pores, a larger neuroretinal rim area, and a higher cup/disk ratio. As the size of the neuroretinal rim and cup are often used in the differential diagnosis of glaucoma, it is important to estimate disk size so that an accurate assessment can be made (Table 6).
V. Conclusion
The evaluation of disk size is an essential part of optic disk assessment to diagnose and manage glaucoma. It enhances assessment of features of the optic disk, such as neuroretinal rim and cup area, that are necessary for accurate diagnosis and monitoring. It is also important to understand that patient characteristics 28, 35, 72, 125, 128, 149, 178, 181 and the method used for measurement 16, 50, 52, 122, 131 will influence disk size estimates. Longitudinal studies are needed to evaluate the complex relationship between disk size, neural tissue, clinical and demographic factors and the development of glaucoma. Although few studies have directly addressed this issue, there is no evidence that disk size is an independent risk factor for glaucoma.
VI. Method of Literature Search
Papers and abstracts of relevant studies for this review were obtained from the MEDLINE database. The following search words (inclusive MESH headings) were used: optic disk AND size AND glaucoma, measurement AND glaucoma, prevalence AND glaucoma, incidence AND glaucoma, race AND glaucoma, gender AND glaucoma, Hispanics AND glaucoma, optical coherence tomography AND glaucoma AND disk size, nerve fiber count AND optic disk, morphometry AND optic nerve head, lamina cribrosa AND optic nerve head. The search covered the years from 1970 to 2004 and articles published in English and in German were included. Additional sources included publications cited in relevant articles. Criteria for inclusion or exclusion of articles were the originality, the importance for the ophthalmoscopic evaluation of the optic nerve head, and critical judgment of different techniques for evaluation of the optic disk, findings in different groups of glaucoma, and demographic characteristics.
Footnotes
The authors reported no proprietary or commercial interest in any product mentioned or concept discussed in this article. Deutsche Forschungsgemeinschaft (DFG) Ho 3277/1-1 (EMH) and NEI grant EY 11008 (LMZ).
Reprint address: Robert N. Weinreb, Hamilton Glaucoma Center, Department of Ophthalmology, University of California, San Diego, 9500 Gilman Drive, La Jolla, California 92093-0946
Publisher's Disclaimer: This is a PDF file of an unedited manuscript that has been accepted for publication. As a service to our customers we are providing this early version of the manuscript. The manuscript will undergo copyediting, typesetting, and review of the resulting proof before it is published in its final citable form. Please note that during the production process errors may be discovered which could affect the content, and all legal disclaimers that apply to the journal pertain.
References
- 1.Agarwal HC, Gulati V, Sihota R. The normal optic nerve head on heidelberg retina tomography. Indian J Ophthalmol. 2003;51:25–33. [PubMed] [Google Scholar]
- 2.Akman A, Oram O, Aydin P. Optic disc measurements with the 78 diopter lens, zeiss 4-mirror contact lens and computerized image analysing system. Eur J Ophthalmol. 1998;8:22–7. doi: 10.1177/112067219800800106. [DOI] [PubMed] [Google Scholar]
- 3.Alsbirk PH. Angle-closure glaucoma surveys in Greenland Eskimos. A preliminary report. Can J Ophthalmol. 1973;8:260–4. [PubMed] [Google Scholar]
- 4.Ansari-Shahrezaei S, Maar N, Biowski R, et al. Biomicroscopic measurement of the optic disc with a high-power positive lens. Invest Ophthalmol Vis Sci. 2001;42:153–7. [PubMed] [Google Scholar]
- 5.Ansari-Shahrezaei S, Stur M. Magnification characteristic of a +90-diopter double-aspheric fundus examination lens. Invest Ophthalmol Vis Sci. 2002;43:1817–9. [PubMed] [Google Scholar]
- 6.Arnold JV, Gates JW, Taylor KM. Possible errors in the measurement of retinal lesions. Invest Ophthalmol Vis Sci. 1993;34:2576–80. [PubMed] [Google Scholar]
- 7.Balazsi AG, Rootman J, Drance SM, et al. The effect of age on the nerve fiber population of the human optic nerve. Am J Ophthalmol. 1984;97:760–6. doi: 10.1016/0002-9394(84)90509-9. [DOI] [PubMed] [Google Scholar]
- 8.Bartz-Schmidt KU, Sündtgen M, Widder RA, et al. Limits of two-dimensional planimetry in the follow-up of glaucomatous optic discs. Graefes Arch Clin Exp Ophthalmol. 1995;233:284–90. doi: 10.1007/BF00177650. [DOI] [PubMed] [Google Scholar]
- 9.Bass SJ, Sherman J. Optic disk evaluation and utility of high-tech devices in the assessment of glaucoma. Optometry. 2004;75:277–96. doi: 10.1016/s1529-1839(04)70065-2. [DOI] [PubMed] [Google Scholar]
- 10.Bathija R, Zangwill L, Berry CC, et al. Detection of early glaucomatous structural damage with confocal scanning laser tomography. J Glaucoma. 1998;7:121–7. [PubMed] [Google Scholar]
- 11.Beck RW, Messner DK, Musch DC, et al. Is there a racial difference in physiologic cup size? Ophthalmology. 1985;92:873–6. doi: 10.1016/s0161-6420(85)33942-8. [DOI] [PubMed] [Google Scholar]
- 12.Bellezza AJ, Rintalan CJ, Thompson HW, et al. Deformation of the lamina cribrosa and anterior scleral canal wall in early experimental glaucoma. Invest Ophthalmol Vis Sci. 2003;44:623–37. doi: 10.1167/iovs.01-1282. [DOI] [PubMed] [Google Scholar]
- 13.Bengtsson B. The variation and covariation of cup and disc diameters. Acta Ophthalmol (Copenh) 1976;54:804–18. doi: 10.1111/j.1755-3768.1976.tb01801.x. [DOI] [PubMed] [Google Scholar]
- 14.Bengtsson B. The alteration and asymmetry of cup and disc diameters. Acta Ophthalmol (Copenh) 1980;58:726–32. doi: 10.1111/j.1755-3768.1980.tb06685.x. [DOI] [PubMed] [Google Scholar]
- 15.Bengtsson B. The prevalence of glaucoma. Br J Ophthalmol. 1981;65:46–9. doi: 10.1136/bjo.65.1.46. [DOI] [PMC free article] [PubMed] [Google Scholar]
- 16.Bengtsson B, Krakau CE. Correction of optic disc measurements on fundus photographs. Graefes Arch Clin Exp Ophthalmol. 1992;230:24–8. doi: 10.1007/BF00166758. [DOI] [PubMed] [Google Scholar]
- 17.Bennett AG, Rudnicka AR, Edgar DF. Improvements on littmanns method of determining the size of retinal features by fundus photography. Graefes Arch Clin Exp Ophthalmol. 1994;232:361–7. doi: 10.1007/BF00175988. [DOI] [PubMed] [Google Scholar]
- 18.Bhandari A, Fontana L, Fitzke FW, et al. Quantitative analysis of the lamina cribrosa in vivo using a scanning laser opthalmoscope. Curr Eye Res. 1997;16:1–8. doi: 10.1076/ceyr.16.1.1.5114. [DOI] [PubMed] [Google Scholar]
- 19.Bishop KI, Werner EB, Krupin T, et al. Variability and reproducibility of optic disk topographic measurements with the Rodenstock Optic Nerve Head Analyzer. Am J Ophthalmol. 1988;106:696–702. doi: 10.1016/0002-9394(88)90703-9. [DOI] [PubMed] [Google Scholar]
- 20.Bottoni FG, Gonnella PM, Porta AS, et al. Neuroretinal rim area in normal eyes: a study on a randomized group of 30 subjects. Ophthalmologica. 1989;198:40–5. doi: 10.1159/000309957. [DOI] [PubMed] [Google Scholar]
- 21.Bowd C, Zangwill LM, Blumenthal EZ, et al. Imaging of the optic disc and retinal nerve fiber layer: the effects of age, optic disc area, refractive error, and gender. J Opt Soc Am A Opt Image Sci Vis. 2002;19:197–207. doi: 10.1364/josaa.19.000197. [DOI] [PubMed] [Google Scholar]
- 22.Britton RJ, Drance SM, Schulzer M, et al. The area of the neuroretinal rim of the optic nerve in normal eyes. Am J Ophthalmol. 1987;103:497–504. doi: 10.1016/s0002-9394(14)74271-0. [DOI] [PubMed] [Google Scholar]
- 23.Budde WM, Jonas JB. morphology of the optic papilla in glaucoma, I Primary open-angle glaucoma. Klin Monatsbl Augenheilkd. 1999;215:211–20. doi: 10.1055/s-2008-1034702. [DOI] [PubMed] [Google Scholar]
- 24.Budde WM, Jonas JB, Martus P, et al. Influence of optic disc size on neuroretinal rim shape in healthy eyes. J Glaucoma. 2000;9:357–62. doi: 10.1097/00061198-200010000-00003. [DOI] [PubMed] [Google Scholar]
- 25.Burgoyne CF, Downs JC, Bellezza AJ, et al. Three-dimensional reconstruction of normal and early glaucoma monkey optic nerve head connective tissues. Invest Ophthalmol Vis Sci. 2004;45:4388–99. doi: 10.1167/iovs.04-0022. [DOI] [PubMed] [Google Scholar]
- 26.Burgoyne CF, Downs JC, Bellezza AJ, et al. The optic nerve head as a biomechanical structure: a new paradigm for understanding the role of IOP-related stress and strain in the pathophysiology of glaucomatous optic nerve head damage. Prog Retin Eye Res. 2005;24:39–73. doi: 10.1016/j.preteyeres.2004.06.001. [DOI] [PubMed] [Google Scholar]
- 27.Burgoyne CF, Quigley HA, Thompson HW, et al. Early changes in optic disc compliance and surface position in experimental glaucoma. Ophthalmology. 1995;102:1800–9. doi: 10.1016/s0161-6420(95)30791-9. [DOI] [PubMed] [Google Scholar]
- 28.Burk RO, Rohrschneider K, Noack H, et al. Are large optic nerve heads susceptible to glaucomatous damage at normal intraocular pressure? A three-dimensional study by laser scanning tomography Graefes. Arch Clin Exp Ophthalmol. 1992;230:552–60. doi: 10.1007/BF00181778. [DOI] [PubMed] [Google Scholar]
- 29.Burk RO, Rohrschneider K, Takamoto T, et al. Laser scanning tomography and stereophotogrammetry in three-dimensional optic disc analysis. Graefes Arch Clin Exp Ophthalmol. 1993;231:193–8. doi: 10.1007/BF00918840. [DOI] [PubMed] [Google Scholar]
- 30.Caprioli J, Klingbeil U, Sears M, et al. Reproducibility of optic disc measurements with computerized analysis of stereoscopic video images. Arch Ophthalmol. 1986;104:1035–9. doi: 10.1001/archopht.1986.01050190093046. [DOI] [PubMed] [Google Scholar]
- 31.Caprioli J, Miller JM. Optic disc rim area is related to disc size in normal subjects. Arch Ophthalmol. 1987;105:1683–5. doi: 10.1001/archopht.1987.01060120081030. [DOI] [PubMed] [Google Scholar]
- 32.Caprioli J, Miller JM, Sears M. Quantitative evaluation of the optic nerve head in patients with unilateral visual field loss from primary open-angle glaucoma. Ophthalmology. 1987;94:1484–7. doi: 10.1016/s0161-6420(87)33264-6. [DOI] [PubMed] [Google Scholar]
- 33.Cavallotti C, Cavallotti D, Pescosolido N, et al. Age-related changes in rat optic nerve: morphological studies. Anat Histol Embryol. 2003;32:12–6. doi: 10.1046/j.1439-0264.2003.00431.x. [DOI] [PubMed] [Google Scholar]
- 34.Cavallotti C, Pacella E, Pescosolido N, et al. Age-related changes in the human optic nerve. Can J Ophthalmol. 2002;37:389–94. doi: 10.1016/s0008-4182(02)80040-0. [DOI] [PubMed] [Google Scholar]
- 35.Chi T, Ritch R, Stickler D, et al. Racial differences in optic nerve head parameters. Arch Ophthalmol. 1989;107:836–9. doi: 10.1001/archopht.1989.01070010858029. [DOI] [PubMed] [Google Scholar]
- 36.Clemmesen V, Alsbirk PH. Primary angle-closure glaucoma (acg) in Greenland . Acta Ophthalmol (Copenh) 1971;49:47–58. doi: 10.1111/j.1755-3768.1971.tb08231.x. [DOI] [PubMed] [Google Scholar]
- 37.Crowston JG, Hopley CR, Healey PR, et al. The effect of optic disc diameter on vertical cup to disc ratio percentiles in a population based cohort: the Blue Mountains Eye Study. Br J Ophthalmol. 2004;88:766–70. doi: 10.1136/bjo.2003.028548. [DOI] [PMC free article] [PubMed] [Google Scholar]
- 38.Dandona L, Quigley HA, Brown AE, et al. Quantitative regional structure of the normal human lamina cribrosa. A racial comparison Arch Ophthalmol. 1990;108:393–8. doi: 10.1001/archopht.1990.01070050091039. [DOI] [PubMed] [Google Scholar]
- 39.Dielemans I, Vingerling JR, Wolfs RC, et al. The prevalence of primary open-angle glaucoma in a population-based study in The Netherlands. The Rotterdam Study Ophthalmology. 1994;101:1851–5. doi: 10.1016/s0161-6420(94)31090-6. [DOI] [PubMed] [Google Scholar]
- 40.Donders FC. Beitraege zur kenntnis des glaucoms. Berlin: 1861. p. 148. [Google Scholar]
- 41.Drance SM. Angle closure glaucoma among Canadian Eskimos. Can J Ophthalmol. 1973;8:252–4. [PubMed] [Google Scholar]
- 42.Durukan AH, Yucel I, Akar Y, et al. Assessment of optic nerve head topographic parameters with a confocal scanning laser ophthalmoscope. Clin Experiment Ophthalmol. 2004;32:259–64. doi: 10.1111/j.1442-9071.2004.00790.x. [DOI] [PubMed] [Google Scholar]
- 43.Eysteinsson T, Jonasson F, Arnarsson A, et al. Relationships between ocular dimensions and adult stature among participants in the Reykjavik Eye Study. Acta Ophthalmol Scand. 2005;83:734–8. doi: 10.1111/j.1600-0420.2005.00540.x. [DOI] [PubMed] [Google Scholar]
- 44.Fazio P, Krupin T, Feitl ME, et al. Optic disc topography in patients with low-tension and primary open angle glaucoma. Arch Ophthalmol. 1990;108:705–8. doi: 10.1001/archopht.1990.01070070091042. [DOI] [PubMed] [Google Scholar]
- 45.Fingert JH, Héon E, Liebmann JM, et al. Analysis of myocilin mutations in 1703 glaucoma patients from five different populations. Hum Mol Genet. 1999;8:899–905. doi: 10.1093/hmg/8.5.899. [DOI] [PubMed] [Google Scholar]
- 46.Flammer J. [normal-pressure glaucoma] Fortschr Ophthalmol. 1990;87 (Suppl):S187–9. [PubMed] [Google Scholar]
- 47.Funaki S, Shirakashi M, Abe H. Relation between size of optic disc and thickness of retinal nerve fibre layer in normal subjects. Br J Ophthalmol. 1998;82:1242–5. doi: 10.1136/bjo.82.11.1242. [DOI] [PMC free article] [PubMed] [Google Scholar]
- 48.Funk J, Dieringer T, Grehn F. [normal values of various papillary parameters and correlation to papillary size] Fortschr Ophthalmol. 1990;87:153–7. [PubMed] [Google Scholar]
- 49.Garway-Heath DF, Hitchings RA. Quantitative evaluation of the optic nerve head in early glaucoma. Br J Ophthalmol. 1998;82:352–61. doi: 10.1136/bjo.82.4.352. [DOI] [PMC free article] [PubMed] [Google Scholar]
- 50.Garway-Heath DF, Hitchings RA. Measurement of optic disc size. Br J Ophthalmol. 1999;83:252. doi: 10.1136/bjo.83.2.252. [DOI] [PMC free article] [PubMed] [Google Scholar]
- 51.Garway-Heath DF, Ruben ST, Viswanathan A, et al. Vertical cup/disc ratio in relation to optic disc size: its value in the assessment of the glaucoma suspect. Br J Ophthalmol. 1998;82:1118–24. doi: 10.1136/bjo.82.10.1118. [DOI] [PMC free article] [PubMed] [Google Scholar]
- 52.Garway-Heath DF, Rudnicka AR, Lowe T, et al. Measurement of optic disc size: equivalence of methods to correct for ocular magnification. Br J Ophthalmol. 1998;82:643–9. doi: 10.1136/bjo.82.6.643. [DOI] [PMC free article] [PubMed] [Google Scholar]
- 53.Garway-Heath DF, Wollstein G, Hitchings RA. Aging changes of the optic nerve head in relation to open angle glaucoma. Br J Ophthalmol. 1997;81:840–5. doi: 10.1136/bjo.81.10.840. [DOI] [PMC free article] [PubMed] [Google Scholar]
- 54.Girkin CA, McGwin G, McNeal SF, et al. Racial differences in the association between optic disc topography and early glaucoma. Invest Ophthalmol Vis Sci. 2003;44:3382–7. doi: 10.1167/iovs.02-0792. [DOI] [PubMed] [Google Scholar]
- 55.Girkin CA, McGwin G, Xie A, et al. Differences in optic disc topography between black and white normal subjects. Ophthalmology. 2005;112:33–9. doi: 10.1016/j.ophtha.2004.07.029. [DOI] [PubMed] [Google Scholar]
- 56.Gordon MO, Beiser JA, Brandt JD, et al. The Ocular Hypertension Treatment Study: baseline factors that predict the onset of primary open-angle glaucoma. Arch Ophthalmol. 2002;120:714–20. doi: 10.1001/archopht.120.6.714. discussion 829–30. [DOI] [PubMed] [Google Scholar]
- 57.Greve EL, Furuno F. Myopia and glaucoma. Albrecht Von Graefes Arch Klin Exp Ophthalmol. 1980;213:33–41. doi: 10.1007/BF02391209. [DOI] [PubMed] [Google Scholar]
- 58.Haslett RS, Batterbury M, Cuypers M, et al. Inter-observer agreement in clinical optic disc measurement using a modified 60 D lens. Eye. 1997;11 (Pt 5):692–7. doi: 10.1038/eye.1997.179. [DOI] [PubMed] [Google Scholar]
- 59.Healey PR, Mitchell P. Optic disk size in open-angle glaucoma: the Blue Mountains Eye Study. Am J Ophthalmol. 1999;128:515–7. doi: 10.1016/s0002-9394(99)00195-6. [DOI] [PubMed] [Google Scholar]
- 60.Healey PR, Mitchell P, Smith W, et al. Relationship between cup-disc ratio and optic disc diameter: the Blue Mountains Eye Study. Aust N Z J Ophthalmol. 1997;25 (Suppl 1):S99–101. doi: 10.1111/j.1442-9071.1997.tb01771.x. [DOI] [PubMed] [Google Scholar]
- 61.Heijl A, Mölder H. Optic disc diameter influences the ability to detect glaucomatous disc damage. Acta Ophthalmol (Copenh) 1993;71:122–9. doi: 10.1111/j.1755-3768.1993.tb04974.x. [DOI] [PubMed] [Google Scholar]
- 62.Herndon LW, Weizer JS, Stinnett SS. Central corneal thickness as a risk factor for advanced glaucoma damage. Arch Ophthalmol. 2004;122:17–21. doi: 10.1001/archopht.122.1.17. [DOI] [PubMed] [Google Scholar]
- 63.Higginbotham EJ. The Advanced Glaucoma Intervention Study (AGIS): 3. Baseline characteristics of black and white patients. Ophthalmology. 1998;105:1137–45. doi: 10.1016/s0161-6420(98)97012-9. [DOI] [PubMed] [Google Scholar]
- 64.Higginbotham EJ, Gordon MO, Beiser JA, et al. The Ocular Hypertension Treatment Study: topical medication delays or prevents primary open-angle glaucoma in African American individuals. Arch Ophthalmol. 2004;122:813–20. doi: 10.1001/archopht.122.6.813. [DOI] [PubMed] [Google Scholar]
- 65.Hoffmann EM, Bowd C, Medeiros FA, et al. Agreement among 3 optical imaging methods for the assessment of optic disc topography. Ophthalmology. 2005;112:2149–56. doi: 10.1016/j.ophtha.2005.07.003. [DOI] [PubMed] [Google Scholar]
- 66.Hoffmann EM, Medeiros FA, et al. Agreement among three optical imaging methods for the assessment of optic disk topography. Ophthalmology. 2005 doi: 10.1016/j.ophtha.2005.07.003. [DOI] [PubMed] [Google Scholar]
- 67.Hollows FC, McGuiness R. The size of the optic cup. Trans Ophthalmol Soc Aust. 1966;25:33–8. [PubMed] [Google Scholar]
- 68.Huang D, Swanson EA, Lin CP, et al. Optical coherence tomography. Science. 1991;254:1178–81. doi: 10.1126/science.1957169. [DOI] [PMC free article] [PubMed] [Google Scholar]
- 69.Hyman L, Wu SY, Connell AM, et al. Prevalence and causes of visual impairment in The Barbados Eye Study. Ophthalmology. 2001;108:1751–6. doi: 10.1016/s0161-6420(01)00590-5. [DOI] [PubMed] [Google Scholar]
- 70.Iester M, Broadway DC, Mikelberg FS, et al. A comparison of healthy, ocular hypertensive, and glaucomatous optic disc topographic parameters. J Glaucoma. 1997;6:363–70. [PubMed] [Google Scholar]
- 71.Iester M, Mikelberg FS. Optic nerve head morphologic characteristics in high-tension and normal-tension glaucoma. Arch Ophthalmol. 1999;117:1010–3. doi: 10.1001/archopht.117.8.1010. [DOI] [PubMed] [Google Scholar]
- 72.Jonas JB. Size of glaucomatous optic discs. Ger J Ophthalmol. 1992;1:41–4. [PubMed] [Google Scholar]
- 73.Jonas JB. Frequency of optic disc drusen and size of the optic disc. Ophthalmology. 1997;104:1531–2. doi: 10.1016/s0161-6420(97)38958-1. [DOI] [PubMed] [Google Scholar]
- 74.Jonas JB. [Glaucoma diagnosis of the optic disc using photography and planimetry] Ophthalmologe. 2003;100:13–20. doi: 10.1007/s00347-002-0752-4. [DOI] [PubMed] [Google Scholar]
- 75.Jonas JB, Bergua A, Schmitz-Valckenberg P, et al. Ranking of optic disc variables for detection of glaucomatous optic nerve damage. Invest Ophthalmol Vis Sci. 2000;41:1764–73. [PubMed] [Google Scholar]
- 76.Jonas JB, Budde WM. Diagnosis and pathogenesis of glaucomatous optic neuropathy: morphological aspects. Prog Retin Eye Res. 2000;19:1–40. doi: 10.1016/s1350-9462(99)00002-6. [DOI] [PubMed] [Google Scholar]
- 77.Jonas JB, Budde WM. Optic nerve head appearance in juvenile-onset chronic high-pressure glaucoma and normal-pressure glaucoma. Ophthalmology. 2000;107:704–11. doi: 10.1016/s0161-6420(99)00172-4. [DOI] [PubMed] [Google Scholar]
- 78.Jonas JB, Budde WM. Optic nerve damage in highly myopic eyes with chronic open-angle glaucoma. Eur J Ophthalmol. 2005;15:41–7. doi: 10.1177/112067210501500107. [DOI] [PubMed] [Google Scholar]
- 79.Jonas JB, Budde WM, Lang P. Neuroretinal rim width ratios in morphological glaucoma diagnosis. Br J Ophthalmol. 1998;82:1366–71. doi: 10.1136/bjo.82.12.1366. [DOI] [PMC free article] [PubMed] [Google Scholar]
- 80.Jonas JB, Budde WM, Panda-Jonas S. Ophthalmoscopic evaluation of the optic nerve head. Surv Ophthalmol. 1999;43:293–320. doi: 10.1016/s0039-6257(98)00049-6. [DOI] [PubMed] [Google Scholar]
- 81.Jonas JB, Dichtl A. Optic disc morphology in myopic primary open-angle glaucoma. Graefes Arch Clin Exp Ophthalmol. 1997;235:627–33. doi: 10.1007/BF00946938. [DOI] [PubMed] [Google Scholar]
- 82.Jonas JB, Dichtl A, Budde WM, et al. Optic disc morphology in pigmentary glaucoma. Br J Ophthalmol. 1998;82:875–9. doi: 10.1136/bjo.82.8.875. [DOI] [PMC free article] [PubMed] [Google Scholar]
- 83.Jonas JB, Fernández MC, Naumann GO. Correlation of the optic disc size to glaucoma susceptibility. Ophthalmology. 1991;98:675–80. doi: 10.1016/s0161-6420(91)32234-6. [DOI] [PubMed] [Google Scholar]
- 84.Jonas JB, Guggenmoos-Holzmann I, Naumann GO. Cilioretinal arteries in large optic disks. Ophthalmic Res. 1988;20:269–74. doi: 10.1159/000266723. [DOI] [PubMed] [Google Scholar]
- 85.Jonas JB, Gusek GC, Guggenmoos-Holzmann I, et al. Optic nerve head drusen associated with abnormally small optic discs. Int Ophthalmol. 1987;11:79–82. doi: 10.1007/BF00136734. [DOI] [PubMed] [Google Scholar]
- 86.Jonas JB, Gusek GC, Guggenmoos-Holzmann I, et al. Correlations of the neuroretinal rim area with ocular and general parameters in normal eyes. Ophthalmic Res. 1988;20:298–303. doi: 10.1159/000266730. [DOI] [PubMed] [Google Scholar]
- 87.Jonas JB, Gusek GC, Guggenmoos-Holzmann I, et al. Pseudopapilledema associated with abnormally small optic discs. Acta Ophthalmol (Copenh) 1988;66:190–3. doi: 10.1111/j.1755-3768.1988.tb04010.x. [DOI] [PubMed] [Google Scholar]
- 88.Jonas JB, Gusek GC, Guggenmoos-Holzmann I, et al. Variability of the real dimensions of normal human optic discs. Graefes Arch Clin Exp Ophthalmol. 1988;226:332–6. doi: 10.1007/BF02172962. [DOI] [PubMed] [Google Scholar]
- 89.Jonas JB, Gusek GC, Naumann GO. Anterior ischemic optic neuropathy: nonarteritic form in small and giant cell arteritis in normal sized optic discs. Int Ophthalmol. 1988;12:119–25. doi: 10.1007/BF00137137. [DOI] [PubMed] [Google Scholar]
- 90.Jonas JB, Gusek GC, Naumann GO. Optic disc morphometry in chronic primary open-angle glaucoma. I Morphometric intrapapillary characteristics Graefes. Arch Clin Exp Ophthalmol. 1988;226:522–30. doi: 10.1007/BF02169199. [DOI] [PubMed] [Google Scholar]
- 91.Jonas JB, Gusek GC, Naumann GO. Optic disc, cup and neuroretinal rim size, configuration and correlations in normal eyes. Invest Ophthalmol Vis Sci. 1988;29:1151–8. [PubMed] [Google Scholar]
- 92.Jonas JB, Gusek GC, Naumann GO. Optic disk morphometry in high myopia. Graefes Arch Clin Exp Ophthalmol. 1988;226:587–90. doi: 10.1007/BF02169209. [DOI] [PubMed] [Google Scholar]
- 93.Jonas JB, Königsreuther KA. Macrodiscs in eyes with flat and large corneas. Ger J Ophthalmol. 1994;3:179–81. [PubMed] [Google Scholar]
- 94.Jonas JB, Königsreuther KA, Naumann GO. Optic disc histomorphometry in normal eyes and eyes with secondary angle-closure glaucoma. I Intrapapillary region Graefes. Arch Clin Exp Ophthalmol. 1992;230:129–33. doi: 10.1007/BF00164650. [DOI] [PubMed] [Google Scholar]
- 95.Jonas JB, Koniszewski G, Naumann GO. [morning glory syndrome and handmanns anomaly in congenital macropapilla. Extreme variants of confluent optic pits?] Klin Monatsbl Augenheilkd. 1989;195:371–4. doi: 10.1055/s-2008-1050058. [DOI] [PubMed] [Google Scholar]
- 96.Jonas JB, Mardin CY, Gründler AE. Comparison of measurements of neuroretinal rim area between confocal laser scanning tomography and planimetry of photographs. Br J Ophthalmol. 1998;82:362–6. doi: 10.1136/bjo.82.4.362. [DOI] [PMC free article] [PubMed] [Google Scholar]
- 97.Jonas JB, Mardin CY, Schlötzer-Schrehardt U, et al. Morphometry of the human lamina cribrosa surface. Invest Ophthalmol Vis Sci. 1991;32:401–5. [PubMed] [Google Scholar]
- 98.Jonas JB, Martus P, Budde WM. Anisometropia and degree of optic nerve damage in chronic open-angle glaucoma. Am J Ophthalmol. 2002;134:547–51. doi: 10.1016/s0002-9394(02)01644-6. [DOI] [PubMed] [Google Scholar]
- 99.Jonas JB, Martus P, Horn FK, et al. Predictive factors of the optic nerve head for development or progression of glaucomatous visual field loss. Invest Ophthalmol Vis Sci. 2004;45:2613–8. doi: 10.1167/iovs.03-1274. [DOI] [PubMed] [Google Scholar]
- 100.Jonas JB, Müller-Bergh JA, Schlötzer-Schrehardt UM, et al. Histomorphometry of the human optic nerve. Invest Ophthalmol Vis Sci. 1990;31:736–44. [PubMed] [Google Scholar]
- 101.Jonas JB, Naumann GO. [pits of the optic papilla in large optic nerve papillae. Papillometric characteristics in 15 eyes] Klin Monatsbl Augenheilkd. 1987;191:287–91. doi: 10.1055/s-2008-1050511. [DOI] [PubMed] [Google Scholar]
- 102.Jonas JB, Papastathopoulos K. Ophthalmoscopic measurement of the optic disc. Ophthalmology. 1995;102:1102–6. doi: 10.1016/s0161-6420(95)30905-0. [DOI] [PubMed] [Google Scholar]
- 103.Jonas JB, Schmidt AM, Müller-Bergh JA, et al. Human optic nerve fiber count and optic disc size. Invest Ophthalmol Vis Sci. 1992;33:2012–8. [PubMed] [Google Scholar]
- 104.Jonas JB, Thomas R, George R, et al. Optic disc morphology in south India: the Vellore Eye Study. Br J Ophthalmol. 2003;87:189–96. doi: 10.1136/bjo.87.2.189. [DOI] [PMC free article] [PubMed] [Google Scholar]
- 105.Jonas JB, Zäch FM, Gusek GC, et al. Pseudoglaucomatous physiologic large cups. Am J Ophthalmol. 1989;107:137–44. doi: 10.1016/0002-9394(89)90212-2. [DOI] [PubMed] [Google Scholar]
- 106.Jonescu-Cuypers CP, Thumann G, Hilgers RD, et al. Long-term fluctuations of the normalised rim/disc area ratio quotient in normal eyes. Graefes Arch Clin Exp Ophthalmol. 1999;237:181–6. doi: 10.1007/s004170050216. [DOI] [PubMed] [Google Scholar]
- 107.Kahn HA, Leibowitz HM, Ganley JP, et al. The Framingham Eye Study. I Outline and major prevalence findings. Am J Epidemiol. 1977;106:17–32. doi: 10.1093/oxfordjournals.aje.a112428. [DOI] [PubMed] [Google Scholar]
- 108.Kamel HK, Rodriguez-Saldaña J, Flaherty JH, et al. Diabetes mellitus among ethnic seniors: contrasts with diabetes in whites. Clin Geriatr Med. 1999;15:265–78. [PubMed] [Google Scholar]
- 109.Kashiwagi K, Tamura M, Abe K, et al. The influence of age, gender, refractive error, and optic disc size on the optic disc configuration in Japanese normal eyes. Acta Ophthalmol Scand. 2000;78:200–3. doi: 10.1034/j.1600-0420.2000.078002200.x. [DOI] [PubMed] [Google Scholar]
- 110.Kee C, Koo H, Ji Y, et al. Effect of optic disc size or age on evaluation of optic disc variables. Br J Ophthalmol. 1997;81:1046–9. doi: 10.1136/bjo.81.12.1046. [DOI] [PMC free article] [PubMed] [Google Scholar]
- 111.Kerrigan-Baumrind LA, Quigley HA, Pease ME, et al. Number of ganglion cells in glaucoma eyes compared with threshold visual field tests in the same persons. Invest Ophthalmol Vis Sci. 2000;41:741–8. [PubMed] [Google Scholar]
- 112.Kiriyama N, Ando A, Fukui C, et al. A comparison of optic disc topographic parameters in patients with primary open angle glaucoma, normal tension glaucoma, and ocular hypertension. Graefes Arch Clin Exp Ophthalmol. 2003;241:541–5. doi: 10.1007/s00417-003-0702-0. [DOI] [PubMed] [Google Scholar]
- 113.Kirwan JF, Gouws P, Linnell AE, et al. Pharmacological mydriasis and optic disc examination. Br J Ophthalmol. 2000;84:894–8. doi: 10.1136/bjo.84.8.894. [DOI] [PMC free article] [PubMed] [Google Scholar]
- 114.Klein BE, Klein R, Sponsel WE, et al. Prevalence of glaucoma. The Beaver Dam Eye Study Ophthalmology. 1992;99:1499–504. doi: 10.1016/s0161-6420(92)31774-9. [DOI] [PubMed] [Google Scholar]
- 115.Kruse FE, Burk RO, Völcker HE, et al. Reproducibility of topographic measurements of the optic nerve head with laser tomographic scanning. Ophthalmology. 1989;96:1320–4. doi: 10.1016/s0161-6420(89)32719-9. [DOI] [PubMed] [Google Scholar]
- 116.La Rosa FA, Gross RL, Orengo-Nania S. Central corneal thickness of Caucasians and African Americans in glaucomatous and nonglaucomatous populations. Arch Ophthalmol. 2001;119:23–7. [PubMed] [Google Scholar]
- 117.Lee BL, Bathija R, Weinreb RN. The definition of normal-tension glaucoma. J Glaucoma. 1998;7:366–71. [PubMed] [Google Scholar]
- 118.Leske MC, Connell AM, Schachat AP, et al. The Barbados Eye Study. Prevalence of open angle glaucoma. Arch Ophthalmol. 1994;112:821–9. doi: 10.1001/archopht.1994.01090180121046. [DOI] [PubMed] [Google Scholar]
- 119.Levene RZ. Low tension glaucoma: a critical review and new material. Surv Ophthalmol. 1980;24:621–64. doi: 10.1016/0039-6257(80)90123-x. [DOI] [PubMed] [Google Scholar]
- 120.Lichter PR. Variability of expert observers in evaluating the optic disc. Trans Am Ophthalmol Soc. 1976;74:532–72. [PMC free article] [PubMed] [Google Scholar]
- 121.Lim CS, O'Brien C, Bolton NM. A simple clinical method to measure the optic disc size in glaucoma. J Glaucoma. 1996;5:241–5. [PubMed] [Google Scholar]
- 122.Littmann H. [Determination of the real size of an object on the fundus of the living eye] Klin Monatsbl Augenheilkd. 1982;180:286–9. doi: 10.1055/s-2008-1055068. [DOI] [PubMed] [Google Scholar]
- 123.Littmann H. Determination of the true size of an object on the fundus of the living eye. By h Littmann from the original article, zur bestimmung der wahren grosse eines objektes auf dem hintergrund des lebenden auges, which originally appeared in klinisches monatsbl. Optom Vis Sci. 1992;69:717–20. [Google Scholar]
- 124.Maeda H, Nakamura M, Yamamoto M. Morphometric features of laminar pores in lamina cribrosa observed by scanning laser ophthalmoscopy. Jpn J Ophthalmol. 1999;43:415–21. doi: 10.1016/s0021-5155(99)00090-8. [DOI] [PubMed] [Google Scholar]
- 125.Mansour AM. Racial variation of optic disc size. Ophthalmic Res. 1991;23:67–72. doi: 10.1159/000267091. [DOI] [PubMed] [Google Scholar]
- 126.Mansour AM. Racial variation of optic disc parameters in children. Ophthalmic Surg. 1992;23:469–71. [PubMed] [Google Scholar]
- 127.Mardin CY, Horn FK. Influence of optic disc size on the sensitivity of the Heidelberg Retina Tomograph. Graefes Arch Clin Exp Ophthalmol. 1998;236:641–5. doi: 10.1007/s004170050135. [DOI] [PubMed] [Google Scholar]
- 128.Martin MJ, Sommer A, Gold EB, et al. Race and primary open-angle glaucoma. Am J Ophthalmol. 1985;99:383–7. doi: 10.1016/0002-9394(85)90001-7. [DOI] [PubMed] [Google Scholar]
- 129.Mason RP, Kosoko O, Wilson MR, et al. National survey of the prevalence and risk factors of glaucoma in St. Lucia, West Indies Part I Prevalence findings. Ophthalmology. 1989;96:1363–8. doi: 10.1016/s0161-6420(89)32708-4. [DOI] [PubMed] [Google Scholar]
- 130.Medeiros FA, Zangwill LM, Bowd C, et al. Evaluation of retinal nerve fiber layer, optic nerve head, and macular thickness measurements for glaucoma detection using optical coherence tomography. Am J Ophthalmol. 2005;139:44–55. doi: 10.1016/j.ajo.2004.08.069. [DOI] [PubMed] [Google Scholar]
- 131.Meyer T, Howland HC. How large is the optic disc? Systematic errors in fundus cameras and topographers. Ophthalmic Physiol Opt. 2001;21:139–50. doi: 10.1046/j.1475-1313.2001.00551.x. [DOI] [PubMed] [Google Scholar]
- 132.Miglior S, Brigatti L, Velati P, et al. Relationship between morphometric optic disc parameters, sex and axial length. Curr Eye Res. 1994;13:119–24. doi: 10.3109/02713689409042406. [DOI] [PubMed] [Google Scholar]
- 133.Mikelberg FS, Yidegiligne HM, White VA, et al. Relation between optic nerve axon number and axon diameter to scleral canal area. Ophthalmology. 1991;98:60–3. doi: 10.1016/s0161-6420(91)32341-8. [DOI] [PubMed] [Google Scholar]
- 134.Miller KM, Quigley HA. Comparison of optic disc features in low-tension and typical open-angle glaucoma. Ophthalmic Surg. 1987;18:882–9. [PubMed] [Google Scholar]
- 135.Mitchell P, Hourihan F, Sandbach J, et al. The relationship between glaucoma and myopia: the Blue Mountains Eye Study. Ophthalmology. 1999;106:2010–5. doi: 10.1016/s0161-6420(99)90416-5. [DOI] [PubMed] [Google Scholar]
- 136.Mitchell P, Smith W, Attebo K, et al. Prevalence of open-angle glaucoma in Australia The Blue Mountains Eye Study. Ophthalmology. 1996;103:1661–9. doi: 10.1016/s0161-6420(96)30449-1. [DOI] [PubMed] [Google Scholar]
- 137.Montgomery DM. Measurement of optic disc and neuroretinal rim areas in normal and glaucomatous eyes. A new clinical method. Ophthalmology. 1991;98:50–9. doi: 10.1016/s0161-6420(91)32342-x. [DOI] [PubMed] [Google Scholar]
- 138.Montgomery DM. Clinical disc biometry in early glaucoma. Ophthalmology. 1993;100:52–6. doi: 10.1016/s0161-6420(13)31713-8. [DOI] [PubMed] [Google Scholar]
- 139.Mullie MA, Sanders MD. Scleral canal size and optic nerve head drusen. Am J Ophthalmol. 1985;99:356–9. doi: 10.1016/0002-9394(85)90369-1. [DOI] [PubMed] [Google Scholar]
- 140.Nakatsue T, Shirakashi M, Yaoeda K, et al. Optic disc topography as measured by confocal scanning laser ophthalmoscopy and visual field loss in Japanese patients with primary open-angle or normal-tension glaucoma. J Glaucoma. 2004;13:291–8. doi: 10.1097/00061198-200408000-00006. [DOI] [PubMed] [Google Scholar]
- 141.Nemesure B, Wu SY, Hennis A, et al. Corneal thickness and intraocular pressure in the Barbados eye studies. Arch Ophthalmol. 2003;121:240–4. doi: 10.1001/archopht.121.2.240. [DOI] [PubMed] [Google Scholar]
- 142.Ogden TE, Duggan J, Danley K, et al. Morphometry of nerve fiber bundle pores in the optic nerve head of the human. Exp Eye Res. 1988;46:559–68. doi: 10.1016/s0014-4835(88)80012-5. [DOI] [PubMed] [Google Scholar]
- 143.Orgul S, Cioffi GA, Bacon DR, et al. Sources of variability of topometric data with a scanning laser ophthalmoscope. Arch Ophthalmol. 1996;114:161–4. doi: 10.1001/archopht.1996.01100130155007. [DOI] [PubMed] [Google Scholar]
- 144.Orgul S, Croffi GA, Van Buskirk EM. Variability of contour line alignment on sequential images with the Heidelberg Retina Tomograph. Graefes Arch Clin Exp Ophthalmol. 1997;235:82–6. doi: 10.1007/BF00941734. [DOI] [PubMed] [Google Scholar]
- 145.Pach J, Pennell DO, Romano PE. Optic disc photogrammetry: magnification factors for eye position, centration, and ametropias, refractive and axial; and their application in the diagnosis of optic nerve hypoplasia. Ann Ophthalmol. 1989;21:454–62. [PubMed] [Google Scholar]
- 146.Panda-Jonas S, Jonas JB, Jakobczyk M, et al. Retinal photoreceptor count, retinal surface area, and optic disc size in normal human eyes. Ophthalmology. 1994;101:519–23. doi: 10.1016/s0161-6420(94)31305-4. [DOI] [PubMed] [Google Scholar]
- 147.Peigne G, Schwartz B, Takamoto T. Differences of retinal nerve fiber layer thickness between normal and glaucoma-like optic disks (physiological cups) matched by optic disk area. Acta Ophthalmol (Copenh) 1993;71:451–7. doi: 10.1111/j.1755-3768.1993.tb04617.x. [DOI] [PubMed] [Google Scholar]
- 148.Quigley HA, Addicks EM. Regional differences in the structure of the lamina cribrosa and their relation to glaucomatous optic nerve damage. Arch Ophthalmol. 1981;99:137–43. doi: 10.1001/archopht.1981.03930010139020. [DOI] [PubMed] [Google Scholar]
- 149.Quigley HA, Brown AE, Morrison JD, et al. The size and shape of the optic disc in normal human eyes. Arch Ophthalmol. 1990;108:51–7. doi: 10.1001/archopht.1990.01070030057028. [DOI] [PubMed] [Google Scholar]
- 150.Quigley HA, Coleman AL, Dorman-Pease ME. Larger optic nerve heads have more nerve fibers in normal monkey eyes. Arch Ophthalmol. 1991;109:1441–3. doi: 10.1001/archopht.1991.01080100121056. [DOI] [PubMed] [Google Scholar]
- 151.Quigley HA, Enger C, Katz J, et al. Risk factors for the development of glaucomatous visual field loss in ocular hypertension. Arch Ophthalmol. 1994;112:644–9. doi: 10.1001/archopht.1994.01090170088028. [DOI] [PubMed] [Google Scholar]
- 152.Quigley HA, Hohman RM, Addicks EM, et al. Morphologic changes in the lamina cribrosa correlated with neural loss in open-angle glaucoma. Am J Ophthalmol. 1983;95:673–91. doi: 10.1016/0002-9394(83)90389-6. [DOI] [PubMed] [Google Scholar]
- 153.Quigley HA, Varma R, Tielsch JM, et al. The relationship between optic disc area and open-angle glaucoma: the Baltimore Eye Survey. J Glaucoma. 1999;8:347–52. [PubMed] [Google Scholar]
- 154.Racette L, Wilson MR, Zangwill LM, et al. Primary open-angle glaucoma in blacks: a review. Surv Ophthalmol. 2003;48:295–313. doi: 10.1016/s0039-6257(03)00028-6. [DOI] [PubMed] [Google Scholar]
- 155.Ramrattan RS, Wolfs RC, Jonas JB, et al. Determinants of optic disc characteristics in a general population: The Rotterdam Study. Ophthalmology. 1999;106:1588–96. doi: 10.1016/S0161-6420(99)90457-8. [DOI] [PubMed] [Google Scholar]
- 156.Robert Y. Biomorphometry of the optic disc. Curr Opin Ophthalmol. 1993;4:35–9. [PubMed] [Google Scholar]
- 157.Rotchford AP, Johnson GJ. Glaucoma in Zulus: a population-based cross-sectional survey in a rural district in South Africa. Arch Ophthalmol. 2002;120:471–8. doi: 10.1001/archopht.120.4.471. [DOI] [PubMed] [Google Scholar]
- 158.Ruben S. Estimation of optic disc size using indirect biomicroscopy. Br J Ophthalmol. 1994;78:363–4. doi: 10.1136/bjo.78.5.363. [DOI] [PMC free article] [PubMed] [Google Scholar]
- 159.Rudnicka AR, Frost C, Owen CG, et al. Nonlinear behavior of certain optic nerve head parameters and their determinants in normal subjects. Ophthalmology. 2001;108:2358–68. doi: 10.1016/s0161-6420(01)00821-1. [DOI] [PubMed] [Google Scholar]
- 160.Savini G, Zanini M, Carelli V, et al. Correlation between retinal nerve fibre layer thickness and optic nerve head size: an optical coherence tomography study. Br J Ophthalmol. 2005;89:489–92. doi: 10.1136/bjo.2004.052498. [DOI] [PMC free article] [PubMed] [Google Scholar]
- 161.Sawaguchi S, Yue BY, Fukuchi T, et al. Collagen fibrillar network in the optic nerve head of normal monkey eyes and monkey eyes with laser-induced glaucoma--a scanning electron microscopic study. Curr Eye Res. 1999;18:143–9. doi: 10.1076/ceyr.18.2.143.5385. [DOI] [PubMed] [Google Scholar]
- 162.Schuman JS, Hee MR, Arya AV, et al. Optical coherence tomography: a new tool for glaucoma diagnosis. Curr Opin Ophthalmol. 1995;6:89–95. doi: 10.1097/00055735-199504000-00014. [DOI] [PubMed] [Google Scholar]
- 163.Schuman JS, Pedut-Kloizman T, Hertzmark E, et al. Reproducibility of nerve fiber layer thickness measurements using optical coherence tomography. Ophthalmology. 1996;103:1889–98. doi: 10.1016/s0161-6420(96)30410-7. [DOI] [PMC free article] [PubMed] [Google Scholar]
- 164.Schuman JS, Wollstein G, Farra T, et al. Comparison of optic nerve head measurements obtained by optical coherence tomography and confocal scanning laser ophthalmoscopy. Am J Ophthalmol. 2003;135:504–12. doi: 10.1016/s0002-9394(02)02093-7. [DOI] [PubMed] [Google Scholar]
- 165.Schwartz JT. Methodologic differences and measurement of cup-disc ratio: an epidemiologic assessment. Arch Ophthalmol. 1976;94:1101–5. doi: 10.1001/archopht.1976.03910040021004. [DOI] [PubMed] [Google Scholar]
- 166.Sihota R, Sony P, Gupta V, et al. Comparing glaucomatous optic neuropathy in primary open angle and chronic primary angle closure glaucoma eyes by optical coherence tomography. Ophthalmic Physiol Opt. 2005;25:408–15. doi: 10.1111/j.1475-1313.2005.00304.x. [DOI] [PubMed] [Google Scholar]
- 167.Spencer AF, Sadiq SA, Pawson P, et al. Vertical optic disk diameter: discrepancy between planimetric and SLO measurements. Invest Ophthalmol Vis Sci. 1995;36:796–803. [PubMed] [Google Scholar]
- 168.Spencer AF, Vernon SA. Optic disc measurement: a comparison of indirect ophthalmoscopic methods. Br J Ophthalmol. 1995;79:910–5. doi: 10.1136/bjo.79.10.910. [DOI] [PMC free article] [PubMed] [Google Scholar]
- 169.Sturmer J, Poinoosawmy D, Broadway DC, et al. Intra- and inter-observer variation of optic nerve head measurements in glaucoma suspects using disc-data. Int Ophthalmol. 1992;16:227–33. doi: 10.1007/BF00917966. [DOI] [PubMed] [Google Scholar]
- 170.Swindale NV, Stjepanovic G, Chin A, et al. Automated analysis of normal and glaucomatous optic nerve head topography images. Invest Ophthalmol Vis Sci. 2000;41:1730–42. [PubMed] [Google Scholar]
- 171.Takamoto T, Schwartz B. Reproducibility of photogrammetric optic disc cup measurements. Invest Ophthalmol Vis Sci. 1985;26:814–7. [PubMed] [Google Scholar]
- 172.Tezel G, Trinkaus K, Wax MB. Alterations in the morphology of lamina cribrosa pores in glaucomatous eyes. Br J Ophthalmol. 2004;88:251–6. doi: 10.1136/bjo.2003.019281. [DOI] [PMC free article] [PubMed] [Google Scholar]
- 173.Tielsch JM, Katz J, Quigley HA, et al. Diabetes, intraocular pressure, and primary open-angle glaucoma in the Baltimore Eye Survey. Ophthalmology. 1995;102:48–53. doi: 10.1016/s0161-6420(95)31055-x. [DOI] [PubMed] [Google Scholar]
- 174.Tielsch JM, Sommer A, Katz J, et al. Racial variations in the prevalence of primary open-angle glaucoma. The Baltimore Eye Survey JAMA. 1991;266:369–74. [PubMed] [Google Scholar]
- 175.Tomita G. The optic nerve head in normal-tension glaucoma. Curr Opin Ophthalmol. 2000;11:116–20. doi: 10.1097/00055735-200004000-00009. [DOI] [PubMed] [Google Scholar]
- 176.Tomita G, Nyman K, Raitta C, et al. Interocular asymmetry of optic disc size and its relevance to visual field loss in normal-tension glaucoma. Graefes Arch Clin Exp Ophthalmol. 1994;232:290–6. doi: 10.1007/BF00194478. [DOI] [PubMed] [Google Scholar]
- 177.Tsai CS, Zangwill LM, Gonsalez C, et al. Ethnic differences in optic nerve head topography. J Glaucoma. 1995;4:248–57. [PubMed] [Google Scholar]
- 178.Tuulonen A, Airaksinen PJ. Optic disc size in exfoliative, primary open angle, and low-tension glaucoma. Arch Ophthalmol. 1992;110:211–3. doi: 10.1001/archopht.1992.01080140067029. [DOI] [PubMed] [Google Scholar]
- 179.Varma R, Douglas GR, Steinmann WC, et al. A comparative evaluation of three methods of analyzing optic disc topography. Ophthalmic Surg. 1989;20:813–9. [PubMed] [Google Scholar]
- 180.Varma R, Paz SH, Azen SP, et al. The Los Angeles Latino Eye Study: design, methods, and baseline data. Ophthalmology. 2004;111:1121–31. doi: 10.1016/j.ophtha.2004.02.001. [DOI] [PubMed] [Google Scholar]
- 181.Varma R, Tielsch JM, Quigley HA, et al. Race-, age-, gender-, and refractive error-related differences in the normal optic disc. Arch Ophthalmol. 1994;112:1068–76. doi: 10.1001/archopht.1994.01090200074026. [DOI] [PubMed] [Google Scholar]
- 182.Watkins R, Panchal L, Uddin J, et al. Vertical cup-to-disc ratio: agreement between direct ophthalmoscopic estimation, fundus biomicroscopic estimation, and scanning laser ophthalmoscopic measurement. Optom Vis Sci. 2003;80:454–9. doi: 10.1097/00006324-200306000-00012. [DOI] [PubMed] [Google Scholar]
- 183.Weinreb RN. Assessment of optic disc topography for diagnosing and monitoring glaucoma. Arch Ophthalmol. 1998;116:1229–31. doi: 10.1001/archopht.116.9.1229. [DOI] [PubMed] [Google Scholar]
- 184.Wollstein G, Garway-Heath DF, Hitchings RA. Identification of early glaucoma cases with the scanning laser ophthalmoscope. Ophthalmology. 1998;105:1557–63. doi: 10.1016/S0161-6420(98)98047-2. [DOI] [PubMed] [Google Scholar]
- 185.Wollstein G, Ishikawa H, Wang J, et al. Comparison of three optical coherence tomography scanning areas for detection of glaucomatous damage. Am J Ophthalmol. 2005;139:39–43. doi: 10.1016/j.ajo.2004.08.036. [DOI] [PubMed] [Google Scholar]
- 186.Wu SY, Nemesure B, Leske MC. Refractive errors in a black adult population: the Barbados Eye Study. Invest Ophthalmol Vis Sci. 1999;40:2179–84. [PubMed] [Google Scholar]
- 187.Yamazaki Y, Hayamizu F, Miyamoto S, et al. Optic disc findings in normal tension glaucoma. Jpn J Ophthalmol. 1997;41:260–7. doi: 10.1016/s0021-5155(97)00052-x. [DOI] [PubMed] [Google Scholar]
- 188.Yucel YH, Gupta N, Kalichman MW, et al. Relationship of optic disc topography to optic nerve fiber number in glaucoma. Arch Ophthalmol. 1998;116:493–7. doi: 10.1001/archopht.116.4.493. [DOI] [PubMed] [Google Scholar]
- 189.Zangwill LM, Berry CC, Weinreb RN. Optic disc topographic measurements after pupil dilation. Ophthalmology. 1999;106:1751–5. doi: 10.1016/S0161-6420(99)90349-4. [DOI] [PubMed] [Google Scholar]
- 190.Zangwill LM, Weinreb RN, Beiser JA, et al. Baseline topographic optic disc measurements are associated with the development of primary open-angle glaucoma: the Confocal Scanning Laser Ophthalmoscopy Ancillary Study to the Ocular Hypertension Treatment Study. Arch Ophthalmol. 2005;123:1188–97. doi: 10.1001/archopht.123.9.1188. [DOI] [PubMed] [Google Scholar]
- 191.Zangwill LM, Weinreb RN, Berry CC, et al. Racial differences in optic disc topography: baseline results from the confocal scanning laser ophthalmoscopy ancillary study to the ocular hypertension treatment study. Arch Ophthalmol. 2004;122:22–8. doi: 10.1001/archopht.122.1.22. [DOI] [PubMed] [Google Scholar]
- 192.Zangwill LM, Weinreb RN, Berry CC, et al. The confocal scanning laser ophthalmoscopy ancillary study to the ocular hypertension treatment study: study design and baseline factors. Am J Ophthalmol. 2004;137:219–27. doi: 10.1016/j.ajo.2003.08.031. [DOI] [PubMed] [Google Scholar]