

Abstract
F10, a subline of the B16 mouse melanoma cell line, is itself the parent of the more metastatic BL6 line. BL6 cells differ from F10 cells by an alteration of the gene encoding the B56γ regulatory subunit of protein phosphatase 2A (PP2A), which results in the expression of a truncated variant of the subunit (Δγ1). PP2A is involved in regulating the cell-cycle checkpoint and we found that the checkpoint in BL6 cells is aberrant when the Δγ1 protein is expressed. That is, although Δγ1 protein levels in cultured BL6 cells are low and these cells do not show an altered checkpoint on γ-irradiation, irradiated footpad BL6 tumor cells show both a marked increase in Δγ1 levels and more extensive polyploidy and less apoptosis than F10 cells. These observations were reproduced with Δγ1 gene-transfected F10 cells (F10Δγ1). Δγ1 expression and an aberrant checkpoint are also associated with a higher metastatic ability because irradiated F10Δγ1 tumors metastasized much more frequently than F10 tumors, which rarely metastasized whether irradiated or not. Nonirradiated F10Δγ1 tumors, which do not express Δγ1 protein, had similarly low rates of metastasis. The greater metastatic ability of irradiated F10Δγ1 tumors also correlated with the acquisition of many more genomic alterations. Thus, it seems that Δγ1 expression may damage the checkpoint, which may then allow the acquisition of genetic alterations that promote metastasis. These observations support the notion that mechanisms promoting the genetic instability of tumors could also aid tumor progression from the nonmetastatic to the metastatic state.
Two well-known properties of tumor cells are that they are genetically unstable 1,2 and tend to progress toward increasing malignancy. 3 As early as 1986, Nowell 4 drew a link between these two characteristics when he predicted that the genetic instability of tumor cells could contribute to disease progression by generating subclones with different properties. Consistent with this hypothesis, human tumor cells often have mutations in the genes that play essential roles in the cell-cycle checkpoint, an intracellular event that protects the integrity of the genome against genotoxic stress. 1,5 For example, the p53 tumor suppressor gene, which plays a pivotal role in the checkpoint, is mutated in more than half of a wide variety of sporadically occurring human tumors. 1,5 An intact cell-cycle checkpoint responds to DNA damage by either arresting cell-cycle progression, thereby facilitating DNA repair, or by initiating an apoptotic pathway that eliminates the damaged cell. 6 However, when the checkpoint fails, the cell-cycle progresses despite the DNA damage and can occasionally result in chromosomal aberration, 6 extensive polyploidy, 7 and reduced apoptosis. 8 Consequently, checkpoint failure is postulated to contribute to malignant progression by generating multiple subclones in a tumor. 1,2 This is supported by the work of Cifone and Fidler, 9 who showed that the increasing metastatic potential of murine fibrosarcoma cells is associated with an increased genetic instability.
Metastasis is the most malignant characteristic of a tumor and can be considered as the final stage of tumor progression. 3 It is difficult to show clearly that genetic instability is directly responsible for the metastasis of clinical tumor cells, but studies with experimental tumors that can be transplanted into animals may be useful in investigating this issue. This is because it is often possible to select sublines with increased metastatic ability from a parental tumor population, 3 whose heterogeneity seems to arise from its genetic instability. 3,10 One of the best known examples of this is the selection of the F10 and BL6 sublines from B16 mouse melanoma cells. 11,12 Although the BL6 subline was derived from F10 cells by six rounds of in vitro selection, it is markedly more metastatic than its parent. That is, while both cells metastasize to the lungs after being injected intravenously into mice, BL6 cells will metastasize to the lungs even after being injected subcutaneously. 12 According to the hypothesis proposed by Nowell, 4 it may be that BL6 cells are genetically more unstable than F10 cells and that this has led to the accumulation of a number of genomic alterations that increased their metastatic ability.
We addressed this issue by examining the difference in gene expression between the F10 and BL6 sublines. 13-18 We found that in BL6 cells, a type of retrotransposon had been inserted into an intronic region of the gene encoding the B56γ regulatory subunit of protein phosphatase type 2A (PP2A). 15 PP2A consists of a series of serine/threonine phosphatase holoenzymes that are composed of a common dimeric core of invariable catalytic (C) and structural (A) subunits associated with a variable regulatory (B) subunit. 19 The regulatory subunit is extremely diverse because it is constituted by members from at least three unrelated families, namely, PR55 (or simply B), B56 (B′), and PR72 (B″). 20 Each of these families in turn consists of several subfamilies, each of which contains several proteins resembling each other structurally. For example, the B56γ subfamily belongs to the B56 family and consists of three alternative splicing isoforms, B56γ1, -γ2, and -γ3. In BL6 cells, the rearrangement of the gene encoding the B56γ regulatory subunit results in the abundant expression of a chimeric mRNA in which the 5′ part of the original B56γ subunit mRNA is replaced with the retrotransposon sequence. 15 The chimeric mRNA encodes a mutant protein, termed Δγ1, that lacks the N-terminal 65 amino acid residues of B56γ1. Δγ1 protein expression is undetectable in in vitro-grown BL6 cells. However, when BL6 cells are transplanted into mice and undergo metastasis, Δγ1 expression is detectable in the metastatic foci but not in the transplantation site. 15
The diversity of the regulatory subunit of PP2A results in different PP2A holoenzymes with distinct substrate specificities and subcellular localizations. 20 This allows PP2A to regulate a variety of cellular processes. Studies with yeast, 21 Xenopus oocytes, 22 and mammalian cells 23-25 reveal that one of the most important functions of PP2A is to participate in the regulation of the cell-cycle checkpoint. Our previous work showed that Δγ1 prevents the B56γ1-containing PP2A heterotrimer from dephosphorylating its specific substrates. 15 Consistent with this inhibitory effect of Δγ1, NIH3T3 cells that stably express Δγ1 are defective in cell-cycle checkpoint regulation when exposed to γ-radiation. 15 This suggests that BL6 cells may also be defective in checkpoint regulation when Δγ1 is expressed.
In the present study, we found that the ability of the cell-cycle checkpoint in BL6 cells to respond appropriately to γ-radiation is indeed inferior to that in F10 cells when the cells are grown in vivo and express Δγ1. These characteristics of BL6 cells were reproduced in F10 cells transfected with Δγ1 (F10Δγ1). F10 cells transfected with Δγ1 also showed an increased metastatic ability after being grown in mouse footpads and then irradiated. The metastatic colonies of these cells were found to have acquired considerable numbers of genomic alterations relative to the genomes of the primary lesions. Such alterations were infrequently detected in the more rarely occurring metastatic colonies of F10 cells. These observations suggest that Δγ1 expression could have caused the checkpoint of BL6 cells to degenerate, thereby helping BL6 cells to acquire multiple genetic alterations that promote their metastatic ability.
Materials and Methods
Cell Culture and Transfection
B16 melanoma sublines F10 and BL6 were kindly provided by Dr. I. J. Fidler (University of Texas). NIH3T3 mouse fibroblastic cells were purchased from the American Type Culture Collection (Manassas, VA). All cells were maintained in Dulbecco’s modified Eagle’s medium with 10% fetal calf serum. Construction of the plasmid vector encoding Δγ1 and transfection of F10 and NIH3T3 cells with this plasmid or the empty vector have been described previously. 15 After the transfection, subclones of F10 and NIH3T3 cells were selected with 1.5 and 1.0 mg/ml of G-418, respectively. The cell-doubling time was determined by counting cells in triplicate samples at 24-, 48-, and 72-hour intervals as described previously. 18
In Vitro γ-Irradiation and Cell-Cycle Analysis
Cells growing exponentially in culture dishes were γ-irradiated using a 137Cs AECL Gamma cell 40 γ-irradiator (Nordion, Ottawa, Ontario, Canada) at a dose rate of 1.1 Gy/minute. Cells were subsequently cultured for the indicated time periods, fixed in 70% ethanol at −20°C, treated with RNase, stained with propidium iodide (PI; Sigma, St. Louis, MO), and analyzed by FACScan (Becton Dickinson, Franklin Lakes, NJ).
Tumor Growth, in Vivo γ-Irradiation, and Cell-Cycle Analysis
Cells (1 × 10⁵) were injected subcutaneously into the right footpads of 4-week-old male C57BL/6 mice. Tumor size was monitored by measuring the anteroposterior diameter with calipers three or more times a week. Tumor-bearing mice were anesthetized, placed in a lead box that shields the entire trunk and head, and the right foot was extended outside through a hole in the side of the box. Radiation was delivered over the box with a collimated beam in a Radioflex 350 irradiator (Rigaku Co. Ltd., Osaka, Japan) at a dose rate of 1.5 Gy/minute. Control mice were anesthetized and placed in a lead box but received no γ-irradiation. Tumor cell masses were removed from the footpads by cutting out the skin tissue and single tumor-cell suspensions were obtained as described previously. 26,27 Briefly, the tumor mass was minced with sharp scissors and passed first through a 23-gauge needle and then a nylon net (pore size 40 μm). During the latter procedure, phosphate-buffered saline (PBS) was poured continuously over the net. The tumor-cell suspension was washed twice with PBS by centrifugation and resuspension. The cells were fixed in 70% ethanol at −20°C, treated with RNase, stained with PI (Sigma) and analyzed by FACScan (Becton Dickinson).
Spontaneous Metastasis Assay Combined with in Vivo γ-Irradiation
Mice were inoculated subcutaneously with F10, 10Δγ1, F10Vec, or BL6 cells, and half received γ-irradiation locally to the footpads. On the day the footpad tumors reached a diameter of 6 mm, they were excised along with the popliteal lymph node. The mice were allowed to survive an additional 4 weeks after which autopsies were performed to macroscopically count the metastatic colonies that had formed in the bilateral lungs. All experiments included five to seven mice per group and were reproduced twice.
In Situ Detection of DNA Fragmentation
Tumor cell masses were removed from the footpads by cutting out the skin tissue which was then fixed with 4% paraformaldehyde, embedded in paraffin, and cut into 4-μm-thick slices. DNA fragmentation was detected with the fluorescein-based terminal deoxynucleotidyl transferase-mediated nick-end labeling (TUNEL) assay using the DeadEnd Fluorometric TUNEL system (Promega, Madison, WI) according to the manufacturer’s instructions. Briefly, sections were stained with the TUNEL regent and PI and observed through a ×40 objective of a confocal laser-scanning microscope (LSM510; Carl Zeiss, OberKochen, Germany). The high-power field contained ∼100 tumor cells. After images were created on the computer monitor of the LSM510 system, sections were washed with distilled water and stained with hematoxylin and eosin (H&E). To quantify apoptosis of tumor cells, the areas where tumor cells grew compact were observed. Tumor samples were obtained from two individual mice before and after irradiation, and 10 randomly selected high-power fields were examined in each sample. The proportions of TUNEL-positive cells to the total cell number were pooled and the mean and SE were calculated. All experiments were reproduced once.
Western Blot Analysis
The production and specificity of the anti-B56γ antibody has been described previously. 15 Tumor cells growing in culture, in the footpads and in the lungs were lysed in a buffer containing 10 mmol/L Tris-HCl, pH 8.0, 1 mmol/L ethylenediaminetetraacetic acid, 0.5% Nonidet P-40, 1 mmol/L phenylmethylsulfonyl fluoride. The resulting lysates were separated on 10% sodium dodecyl sulfate-polyacrylamide gel electrophoresis gels, transferred to Immobilon (Millipore, Bedford, MA), and reacted with the anti-B56γ antibody. After washing, the blots were incubated with peroxidase-labeled anti-rabbit IgG antibody (MBL Co. Ltd., Nagoya, Japan) and then reacted with Renaissance reagents (NEN, Boston, MA) before exposure. After stripping, the blot was reacted with the anti-α-tubulin monoclonal antibody (Sigma), whose binding was detected with a peroxidase-labeled anti-mouse IgG antibody (MBL Co. Ltd.).
Clonogenic Survival Assay
Cells (n = 3000) were plated in a 10-cm culture dish. The following day, after the cells had attached to the plate, they were γ-irradiated with single doses ranging from 2 to 10 Gy. The cells were grown for another 10 days without changing the medium and then stained with Giemsa solution (Sigma). Colonies containing >50 cells were counted. The number of colonies in the plate receiving γ-irradiation was divided by the number not receiving γ-irradiation and expressed as survival fraction. Each experiment was done in triplicate and repeated three times.
Cytogenic and Genomic DNA Analysis of Mouse Tumors
Mice were treated with the protocol of the spontaneous metastasis assay combined with in vivo γ-irradiation. Footpad tumors were isolated aseptically by amputation from the mice who were not γ-irradiated, and lung metastatic colonies were isolated at autopsy from the mice who were γ-irradiated. A single metastatic colony was isolated from each mouse. Tumor cell masses were minced with sharp scissors in Dulbecco’s modified Eagle’s medium/10% fetal calf serum supplemented with G-418 (1.5 mg/ml) and proliferating adherent cells from these preparations were used for cytogenetic chromosome analysis and DNA extraction. For cytogenetic analysis, the chromosomes were stained with Giemsa solution as described previously. 14,17 To extract genomic DNA, cells were digested with 1 mg/ml of proteinase K for 3 hours at 55°C, followed by 0.5 mg/ml of RNase treatment for 1 hour and then phenol:chloroform extraction and ethanol precipitation. DNA was subjected to intersimple sequence repeat polymerase chain reaction (inter-SSR PCR) analysis according to the procedure of Basik and colleagues 28 but with the minor modification described by Jackson and Matthews. 29 (CA)8AG and (CA)8GG primers were synthesized and the 5′ ends of a proportion of the primers were labeled with an infrared fluorescence dye (IRD 800; Nisshinbo, Chiba, Japan). PCR amplification was performed in 20-μl volumes containing 200 nmol/L of labeled primer [a 1:1 mixture of (CA)8AG and (CA)8GG] and 800 nmol/L of unlabeled primer of the same mixture. In addition, the reaction contained 50 ng of genomic DNA and 0.2 μl of Ex Taq polymerase (Takara, Ohtsu, Japan) in PCR buffer (10 mmol/L Tris-HCl, pH 9.0, 2% formamide, 50 mmol/L KCl, 0.2 mmol/L dNTPs, 1.5 mmol/L MgCl2, 0.01% gelatin, and 0.01% Triton X-100). The thermal profile consisted of an initial denaturation for 3 minutes at 94°C followed by 30 cycles of 30 seconds at 94°C, 45 seconds at 52°C, and 2 minutes at 72°C, and a final extension for 7 minutes at 72°C. After denaturing the samples, a 2-μl aliquot of each PCR mixture was loaded onto a 3% polyacrylamide gel containing 5.2 mol/L of urea and visualized on the Base ImagIR DNA analyzer (model 4000L; Li-Cor, Lincoln, NE). Experiments were reproduced at least twice. Four primary tumors were examined for each cell type and all yielded a similar electrophoretic band pattern. Electrophoretic bands of the primary tumor and metastatic colony of the same cell type were compared. A genomic alteration index 28 was determined by dividing the number of altered and lost bands in the metastatic colony DNA by the total number of bands in the primary tumor DNA.
Statistical Analysis
The t-test, the Mann-Whitney U-test, and the chi-square test were performed using StatView (Abacus Concepts Inc., Cary, NC) software on a Macintosh computer. Data are given as mean ± SE. A P value of <0.05 was considered to be significant.
Results
The DNA Damage Checkpoint in BL6 Cells Is Defective When the Cells Are Grown in Vivo
To examine the integrity of the DNA damage checkpoints in F10 and BL6 cells, we monitored the cell-cycle profile of both cells after they were cultured and then γ-irradiated (Figure 1) ▶ . Before γ-irradiation, most of the cells had a 2N DNA content (G1 phase) while a smaller but significant fraction contained 4N DNA (G2/M phase). A few cells had a DNA content greater than 2N but less than 4N (S phase). A day (24 hours) after γ-irradiation, both the F10 and BL6 cells showed a decrease in 2N DNA cells and an increase in 4N DNA cells, indicating cell-cycle arrest in the G2/M phase but not in G1. The next day (48 hours), considerable numbers of F10 and BL6 cells had an 8N DNA content. These polyploid cells had probably exited mitosis and initiated a new round of DNA replication without cytokinesis. After 2 more days, the polyploid fraction decreased and cells with a sub-G1 DNA content appeared, indicating that the polyploid cells were proceeding to apoptosis. By 7 days after irradiation, the 8N- and sub-G1 DNA-containing cells had become much less frequent and both F10 and BL6 cells had returned to their original diploid state. Obvious differences between F10 and BL6 cells in this pattern were not observed.
Figure 1.
Cell-cycle response of F10, F10Δγ1, and BL6 cells to in vitro γ-irradiation. Cells were grown in vitro and γ-irradiated by a single 8-Gy dose. On the days indicated after irradiation, cells were harvested, stained with PI, and examined by FACS. The proportion (%) of cells with a sub-G1 DNA content is shown at the top of some histograms.
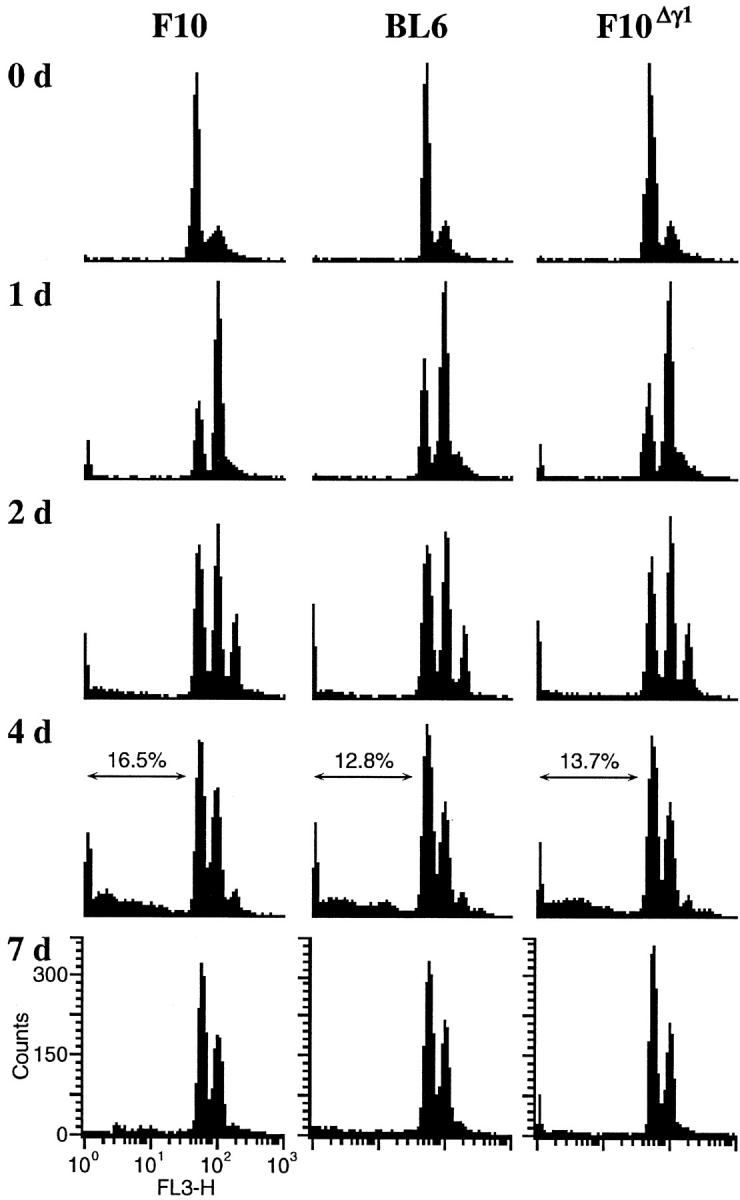
We next examined the response to γ-irradiation by F10 and BL6 cells grown in vivo. Two weeks after both cell types were inoculated into mouse footpads, tumors grew up to ∼4 mm in diameter and were γ-irradiated by a single 12 Gy dose. At various times throughout the following week, cells from the F10 and BL6 footpad tumor masses were excised and their DNA content examined (Figure 2) ▶ . F10 cells exhibited a cell-cycle profile quite similar to that observed after in vitro γ-irradiation. In contrast, BL6 cells responded to in vivo γ-irradiation by extending the degree of polyploidy and reducing the rate of apoptosis. Two and 4 days after γ-irradiation, the BL6 cells were highly polyploid, having a 16N or 32N DNA content (Figure 2) ▶ . In addition, there was only a small accumulation of BL6 cells in a sub-G1 fraction compared to the F10 cells (Figure 2) ▶ . Finally, by 7 days after irradiation, while both F10 and BL6 cells were primarily diploid, a small proportion of the BL6 cells remained polyploid with an 8N DNA content. These observations indicate that the DNA damage checkpoint in BL6 cells is less capable of responding appropriately to γ-irradiation than the checkpoint in F10 cells. However, this difference manifests itself only when the cells are γ-irradiated in in vivo growing conditions.
Figure 2.

Cell-cycle response of F10, F10Δγ1, and BL6 cells to in vivo γ-irradiation. Cells were injected into mouse footpads and locally γ-irradiated by a single 12-Gy dose 2 weeks after the injection. On the days indicated after irradiation, tumor cell masses were excised from the footpad tumors and passed through a mesh. The resulting tumor cell suspension was stained with PI and examined by FACS. The proportion (%) of cells with a sub-G1 DNA content is shown at the top of some histograms. The single peaks marked by vertical arrows represent mouse stromal cells.
Poor Checkpoint Integrity Is Associated with Radiation-Induced Expression of Δγ1 Protein
The observations described above may relate to our previous finding that Δγ1 protein is expressed in BL6 cells only when they are grown in metastatic foci. 15 When we measured the levels of Δγ1 protein, we found that γ-irradiation of in vitro-grown BL6 cells did not alter the negligible levels of Δγ1 expression (Figure 3A) ▶ but that irradiation of in vivo-grown BL6 cells strikingly increased Δγ1 protein levels 2 and 3 days after the irradiation (Figure 3B) ▶ . The protein level of the B56γ1 isoform was concomitantly slightly decreased but the level of the B56γ2 isoform was unaltered. Two days after the emergence of Δγ1 expression, Δγ1 expression fell below the detection limit. The expression levels of the B56γ1 and -γ2 isoforms in irradiated in vivo-grown F10 cells were primarily unchanged in the week after the irradiation (Figure 3B) ▶ .
Figure 3.

Protein expression of the B56γ subunit isoforms and Δγ1 in F10, F10Δγ1, and BL6 cells after in vitro (A) and in vivo (B) γ-irradiation. Cells were grown in culture or in mouse footpads and γ-irradiated by single 8- and 12-Gy doses, respectively. On the days indicated after irradiation, cell lysates were extracted from cultured cells and footpad tumors, electrophoresed, and blotted with anti-B56γ antibody. Arrowheads indicate the normal B56γ isoforms and Δγ1.
To further examine the possible involvement of Δγ1 in the defective checkpoint of BL6 cells, we transfected F10 cells with Δγ1 cDNA. We isolated >10 F10 transfectants but all had a very low or undetectable expression of the Δγ1 protein when they were grown in vitro regardless of whether they were irradiated or not (data not shown). This suggested that the transfected F10 cells may express Δγ1 protein only when grown in vivo, as is the case with BL6 cells. We thus tested the F10 transfectants for Δγ1 protein expression when grown in mice and found that Δγ1 protein levels were markedly increased from their negligible baseline level when the tumor site was γ-irradiated (Figure 3B) ▶ . The Δγ1 expression profile in the F10 transfectants throughout the week after γ-irradiation was essentially similar to that in BL6 cells. Furthermore, as seen in BL6 cells, the protein level of the B56Δγ1 isoform was decreased when the exogenous Δγ1 was expressed while the B56γ2 isoform levels remained primarily unaltered (Figure 3B) ▶ . It thus appears that Δγ1 may down-regulate the expression of wild-type B56γ1, although the molecular basis for this is presently unclear. In this study, the results of only one Δγ1-transfected F10 subclone, denoted F10Δγ1, are shown because the other two subclones examined showed essentially identical results. A vector-transfected F10 subclone, denoted F10Vec, was used as a negative control.
F10Δγ1 Cells Show Poor Checkpoint Response to Irradiation
We monitored the cell-cycle profile of F10Δγ1 and F10Vec cells after in vitro γ-irradiation and found that the profiles of both cells were quantitatively identical to that of F10 cells (Figure 1 ▶ ; data not shown). In contrast, when they were grown in vivo and irradiated, there was a significant difference in the response because F10Vec cells responded similarly to F10 cells while F10Δγ1 cells responded similarly to BL6 cells (Figure 2 ▶ ; data not shown). The extensive polyploidy and reduction in apoptosis were somewhat more profound in F10Δγ1 cells than in BL6 cells. These results suggest that the poor response to irradiation by the checkpoint in BL6 cells compared to F10 cells is because of the expression of Δγ1.
The differential apoptotic responses in irradiated F10 and F10Δγ1 tumors were examined by detecting DNA fragmentation in situ. Before irradiation and 4 days later, tumor tissues were excised and stained with TUNEL and PI. As PI stains all nuclei red and TUNEL stains apoptotic nuclei green, apoptotic cells were identified as those with yellow nuclei. Few or no apoptotic cells were detectable in the nonirradiated tumors derived from either F10 or F10Δγ1 cells (data not shown). Four days after irradiation, apoptotic cells were occasionally observed in F10 tumors (Figure 4) ▶ and H&E staining confirmed that these apoptotic cells were pyknotic F10 cells (Figure 4) ▶ . In F10 tumors, the proportion of TUNEL-positive apoptotic cells to the total cell number was 14.4%. In contrast, there were few apoptotic cells in the irradiated F10Δγ1 tumors (Figure 4) ▶ .
Figure 4.
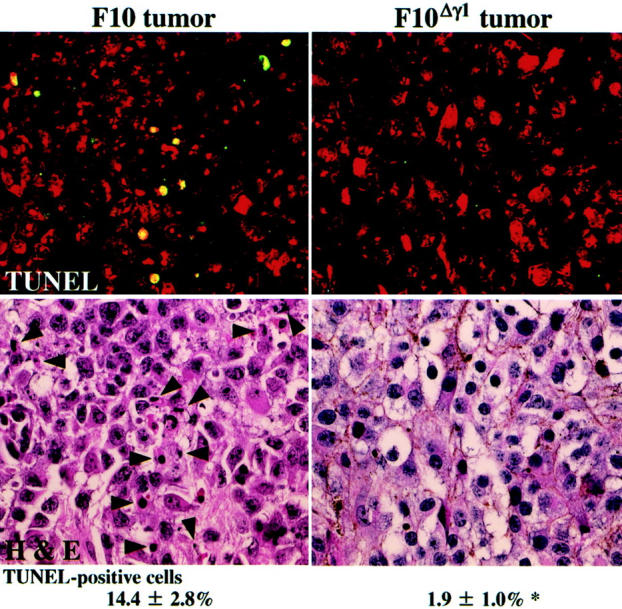
In situ detection of DNA fragmentation in footpad tumors derived from F10 and F10Δγ1 cells. Sections of the tumor tissues 4 days after irradiation were stained with the fluorescein-based TUNEL regent and PI and observed with the LSM510 microscope (top). TUNEL-positive cells contain yellow nuclei because the nuclei of all cells were also stained red with PI. After washing, the same sections were stained with H&E (bottom). Arrowheads indicate TUNEL-positive cells (top). The mean proportions of TUNEL-positive cells appear under the histological images. *, P < 0.05 by t-test when compared with the value of F10 tumors. Original magnifications, ×400.
Effects of Δγ1 on Cell-Cycle Checkpoint of NIH3T3 Cells
We previously established an NIH3T3 cell clone (NIH3T3Δγ1) that stably expresses Δγ1 at a level equivalent to that of the endogenous B56γ1. 15 Before irradiation, the cell-cycle profile of NIH3T3Δγ1 cells was similar to that of original NIH3T3 cell line or vector-control (NIH3T3Vec) cells (Figure 5) ▶ . Consistent with this is that the cell-doubling time was comparable among the three cell types [NIH3T3, 17.5 ± 2.9; NIH3T3Vec, 17.9 ± 2.9; NIH3T3Δγ1, 18.0 ± 3.0 (hour)]. Cultured cells were then γ-irradiated and their cell-cycle profile examined. In the 12 hours after γ-irradiation, the 4N DNA cell fractions of the NIH3T3 and NIH3T3Vec lines expanded, indicating cell-cycle arrest in the G2/M phase. Half of the NIH3T3 and NIH3T3Vec cells still contained 4N DNA after 24 hours of γ-irradiation and it took another 24 hours for both cell types to primarily revert to their original state. In contrast, 12 hours after γ-irradiation, the 2N and 4N DNA cell fractions of the NIH3T3Δγ1 line expanded and the line returned to its original state as early as 24 hours after irradiation (Figure 5) ▶ . This indicates that the arrest of NIH3T3Δγ1 cells in the G2/M phase after γ-irradiation was only transient.
Figure 5.
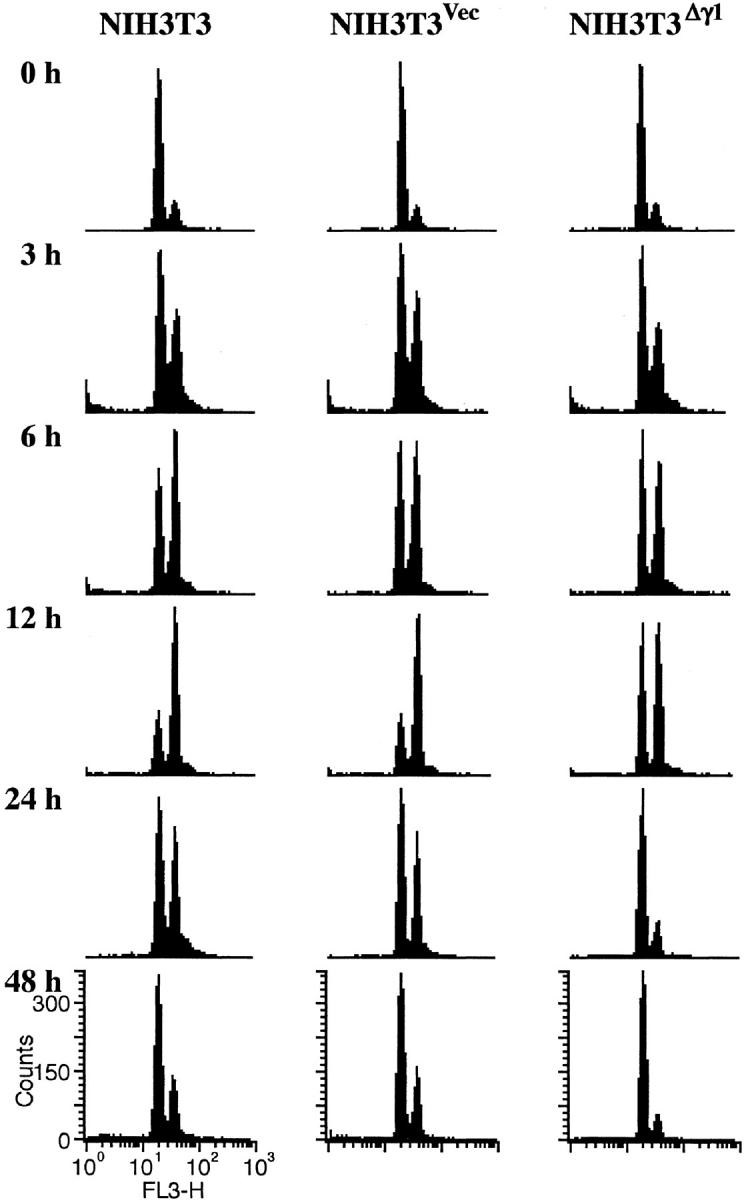
Cell-cycle response of NIH3T3, NIH3T3Vec, and NIH3T3Δγ1 cells to in vitro γ-irradiation. Cells were grown in vitro and γ-irradiated by a single 8-Gy dose. On the days indicated after irradiation, cells were harvested, stained with PI, and examined by FACS.
Growth Response of F10 and Its Subclone Cells to in Vitro and in Vivo γ-Irradiation
In vitro radiation sensitivity was assessed by the standard clonogenic survival assay (Figure 6A) ▶ . In this assay, the plating efficacy of F10 and its transfected subclones was >70% and did not differ between the cell lines. When the cells were γ-irradiated by single doses ranging from 2 to 10 Gy and their survival measured, there was little difference in the in vitro radiation sensitivity among F10 and its transfected subclones. The sensitivity of BL6 cells was also similar to that of F10 cells.
Figure 6.

Growth response of F10 and F10Δγ1 to in vitro and in vivo γ-irradiation. A: Clonogenic survival of F10, F10Δγ1, and BL6 cells after γ-irradiation. The day after plating, the cells were γ-irradiated with single doses ranging from 2 to 10 Gy. After culturing for 10 days, the numbers of colonies were counted and expressed as survival fractions. The mean values are plotted with bars indicating the SE when larger than the symbols. Experiments were repeated three times with essentially identical results. B: Growth of footpad tumors of F10 and F10Δγ1 cells after γ-irradiation. Cells (1 × 10⁵) were injected subcutaneously into the mouse footpad. After 7 days, the footpads were γ-irradiated by a single 12-Gy dose. The anteroposterior diameters of the tumors were measured by a caliper. The mean values are plotted with bars indicating the SE when larger than the symbols. Experiments were repeated three times with essentially identical results.
Nathanson and colleagues 30 have studied the in vivo growth kinetics and metastatic properties of irradiated F10 cells in detail, and revealed that single doses ranging from 7.5 to 15 Gy are subcurative. We followed the protocol in their report and γ-irradiated the F10 footpad tumor with a single 12-Gy dose 7 days after inoculation. No tumor growth was detectable for the next 10 days (Figure 6B) ▶ but in the fourth week after inoculation the γ-irradiated tumors began to grow and by the sixth week after inoculation had reached a diameter of 6 mm. Tumors that had not been γ-irradiated reached this size around the end of the third week (data not shown). Although F10Δγ1 cells did not apoptose as frequently as F10 cells after in vivo γ-irradiation, the footpad tumors of F10Δγ1 and F10Vec cells still showed primarily the same growth kinetics as the F10 cells in this experiment. Possible reasons for this are mentioned in the Discussion.
In Vivo Irradiated F10Δγ1 Cells Show Enhanced Lung Metastatic Ability
After mice were treated according to Nathanson’s protocol, 30,31 the footpad tumors were excised when they reached a diameter of 6 mm. It took 39.0 ± 3.5 days for F10 cells to reach this diameter, 36.8 ± 1.5 days for F10Δγ1 cells, and 37.8 ± 2.3 days for F10Vec cells. This indicates that the length of days that mice were exposed to a tumor was comparable among three groups of mice inoculated with tumor cells. The mice were subsequently maintained for another 4 weeks and then autopsied. Few or no metastatic colonies were generated in the lungs of nonirradiated mice regardless of the type of F10 cell that had been inoculated (Table 1) ▶ . This observation is consistent with our previous report. 15 In contrast, when mice had been inoculated with F10Δγ1 cells and were then irradiated, the majority of the mice suffered from lung metastasis consisting of an average of 4.9 metastatic colonies (Table 1) ▶ . Mice inoculated with F10 or F10Vec cells did not exhibit this enhancement of lung metastasis on γ-irradiation. In vivo γ-irradiation also did not render BL6 cells more metastatic (data not shown).
Table 1.
Spontaneous Metastasis after in Vivo γ-Irradiation of Footpad Tumors with a Single 12-Gy Dose
| Cell | In vivo γ-irradiation | No. of mice | No. of metastatic colonies† | No. of mice bearing lung metastasis |
|---|---|---|---|---|
| F10 | No | 12 | 0, 0, 0, 0, 0, 0, 0, 0, 0, 3, 3, 6 (1.0 ± 0.3) | 3/12 |
| Yes* | 14 | 0, 0, 0, 0, 0, 0, 0, 0, 0, 0, 1, 2, 2, 8 (0.93 ± 0.58) | 4/14 | |
| F10Δγ1 | No | 13 | 0, 0, 0, 0, 0, 0, 0, 0, 0, 0, 3, 4, 7 (1.3 ± 0.72) | 3/13 |
| Yes | 11 | 0, 0, 0, 4, 4, 4, 5, 6, 6, 7, 18‡ (4.9 ± 1.5)§ | 8/11¶ | |
| F10Vec | No | 10 | 0, 0, 0, 0, 0, 0, 0, 0, 2, 9 (1.1 ± 0.90) | 2/10 |
| Yes | 10 | 0, 0, 0, 0, 0, 0, 0, 0, 4, 8 (1.2 ± 0.85) | 2/10 |
Data are pooled from two independent experiments.
*, The footpad tumors were irradiated on the 7th day after-inoculation.
†, Numbers in parentheses are the mean ± SE.
‡, P < 0.05 by Mann-Whitney U-test when compared to the values of the nonirradiated F10Δγ1 tumors or the irradiated and nonirradiated F10 and F10Vec tumors.
§, P < 0.05 by t-test when compared to the mean ± SE of the nonirradiated F10Δγ1 tumors or the irradiated and nonirradiated F10 and F10Vec tumors.
¶, P < 0.05 by chi-square test when compared to the proportions of the nonirradiated F10Δγ1 tumors or the irradiated and nonirradiated F10 and F10Vec tumors.
We examined whether Δγ1 was expressed in metastatic colonies of F10, BL6, and F10Δγ1 cells and found detectable Δγ1 protein expression in the metastatic colonies of BL6 and F10Δγ1 cells but not in the few F10 metastatic colonies (Figure 7) ▶ .
Figure 7.

Expression of the Δγ1 protein in metastatic tumors derived from in vivo γ-irradiated BL6 and F10Δγ1 cells. Mice were inoculated with F10, BL6, and F10Δγ1 cells and treated with the spontaneous metastasis assay combined with in vivo γ-irradiation. Protein samples of the footpad primary tumors (P) were obtained from the mice who had not been γ-irradiated. Protein samples of lung metastatic tumors (M) were obtained from mice who had been γ-irradiated. Samples were electrophoresed and blotted with anti-B56γ antibody. Arrowheads indicate the normal B56γ isoforms and Δγ1. After stripping, the blot was probed with the anti-α-tubulin antibody to indicate the total amount of protein loaded per lane. Representative results of more than five metastatic tumors are shown.
F10Δγ1 Cells Have More Genomic Alterations after in Vivo γ-Irradiation than F10Vec Cells
It is possible that γ-irradiation allowed F10Δγ1 cells to produce subclones endowed with increased metastatic potential. We therefore performed cytogenetic chromosome analysis to assess whether the chromosomes of the primary lesion tumor cells differed from those of the tumor cells from metastatic lesions. However, we found that the tumor cells from both lesions were cytogenetically indistinguishable from one another, regardless of the F10 cell type being examined (data not shown). We then used inter-SSR PCR analysis to detect genomic alterations in the metastatic lesions relative to the genome of the primary lesion (Figure 8) ▶ . To avoid contamination with genomes from stromal cells, we first made single cell suspensions from the excised tumor lesions of F10Δγ1 and F10Vec cells and cultured them with G-418. The survivors were then used for genome extraction. To calculate the genomic alteration index, 28 we compared the electrophoretic bands of the PCR products from the primary lesion with those from three metastatic lesions (Figure 8) ▶ . Each genomic alteration index was calculated with lesions originating from the same mouse. F10Δγ1- and F10Vec-inoculated mice that were not irradiated showed genomic alteration indices <1.0% (data not shown). Irradiation of F10Vec-inoculated mice did not alter this low index (Table 2) ▶ but in contrast, irradiated F10Δγ1-inoculated mice had a higher index of 3.7% (Table 2) ▶ .
Figure 8.

Incidence of genetic alterations in spontaneous metastases of in vivo γ-irradiated F10Vec or F10Δγ1 cells. Mice were inoculated with F10Vec or F10Δγ1 cells and treated with the spontaneous metastasis assay combined with in vivo γ-irradiation. Tumor cell masses of the footpad primary lesions (P) obtained from the mice were not γ-irradiated. Tumor cell masses of lung metastatic tumors (M) were obtained from γ-irradiated mice. Tumor cells were cultured in the presence of G-418 and survivors were subjected to DNA extraction. DNA was amplified by inter-SSR PCR and visualized on the Base ImagIR DNA analyzer. Regions of the electrophoretic gels encompassing 200 to 500 bp are shown. Arrows and arrowheads placed alongside the lanes indicate the bands from the metastatic lesions that are altered or lost compared to the bands from the primary lesions, respectively. The primary tumors from different mice gave essentially similar results and a representative result is shown (P). Results of the metastatic lesions from three mice (M1, M2, and M3) inoculated with F10Δγ1 cells and one mouse (M1) inoculated with F10Vec cells are also shown.
Table 2.
Incidence of Genomic Alterations in the Lung Metastases Relative to the Primary Tumors of in Vivo Irradiated F10Δγ1 and F10Vec Cells
| Cell | No. of metastatic colonies examined by inter-SSR PCR* | Genomic alteration index (%)† |
|---|---|---|
| F10Δγ1 | 6 | 3.1, 3.1, 3.4, 4.2, 4.2, 4.2 (3.7 ± 0.23)‡ |
| F10Vec | 4 | 0.8, 0.8, 1.0, 1.0 (0.90 ± 0.058) |
*, Parts of the results are shown in Figure 8 ▶ .
†, Numbers in parentheses are the mean ± SE.
‡, P < 0.05 by t-test when the mean was compared with the mean of F10Vec cells.
Discussion
In this study, we have examined the link between the genomic instability of tumor cells and their increasing metastatic ability by comparing the mouse melanoma cell line F10 and its more metastatic subline BL6. We revealed previously that the BL6 subline differs from F10 by a rearrangement in the gene encoding PP2A, 15 a protein known to be involved in the cell-cycle checkpoint. The rearrangement generates a chimeric protein denoted as Δγ1. We hypothesized that Δγ1 may have helped BL6 cells acquire its increased metastatic ability by inducing an aberrant cell-cycle checkpoint and thereby promoting its acquisition of genomic alterations that aid metastasis. Here we tested this hypothesis.
We found that compared to F10 cells, the checkpoint in BL6 cells is aberrant when the cells were grown in vivo and then irradiated, and that this aberration may primarily be attributed to the presence of Δγ1. This notion is supported by several observations. First, in response to in vitro γ-irradiation, F10 and BL6 cells display an equivalent defect in their checkpoints because both exhibit a transient arrest at the G2/M phase and a subsequent accumulation of a polyploid cell fraction, followed by apoptosis. This type of defect is known as the “uncoupling” of the S and M phases. 32,33 However, when BL6 and F10 cells are grown and irradiated in vivo, the BL6 cell-cycle checkpoint becomes more aberrant compared to F10 because the BL6 cells display a high degree of polyploidy that is evident for a longer period and the rate of apoptosis is reduced. In contrast, the cell-cycle profile of F10 cells is the same as that after in vitro γ-irradiation. Thus, the checkpoint of BL6 cells becomes aberrant only in certain conditions, namely, when the cells are grown in vivo and then irradiated. These are exactly the conditions in which the Δγ1 protein is expressed as the Δγ1 protein is not detected in in vitro-grown BL6 cells, whether irradiated or not, or in irradiated in vivo-grown F10 cells. Furthermore, the extension of the polyploid period in irradiated in vivo-grown BL6 cells peaks on the fourth day after irradiation and 1 or 2 days before this, Δγ1 protein levels become markedly increased in BL6 cells. Thus, the emergence of the aberrant cell-cycle checkpoint in irradiated in vivo-grown BL6 cells correlates with the synthesis of the Δγ1 protein. Supporting this correlation is that the disparate cell-cycle phenotypes of BL6 cells grown in vitro and in vivo were completely reproducible in F10Δγ1 cells, which, like BL6 cells, only express Δγ1 after in vivo γ-irradiation. Expression of Δγ1 thus appears to cripple the ability of the DNA damage checkpoint to respond appropriately to irradiation.
To further clarify the role of Δγ1 on the cell-cycle checkpoint, we used NIH3T3 cells that stably expressed exogenous Δγ1 protein at a level comparable with that of the endogenous B56γ1. As shown previously, 15 NIH3T3Δγ1 cells are defective in G2/M cell-cycle arrest after γ-irradiation. Δγ1 expression thus appears to shorten the duration that NIH3T3 cells are arrested in the G2/M phase in response to γ-irradiation. This is a somewhat different pattern to that observed in irradiated in vivo-grown BL6 and F10Δγ1 cells because these cells had an extended period of polyploidy and underwent less apoptosis. This difference can be explained by the observation that the F10 and BL6 cells not expressing Δγ1 already suffer a checkpoint defect because S/M uncoupling is observed in these cells regardless of whether or not they are irradiated. However, once grown in vivo and irradiated, BL6 and F10Δγ1 express Δγ1, which inflicts an additional checkpoint fault that causes the cells to undergo multiple rounds of DNA synthesis without arresting long enough in the G2/M phase. The extensive polyploidy exhibited by BL6 and F10Δγ1 cells may thus be attributable to a combination of S/M uncoupling and defective G2/M arrest.
Notably, in both BL6 and F10Δγ1 cells, Δγ1 protein expression occurred only when the cells were grown in vivo and irradiated. When the cells were grown and irradiated in vitro, no expression was observed. The levels of mRNA encoding Δγ1 do not differ when the cells are grown under in vivo or in vitro conditions and thus it appears that Δγ1 protein expression depends on a posttranscriptional regulation in F10Δγ1 and BL6 cells that operates only in in vivo irradiated tumors and metastatic foci. It may be that the in vivo environment enhances the translation of Δγ1 or increases its stability. Similarly to this notion, certain microenvironments in which tumor cells grow are known to change the levels of transcription of some genes. 34 For example, in colon cancer cells, several metastasis-related genes such as MDR1 and CEA are expressed differently depending not only on whether the cells are grown in vitro or in vivo but also on whether they are grown in orthotopic or ectopic environments. 34 These observations clearly indicate that performing in vivo experiments and in particular orthotopically implanting tumor cells into recipient animals are important approaches in the study of metastasis and its related fields. 35,36
Cell-cycle analysis indicated that the apoptosis rate of F10Δγ1 tumor cells after in vivo γ-irradiation is slower than that of F10 cells. A similar observations was noted when irradiated F10 or F10Δγ1 tumors were stained with the TUNEL method, as the proportion of TUNEL-positive cells was larger in F10Δγ1 tumors than in F10 tumors 4 days after γ-irradiation. Curiously, however, the footpad tumors of the two cells did not differ significantly in their growth kinetics after γ-irradiation (Figure 6B) ▶ . This discordance suggests that the apoptosis rate of tumor cells when their colonies are still microscopic does not influence subsequent tumor growth in a macroscopic level. Alternatively, the F10 tumor cells that survive apoptosis may recover their growth more rapidly than F10Δγ1 tumor cells. This latter notion is supported by the previous work comparing tumor growth of p53-wild-type cells and p53-deficient cells. 8 p53-wild-type cells are more sensitive to irradiation and thus tumors of these cells shrink more severely and rapidly after exposure to radiation. However, once the tumors begin to grow again, their growth rate is higher than that of p53-deficient tumors. As a result, the tumors of p53-wild-type cells reach their original size as quickly as the tumors of p53-deficient cells, and thereafter both tumors show similar growth kinetics. 8 The extent of apoptosis after irradiation may thus not necessarily reduce the final tumor size or growth rate.
Given that Δγ1 appears to disrupt the proper functioning of the cell-cycle checkpoint, we wondered whether the expression of Δγ1 could also be associated with the high metastatic ability of BL6 cells. We consequently combined the spontaneous metastasis assay with in vivo γ-irradiation. In these experiments, the duration that a host animal was exposed to a tumor and the final tumor size were equivalent among the various cell types examined. These are both parameters that often affect subsequent metastasis. 30,37 In addition, tumors were γ-irradiated when they were so small that metastasis might not yet have occurred. 30 Under these experimental conditions, in vivo irradiated F10Δγ1 cells had an increased metastatic ability. Moreover, Δγ1 expression was detectable in the metastatic tumors derived from irradiated F10Δγ1 cells, but not from irradiated F10 cells. These observations support the notion that the expression of Δγ1 correlates with the acquisition of greater metastatic ability.
It has been shown that local γ-irradiation at subcurative doses often increases the rate of the subsequent metastasis of various tumors in experimental models. 30,31,37 The two most likely mechanisms driving this phenomenon are that either the irradiation directly alters the cell’s genome, leading to the development of subclones with increased metastatic properties, or the irradiation facilitates the entry of tumor cells into the circulation, possibly by affecting the permeability of blood vessels, the so-called “tumor bed effect.” 37 The tumor bed effect does not appear to explain our observations because in vivo γ-irradiation does not enhance the metastasis of F10 cells. However, the comparison of the genomes between the primary and metastatic lesions supports the former possibility. Few alterations occurred in the genomes of the rare F10Vec metastatic colonies whether the primary lesions had received in vivo γ-irradiation or not. In contrast, genetic alterations were detected in the metastatic colonies of F10Δγ1 cells at an increased frequency, albeit only when the primary tumors had received in vivo γ-irradiation. The metastatic colonies of F10Δγ1 cells were not clonally identical to each other because the altered bands were not always located at the same positions in the inter-SSR PCR analysis. Thus, Δγ1-induced defect in the cell-cycle checkpoint may have contributed directly to increased mutation rates in in vivo irradiated F10Δγ1 cells. As a result, these F10Δγ1 cells appeared to allow the development of multiple subclones, some of which might be endowed with increased metastatic potential.
BL6 cells did not become more metastatic after in vivo γ-irradiation despite the fact that in vivo γ-irradiation increased Δγ1 protein levels in BL6 cells to the same degree as observed in F10Δγ1 cells. This may be simply because BL6 cells already possess as many genomic alterations as they can tolerate. Alternatively, the defect in the cell-cycle checkpoint induced by Δγ1 expression may only allow a specific type and number of genomic alterations to pass unedited into the genome, and BL6 cells may have already fully acquired this complement. It is possible that during the six rounds of in vitro selection of F10 cells that generated the BL6 line, an early event was the retrotransposon insertion into the B56γ gene that allows Δγ1 expression. This rearrangement then allowed the cells to efficiently accumulate multiple mutations in their genomes, some of which promoted metastatic ability. Supporting this is that BL6 cells are still more metastatic than in vivo irradiated F10Δγ1 cells, whether irradiated or not, because they form >20 metastatic colonies in the lungs when injected subcutaneously into the footpads. 15,16 Thus, it is likely that BL6 cells have accumulated more genomic alterations than in vivo irradiated F10Δγ1 cells when compared to F10 cells. Probably, BL6 cells either cannot tolerate any additional changes or may have acquired the full range of changes permitted by the Δγ1-induced defect in cell-cycle checkpoint.
In summary, Δγ1 expression in response to irradiation is associated with three effects: first, the degradation of checkpoint integrity; second, the acquisition of multiple genomic alterations; and third, the development of greater metastatic ability. Although the direct links between these three events remain to be proved, our observations thus suggest that Δγ1 expression, which disrupts proper PP2A functioning in the cell-cycle checkpoint, can cause all three effects. This is also supported by the observation that okadaic acid, a PP2A inhibitor, is known to promote genetic instability and tumorigenicity, probably by inhibiting the activities of PP2A, 38 although it remains unclear which of the PP2A holoenzymes are targeted by okadaic acid. Nevertheless, our current observations suggest that the B56γ-containing PP2A holoenzymes may be important in guarding genome integrity and that impairment of the function of these holoenzymes may result in malignant progression. Our observations also support the more general hypothesis that genetic instability could promote tumor progression from the nonmetastatic to the metastatic state.
Acknowledgments
We thank I. J. Fidler for B16 melanoma sublines and Patrick Hughes for critically reading the manuscript.
Footnotes
Address reprint requests to Akihiko Ito, M.D., Department of Pathology, Osaka University Medical School, 2-2 Yamada-oka, Suita, Osaka 565-0871, Japan. E-mail: aito@patho.med.osaka-u.ac.jp.
Supported by grants from the Ministry of Education, Culture, Sports, Science, and Technology; the Osaka Cancer Society; the Sagawa Foundation for Promotion of Cancer Research; and the Naito Foundation.
References
- 1.Lengauer C, Kinzler KW, Vogelstein B: Genetic instabilities in human cancers. Nature 1998, 396:643-649 [DOI] [PubMed] [Google Scholar]
- 2.Cahill DP, Kinzler KW, Vogelstein B, Lengauer C: Genetic instability and Darwinian selection in tumours. Trends Cell Biol 1999, 9:57-60 [PubMed] [Google Scholar]
- 3.Chambers AF, Hill RP: Tumor progression and metastasis. Tannock IF Hill RP eds. The Basic Science of Oncology. 1992:pp 219-239 McGraw-Hill, New York
- 4.Nowell PC: The clonal evolution of tumor cell populations. Science 1976, 194:23-28 [DOI] [PubMed] [Google Scholar]
- 5.Sherr CJ: Cancer cell cycles. Science 1996, 274:1672-1677 [DOI] [PubMed] [Google Scholar]
- 6.Paulovich AG, Toczyski DP, Hartwell LH: When checkpoints fail. Cell 1997, 88:315-321 [DOI] [PubMed] [Google Scholar]
- 7.Illidge TM, Cragg MS, Fringes B, Olive P, Erenpreisa JA: Polyploid giant cells provide a survival mechanism for p53 mutant cells after DNA damage. Cell Biol Int 2000, 24:621-633 [DOI] [PubMed] [Google Scholar]
- 8.Brown JM, Wouters BG: Apoptosis, p53, and tumor cell sensitivity to anticancer agents. Cancer Res 1999, 59:1391-1399 [PubMed] [Google Scholar]
- 9.Cifone MA, Fidler IJ: Increasing metastatic potential is associated with increasing genetic instability of clones isolated from murine neoplasms. Proc Natl Acad Sci USA 1981, 78:6949-6952 [DOI] [PMC free article] [PubMed] [Google Scholar]
- 10.Shapiro JR, Yung WK, Shapiro WR: Isolation, karyotype, and clonal growth of heterogeneous subpopulations of human malignant gliomas. Cancer Res 1981, 41:2349-2359 [PubMed] [Google Scholar]
- 11.Hart IR: The selection and characterization of an invasive variant of the B16 melanoma. Am J Pathol 1979, 97:587-600 [PMC free article] [PubMed] [Google Scholar]
- 12.Poste G, Doll J, Hart IR, Fidler IJ: In vitro selection of murine B16 melanoma variants with enhanced tissue-invasive properties. Cancer Res 1980, 40:1636-1644 [PubMed] [Google Scholar]
- 13.Nakaji T, Kataoka TR, Watabe K, Nishiyama K, Nojima H, Shimada Y, Sato F, Matsushima H, Endo Y, Kuroda Y, Kitamura Y, Ito A, Maeda S: A new member of the GTPase superfamily that is upregulated in highly metastatic cells. Cancer Lett 1999, 147:139-147 [DOI] [PubMed] [Google Scholar]
- 14.Kataoka TR, Ito A, Asada H, Watabe K, Nishiyama K, Nakamoto K, Itami S, Yoshikawa K, Ito M, Nojima H, Kitamura Y: Annexin VII as a novel marker for invasive phenotype of malignant melanoma. Jpn J Cancer Res 2000, 91:75-83 [DOI] [PMC free article] [PubMed] [Google Scholar]
- 15.Ito A, Kataoka TR, Watanabe M, Nishiyama K, Mazaki Y, Sabe H, Kitamura Y, Nojima H: A truncated isoform of the PP2A B56 subunit promotes cell motility through paxillin phosphorylation. EMBO J 2000, 19:562-571 [DOI] [PMC free article] [PubMed] [Google Scholar]
- 16.Ito A, Katoh F, Kataoka TR, Okada M, Tsubota N, Asada H, Yoshikawa K, Maeda S, Kitamura Y, Yamasaki H, Nojima H: A role for heterologous gap junctions between melanoma and endothelial cells in metastasis. J Clin Invest 2000, 105:1189-1197 [DOI] [PMC free article] [PubMed] [Google Scholar]
- 17.Watabe K, Ito A, Asada H, Endo Y, Kobayashi T, Nakamoto K, Itami S, Takao S, Shinomura Y, Aikou T, Yoshikawa K, Matsuzawa Y, Kitamura Y, Nojima H: Structure, expression and chromosome mapping of MLZE, a novel gene which is preferentially expressed in metastatic melanoma cells. Jpn J Cancer Res 2001, 92:140-151 [DOI] [PMC free article] [PubMed] [Google Scholar]
- 18.Nakamoto K, Ito A, Watabe K, Koma Y, Asada H, Yoshikawa K, Shinomura Y, Matsuzawa Y, Nojima H, Kitamura Y: Increased expression of a nucleolar Nop5/Sik family member in metastatic melanoma cells: evidence for its role in nucleolar sizing and function. Am J Pathol 2001, 159:1363-1374 [DOI] [PMC free article] [PubMed] [Google Scholar]
- 19.Usui H, Imazu M, Maeta K, Tsukamoto H, Azuma K, Takeda M: Three distinct forms of type 2A protein phosphatase in human erythrocyte cytosol. J Biol Chem 1988, 263:3752-3761 [PubMed] [Google Scholar]
- 20.Virshup DM: Protein phosphatase 2A: a panoply of enzymes. Curr Opin Cell Biol 2000, 12:180-185 [DOI] [PubMed] [Google Scholar]
- 21.Kinoshita N, Ohkura H, Yanagida M: Distinct, essential roles of type 1 and 2A protein phosphatases in the control of the fission yeast cell division cycle. Cell 1990, 63:405-415 [DOI] [PubMed] [Google Scholar]
- 22.Millward TA, Zolnierowicz S, Hemmings BA: Regulation of protein kinase cascades by protein phosphatase 2A. Trends Biochem Sci 1999, 24:186-191 [DOI] [PubMed] [Google Scholar]
- 23.Yamashita K, Yasuda H, Pines J, Yasumoto K, Nishitani H, Ohtsubo M, Hunter T, Sugimura T, Nishimoto T: Okadaic acid, a potent inhibitor of type 1 and type 2A protein phosphatases, activates cdc2/H1 kinase and transiently induces a premature mitosis-like state in BHK21 cells. EMBO J 1990, 9:4331-4338 [DOI] [PMC free article] [PubMed] [Google Scholar]
- 24.Kawabe T, Muslin AJ, Korsmeyer SJ: HOX11 interacts with protein phosphatases PP2A and PP1 and disrupts a G2/M cell-cycle checkpoint. Nature 1997, 385:454-458 [DOI] [PubMed] [Google Scholar]
- 25.Okamoto K, Li H, Jensen RM, Zhang T, Taya Y, Thorgeirsson SS, Prives C: Cyclin G recruits PP2A to dephosphorylate Mdm2. Mol Cell 2002, 9:761-771 [DOI] [PubMed] [Google Scholar]
- 26.Ito A, Morii E, Maeyama K, Jippo T, Kim DK, Lee YM, Ogihara H, Hashimoto K, Kitamura Y, Nojima H: Systematic method to obtain novel genes that are regulated by mi transcription factor: impaired expression of granzyme B and tryptophan hydroxylase in mi/mi cultured mast cells. Blood 1998, 91:3210-3221 [PubMed] [Google Scholar]
- 27.Ito A, Kataoka TR, Kim DK, Koma Y, Lee YM, Kitamura Y: Inhibitory effect on natural killer activity of microphthalmia transcription factor encoded by the mutant mi allele of mice. Blood 2001, 97:2075-2083 [DOI] [PubMed] [Google Scholar]
- 28.Basik M, Stoler DL, Kontzoglou KC, Rodriguez-Bigas MA, Petrelli NJ, Anderson GR: Genomic instability in sporadic colorectal cancer quantitated by inter-simple sequence repeat PCR analysis. Genes Chromosom Cancer 1997, 18:19-29 [PubMed] [Google Scholar]
- 29.Jackson JA, Matthews D: Modified inter-simple sequence repeat PCR protocol for use in conjunction with the LI-COR Gene ImagIR2 DNA analyzer. Biotechniques 2000, 28:914-916 [PubMed] [Google Scholar]
- 30.Nathanson SD, Westrick P, Anaya P, Hetzel FW, Jacobsen G: Relationship of spontaneous regional lymph node metastases to dose of local irradiation of primary B16 melanomas. Cancer Res 1989, 49:4412-4416 [PubMed] [Google Scholar]
- 31.Nathanson SD, Nelson L, Anaya P, Havstad S, Hetzel FW: Development of lymph node and pulmonary metastases after local irradiation and hyperthermia of footpad melanomas. Clin Exp Metastasis 1991, 9:377-392 [DOI] [PubMed] [Google Scholar]
- 32.Waldman T, Lengauer C, Kinzler KW, Vogelstein B: Uncoupling of S phase and mitosis induced by anticancer agents in cells lacking p21. Nature 1996, 381:713-716 [DOI] [PubMed] [Google Scholar]
- 33.Li Q, Dang CV: c-Myc overexpression uncouples DNA replication from mitosis. Mol Cell Biol 1999, 19:5339-5351 [DOI] [PMC free article] [PubMed] [Google Scholar]
- 34.Kitadai Y, Bucana CD, Ellis LM, Anzai H, Tahara E, Fidler IJ: In situ mRNA hybridization technique for analysis of metastasis-related genes in human colon carcinoma cells. Am J Pathol 1995, 147:1238-1247 [PMC free article] [PubMed] [Google Scholar]
- 35.Fidler IJ: Angiogenic heterogeneity: regulation of neoplastic angiogenesis by the organ microenvironment. J Natl Cancer Inst 2001, 93:1040-1041 [DOI] [PubMed] [Google Scholar]
- 36.Tsuzuki Y, Carreira CM, Bockhorn M, Xu L, Jain RK, Fukumura D: Pancreas microenvironment promotes VEGF expression and tumor growth: novel window models for pancreatic tumor angiogenesis and microcirculation. Lab Invest 2001, 81:1439-1451 [DOI] [PubMed] [Google Scholar]
- 37.Essen CF: Radiation enhancement of metastasis: review. Clin Exp Metastasis 1991, 9:77-104 [DOI] [PubMed] [Google Scholar]
- 38.Nakagama H, Kaneko S, Shima H, Inamori H, Fukuda H, Kominami R, Sugimura T, Nagao M: Induction of minisatellite mutation in NIH3T3 cells by treatment with the tumor promoter okadaic acid. Proc Natl Acad Sci USA 1997, 94:10813-10816 [DOI] [PMC free article] [PubMed] [Google Scholar]