Abstract
Autosomal-recessive osteopetrosis is a severe genetic disease caused by osteoclast failure. Approximately 50% of the patients harbor mutations of the ATP6i gene, encoding for the osteoclast-specific a3 subunit of V-ATPase. We found inactivating ATP6i mutations in four patients, and three of these were novel. Patients shared macrocephaly, growth retardation and optic nerve alteration, osteosclerotic and endobone patterns, and high alkaline phosphatase and parathyroid hormone levels. Bone biopsies revealed primary spongiosa lined with active osteoblasts and high numbers of tartrate-resistant acid phosphatase (TRAP)-positive, a3 subunit-negative, morphologically unremarkable osteoclasts, some of which located in shallow Howship lacunae. Scarce hematopoietic cells and abundant fibrous tissue containing TRAP-positive putative osteoclast precursors were noted. In vitro osteoclasts were a3-negative, morphologically normal, with prominent clear zones and actin rings, and TRAP activity more elevated than in control patients. Podosomes, αVβ3 receptor, c-Src, and PYK2 were unremarkable. Consistent with the finding in the bone biopsies, these cells excavated pits faintly stained with toluidine blue, indicating inefficient bone resorption. Bone marrow transplantation was successful in all patients, and posttransplant osteoclasts showed rescue of a3 subunit immunoreactivity.
The osteoclast vacuolar-type translocating ATPase (V-ATPase) is central to the mechanism of bone resorption. It is located in the ruffled border membrane where it releases protons underneath the resorbing lacuna, acidifying this microenvironment and permitting solubilization of the hydroxyapatite crystals. 1-3 This event requires continuous release of protons because of the high-buffering capacity of phosphates, and 8 mol of H+ are required to solubilize 1 mol of hydroxyapatite. 4 Therefore, efficient activity of the V-ATPase is mandatory for bone matrix demineralization.
The V-ATPase shares similarity with the F0-F1 ATP-synthase complex present in mitochondria, chloroplasts, and bacteria. 5-8 It consists of a V0 transmembrane proton channel and a V1 ATP hydrolytic domain. The structure of the V1 complex is well defined. It is a 570-kd peripheral protein composed of eight subunits (A to H), with three copies of the A and B subunits and single copies of the remaining subunits. The V0 transmembrane domain contains five subunits (a, d, c, c′, and c″), with six copies of c and c′, and single copies of the others. c, c′, and c″ subunits span the membrane and contribute to the organization of the proton channel. The a subunit is found in three isoforms, a1, a2, and a3, with the a3 being the one that is osteoclast-specific. 5,9-11 Transcription of this subunit increases in resorption-competent osteoclasts and the protein is transferred to the ruffled border membrane during the process of cell polarization. 12,13
The a subunit is a transmembrane glycoprotein possessing a large N-terminal hydrophilic domain and a C-terminal hydrophobic domain, containing multiple putative transmembrane helices. It has several buried charged residues that appear to be in a position to influence proton translocation. It also emerges to possess the binding site for the V-ATPase inhibitor bafilomycin. 14,15
The osteoclast-specific a3 subunit of the V-ATPase is a 116-kd glycoprotein encoded by the ATP6i gene, also known as TCIRG1. 16,17 Two transcripts arise from this gene. The OC116 is the osteoclast-specific form and is assembled from 20 exons. Another transcript, termed TIRC7, is more widely expressed. It starts from exon 5, has a translational start site located in exon 6, codon 217, and spans the remaining 14 exons. 18 ATP6i-deficient mice, by homologous recombination, show severe osteopetrosis because of loss of osteoclast-mediated extracellular acidification. 16,17 Likewise, the ATP6i gene has been found to posses recessive mutations in human osteopetrosis, and recent reports confirmed that this occurs in a large portion of the infantile malignant form of the disease. 19-21
Human osteopetrosis is a severe heterogeneous genetic disorder, characterized by dense bones prone to fracture, severe hematological failure, and neural defects. However, all these forms have a common cellular defect, consisting in impaired osteoclast bone resorption. 22,23 Various subtypes have been identified. The ATP6i-dependent one is the most common and is thought to account for ∼50% of cases in autosomal-recessive osteopetrosis, 19-21 followed by those dependent on mutations of the carbonic anhydrase type II (50 cases described to date) 24 and of the ClC7 chloride channel (2 cases of malignant and 12 families of type II benign osteopetrosis). 25,26 In many patients, however, the underlying genetic abnormality remains unclear.
Clinical manifestations of osteopetrosis are also highly variable, likely mirroring the genotype heterogeneity. 22,23 Correlation of symptoms with the genetic background is still incomplete. For instance, the carbonic anhydrase type II mutation is responsible of a form also called “marble brain disease” because of cerebral calcifications. Patients also suffer from tubular acidosis because the carbonic anhydrase type II is strongly expressed by renal tubular cells. 22-24 In the ClC7 mutation variant of the malignant osteopetrosis, retinal degeneration independent of optic nerve compression is likely to represent a specific stigma of the disease. 25 Interestingly, this gene appears to also cause type II benign autosomal dominant osteopetrosis, a milder syndrome known as Albers-Schönberg disease, in which the mutant ClCN7 gene is thought to act as a dominant-negative gene, as opposed to the malignant form in which the loss-of-function mutation does not affect heterozygous individuals. 26
Although ATP6i mutations account for most cases of autosomal recessive osteopetrosis, there is limited information on the correlation between genotype and phenotype, particularly at a cellular level. In view of this, the present study was designed to provide insights into the genetic, clinical, and cellular features in this form of the disease.
Materials and Methods
Patients
Four patients affected by ATP6i-dependent autosomal recessive infantile osteopetrosis were analyzed in this study. A summary of clinical information is shown in Table 1 ▶ . The study abides by the rules of our Internal Review Board and the tenets of the Helsinki protocol.
Table 1.
Clinical Findings
| Patient 1 | Patient 2 | Patient 3 | Patient 4 | |
|---|---|---|---|---|
| Age at diagnosis (months) | 3 | 18 | 7 | Birth |
| Death | No | No | No | No |
| Family history | Unremarkable | Unremarkable | Unremarkable | One brother affected |
| Symptoms | Macrocephaly, hydrocephaly, growth retardation, pale optic nerve papillae, fever, rhinitis, mild hypotony | Macrocephaly, hydrocephaly, growth retardation, pale optic nerve papillae, hepato-splenomegaly, dysmorphism, pale skin, muscle ipotony, and ipotrophy | Macrocephaly, dwarfism, severely reduced vision, hepato-splenomegaly, nistagmo | Macrocephaly, reduced vision, ipotony, mild hepato-splenomegaly, mild ipoacusy |
| Surgery | Anterior craniotomy for decompression | No | No | Optic channel decompression |
| Pre-BMT therapy | Vitamin D3 135 ng/kg/day | No | Prednisone 1mg/kg/day | No |
| Age at BMT (months) | 6 | 21 | 9 | 2 |
| Donor (bone marrow) | Sister | Unrelated | Unrelated | Brother |
| GVHD | Yes | Yes | No | No |
| Post-BMT follow-up | Marked improvement of osteosclerosis | Growth retardation | Severely compromised vision (both eyes) | Vision left eye <1/50 |
Materials
Cell culture media, serum, and reagents were from Gibco (Uxbridge, UK). Sterile glassware was from Falcon Becton Dickinson (Meylan, France). The anti-αvβ3 antibody, LM609, and the anti-Fc receptor (CD16) antibody were from Chemicon International Inc. (Temecula, CA). The anti pp60c-src polyclonal antibody and fluorescein isothiocyanate- or horseradish peroxidase-conjugated secondary antibodies were from Santa Cruz Biotechnology Inc. (Heidelberg, Germany). Antisera raised against the C-terminal peptide 811 to 829 (KFYSGTGYKLSPFTFAATD) of the a3 subunit of the osteoclast V-ATPase was kindly donated by Drs. J. P. Mattsson and D. Keeling (AstraZeneca, Mölndal, Sweden). The DNA extraction kit was from Stratagene (Amsterdam, The Netherlands). Reagents for polymerase chain reaction (PCR) were from Qiagen (Genenco, Florence, Italy). The nitrocellulose filter membrane and the chemiluminescence detection kit were from Amersham International plc (Chalfont Buckinghamshire, UK). Superscript II-reverse transcriptase was from Life Technologies (Milan, Italy). MwoI restriction enzyme was from New England Biolabs (Beverly, MA). Dye Terminator cycle sequencing ready reaction mix was from Perkin-Elmer Applied Biosystems (Foster City, CA). All other reagents were of the purest grade from Sigma Chemical Co. (St. Louis, MO).
Samples
Bone biopsies of the iliac crest were performed and processed for paraffin embedding. Sections were routinely stained with hematoxylin and eosin. Alternatively, sections were stained, as detailed below, to detect histochemically the tartrate-resistant acid phosphatase (TRAP) and immunocytochemically the a3 proton pump subunit.
When bone marrow samples were obtained for clinical purposes part of the material was used in this study. Bone marrow aspirates were also obtained from patient’s healthy relatives or unaffected age-matched controls. Peripheral blood samples were collected from patients and healthy donors. These materials were used with the informed consent of the patients or of their parents.
Mutation Analysis
DNA was extracted from ethylenediaminetetraacetic acid blood samples using a DNA extraction kit. The entire coding region of the 116-kd subunit was amplified using intronic primers deduced from sequence (GenBank accession number, AF033033), by the National Biosciences, Inc. OLIGO 4.1 Primer Analysis software. PCR reactions were performed using the Qiagen master mix kit, including 1× PCR buffer, 1× Q-solution, 200 μmol/L dNTP, 0.5 μmol/L primer pair, and 2.5 U/reaction Taq-DNA polymerase. Amplification conditions and primers are described in Table 2 ▶ . PCR products were purified using the Qiagen PCR purification kit (catalog no. 28104) following standard protocols recommended by the manufacturer. Ten ng of purified PCR were used for 100 bp of DNA cycle sequencing, which was performed using a Perkin-Elmer dye terminator cycle-sequencing ready reaction mix, using standard procedures. Reactions were applied to a Perkin-Elmer ABI 377 DNA sequencer. Sequences were aligned using the National Center for Biotechnology Information BLAST 2 program.
Table 2.
Primers and PCR Conditions for DNA Sequencing
| Primers | Primer sequences | Genomic position | No. of bases | AT | Product size | Exons |
|---|---|---|---|---|---|---|
| 116KDa-A Forward | 5′-GTG CAC AGG TGC CCG TGG TT-3′ | 2221–2240 | 20 | 60°C | 720 bp | 2–3 |
| 116KDa-A Reverse | 5′-CCC AGA CTC TTC CTT TCA GA-3′ | 2940–2921 | 20 | |||
| 116KDa-B Forward | 5′-CTG GTG GCC GAT GGA GTT TG-3′ | 3578–3597 | 20 | 60°C | 620 bp | 4–5 |
| 116KDa B Reverse | 5′-AGT TCC GGG CCT GAA GGA GG-3′ | 4197–4178 | 20 | |||
| 116KDa C Forward | 5′-GGC CAG TGT GCC CAA TTG CC-3′ | 4281–4300 | 20 | 60°C | 729 bp | 6–8 |
| 116KDa C Reverse | 5′-ACC TCC TGC ACC CAC CTC CG-3′ | 5009–4990 | 20 | |||
| 116KDa D Forward | 5′-CGG AGG TGG GTG CAG GAG GT-3′ | 4990–5009 | 20 | 65°C | 486 bp | 9 |
| 116KDa D Reverse | 5′-AGG CAA AGC CCA GGT GCA GG-3′ | 5475–5456 | 20 | |||
| 116KDa E Forward | 5′-AGG GCA GAG CAG GGC TGA TC-3′ | 5826–5845 | 20 | 60°C | 374 bp | 10 |
| 116KDa E Reverse | 5′-TCA GGC TCA CAC CCT CCC AG-3′ | 6199–6180 | 20 | |||
| 116KDa-F Forward | 5′-GGG TTC TTG ACT GCA GGC CA-3′ | 8357–8376 | 20 | 60°C | 676 bp | 11–13 |
| 116KDa F Reverse | 5′-TCA CCA CCC ACG GAC ACT CC-3′ | 9032–9013 | 20 | |||
| 116KDa G1 Forward | 5′-GCT GGC CCA TCT GCG CTC TG-3′ | 9740–9759 | 20 | 65°C | 717 bp | 14 |
| 116KDa G1 Reverse | 5′-TGA GCT CCG GCA GCG TCT CC-3′ | 10156–10137 | 20 | |||
| 116KDa G Forward | 5′-AGA TTT GGA GCC TGG CTG CC-3′ | 9903–9922 | 20 | 65°C | 498 bp | 15 |
| 116KDa G Reverse | 5′-TCT TGC AGC TCC CAG TGG CC-3′ | 10400–10381 | 20 | |||
| 116KDa H Forward | 5′-AGG TGT GCA CAG CAG GGA CG-3′ | 10642–10661 | 20 | 60°C | 549 bp | 16–18 |
| 116KDa H Reverse | 5′-AGA GAA GCA ACC CGC CCA GC-3′ | 11358–11339 | 20 | |||
| 116KDa I Forward | 5′-GTG CAG GGA GGG CTT CAG GC-3′ | 11421–11440 | 20 | 65°C | 417 bp | 19–20 |
| 116KDa I Reverse | 5′-CCC TGC CAC CTG CCT CAG CTA-3′ | 11969–11949 | 21 |
Reverse Transcriptase-PCR and Restriction Fragment Length Polymorphism Analysis
RNA was extracted from ethylenediaminetetraacetic acid-peripheral blood samples using a standard phenol-chloroform method. For reverse transcriptase-PCR, 2 μg of total RNA were reverse-transcribed using Superscript II reverse transcriptase and one-tenth of the reaction product was used for PCR. This was performed in a final volume of 100 μl and 0.5 μmol/L of each primer (forward: 5′-GCT CGA TGG AGG AGG GAG TG-3′; reverse: 5′-GTA AGC ATC GTG TGC TGG GC-3′). Samples were then subjected to 2.5% agarose gel electrophoresis using 1× TAE running buffer (0.04 mol/L Tris-acetate, 0.001 mol/L ethylenediaminetetraacetic acid) to verify PCR quality. For restriction fragment length polymorphism analysis, PCR products were then purified by the Qiagen PCR purification kit and digested with 1 U/μg of restriction enzyme MwoI (restriction enzyme analysis, http://darwin.bio.geneseo.edu/∼yin/WebGene/RE.html), at 60°C for 3 hours. Digestion was assessed by ethidium bromide-2.5% agarose gel electrophoresis and ultraviolet transillumination.
Western Blot
Cells were washed twice with phosphate-buffered saline (PBS) and lysed in a buffer containing 50 mmol/L Hepes (pH 7.2), 150 mmol/L NaCl, 10% glycerol, 1% Triton X-100, 1.5 mmol/L MgCl2, 5 mmol/L EGTA, 50 mmol/L NaF, 100 μmol/L sodium vanadate, 10 μg/ml aprotinin, 10 μg/ml leupeptin, 1 mmol/L phenylmethylsulfonyl fluoride. Lysates were centrifuged at 14,000 rpm at 4°C for 10 minutes, and protein were measured by the Bradford method. Eighty μg of protein in reducing sample buffer was subjected to 10% sodium dodecyl sulfate-polyacrylamide gel electrophoresis. Proteins were then transferred to nitrocellulose filter papers and incubated with primary antibody diluted 1:1000 in TBST buffer (25 mmol/L Tris-buffered saline, pH 7.4, 0.05% Tween), containing 1% nonfat milk, at room temperature for 1 hour. Filters were washed three times in TBST buffer and then incubated with secondary antibody diluted 1:10,000 in TBST buffer containing 1% nonfat milk, at room temperature for 1 hour. Bands were revealed by the enhanced chemiluminescence detection kit.
Osteoclast Preparation from Bone Marrow
The total bone marrow cell fraction was dispersed in Iscove’s modified minimum essential medium supplemented with 20% fetal calf serum, 100 U/ml penicillin, and 100 μg/ml streptomycin, and cultured in plastic dishes at 37°C in a humidified atmosphere of 95% air and 5% CO2. After 24 hours, nonadherent cells were removed by aspiration and extensive washing.
Osteoclast Preparation from Peripheral Blood Monocytes
Peripheral blood mononuclear cells were prepared from human blood diluted in Hanks’ balanced salt solution (1:1). Diluted blood was layered over Histopaque 1077 solution, centrifuged at 400 × g for 30 minutes, then washed twice with Hanks’ solution and centrifuged at the speed as above for 10 minutes. Cells were resuspended in Dulbecco’s modified Eagle’s medium containing 4 mmol/L of l-glutamine, 100 U/ml of penicillin, 100 μg/ml of streptomycin, and 10% fetal calf serum. Cells (3 × 10⁶ cells/cm2) were plated on glass coverslips or bone slices and incubated at 37°C in a humidified atmosphere with 5% CO2. After 1 hour, cell cultures were rinsed to remove nonadherent cells and were maintained in medium as above in the presence of 25 ng/ml of recombinant human macrophage colony stimulating factor, 30 ng/ml of recombinant human receptor activator of NF-κB ligand, and 100 nmol/L of parathyroid hormone (PTH) for 21 days. Medium and factors were replaced every 3 to 4 days.
TRAP Activity
Cells were fixed in 3% paraformaldehyde in 0.1 mol/L of cacodylate buffer for 15 minutes, then extensively washed in the same buffer. TRAP activity was detected histochemically in cells or in paraffin-embedded sections of the bone biopsies, using the Sigma-Aldrich kit no. 386, according to the manufacturer’s instruction.
Bone Resorption Assay
Cells were cultured in 24-plate multiwells containing 4 × 4-mm bovine bone slices, and fixed in 3% paraformaldehyde in PBS, then slices were cleaned free of cells by sonication, stained with 1% toluidine blue, and observed by conventional light microscopy.
Immunocytochemistry and Fluorescence Microscopy
Cells plated on glass coverslips were fixed with 4% paraformaldehyde in PBS at 4°C for 10 minutes, washed three times in PBS, then, when required, permeabilized with 0.05% Triton X-100 in PBS at 4°C for 10 minutes and incubated in 1% bovine serum albumin at room temperature for 15 minutes. Samples were incubated at 37°C for 1 hour with a3, c-Src, αvβ3 integrin, and PYK2 antibodies, then washed with PBS, followed by TRITC- or horseradish peroxidase-conjugated anti-mouse or anti-rabbit secondary antibody at 37°C for 1 hour. Microfilaments were decorated by incubation with 5 μg/ml of TRITC-conjugated phalloidin at 37°C for 1 hour. Samples were viewed with conventional light or epifluorescence in a Zeiss Axioplan microscope (Jena, Germany).
Quantitative Analysis
Bone resorption was determined by pit enumeration. Histochemical TRAP staining intensity was determined by densitometry and indicated as arbitrary units. Quantitative data were expressed as mean ± SEM. Statistics was computed by the Student’s t-test and a P < 0.05 was conventionally considered significant.
Results
Genotypes
Mutation analysis was performed sequencing all of the 20 coding exons and intron junctions after amplification from genomic DNA, and ATP6i mutations were identified in these patients (Figure 1) ▶ . A summary of mutations is shown in Table 3 ▶ . Patient 1 was homozygous for a mutation in exon 11 consisting of a single G nucleotide deletion that predicted a frameshift and truncation of the protein in the I/II transmembrane domain. Patient 2 was homozygous for a C/A transversion in exon 13 that is predicted to introduce a stop codon in the III/IV transmembrane domains. Patient 3 was a compound heterozygote, carrying single point mutations affecting the acceptor splice site of intron 14 and the last nucleotide of exon 18. The mutation in intron 14 (G/A transition) was predicted to determine putative abnormal splicing in loop IV/V, whereas mutation in exon 18 (C/T transition) could give rise either to abnormal splicing or to protein truncation in the VIII transmembrane domain. In patient 4, there was a homozygous splice donor site mutation in intron 18 that is predicted to determine abnormal splicing in the VIII transmembrane domain (Figure 1 ▶ , Table 3 ▶ ). To the best of our knowledge, the mutations found in patients 1 and 2, and that in exon 18 of patient 3 are novel and had not been previously described.
Figure 1.
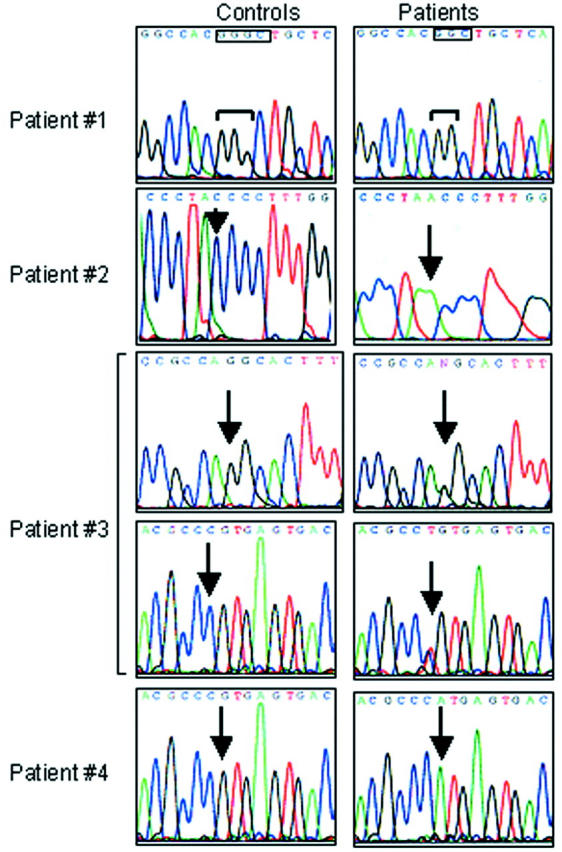
ATP6i gene mutations. Electropherograms of the ATP6i gene in healthy donors (left) and osteopetrotic patients (right). In patient 1, boxes indicate the site of G deletion. In patients 2 to 4, arrows indicate the sites of base transversion or transition. Note that patients 1, 2, and 4 are homozygous, patient 3 is heterozygous.
Table 3.
ATP6i Gene Mutations
| No. | Location in DNA | Genomic mutation | Predicted consequence | Location in protein | Allele |
|---|---|---|---|---|---|
| 1 | Exon 11 | del G8521 | G410fsX429 | I/II transmembrane domains | Homozygous |
| 2 | Exon 13 | C8980A | Y512X | III/IV transmembrane domains | Homozygous |
| 3 | Intron 14 | G10106A splice acceptor site position-1 | Abnormal splicing | IV/V loop | Heterozygous |
| Exon 18 | C11278T last nucleotide of exon 18 | Abnormal splicing or Q746X ?? | VIII transmembrane domain | ||
| 4 | Intron 18 | G11279A splice donor site position + 1 | Putative abnormal splicing | VIII transmembrane domain | Homozygous |
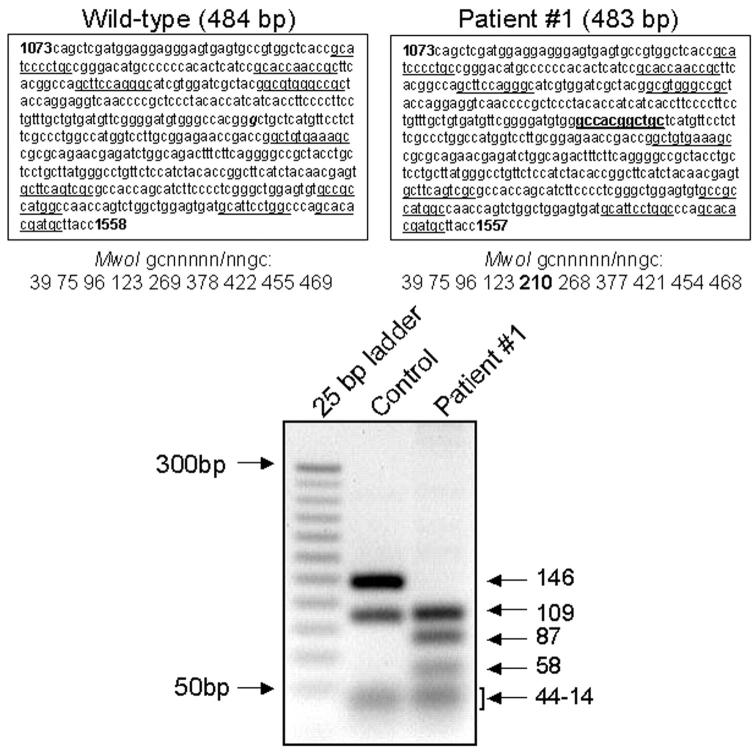
For patient 1 we had access to RNA and proteins extracted from peripheral blood mononuclear cells that allowed reverse transcriptase-PCR/restriction fragment length polymorphism and Western blot analysis, respectively. For reverse transcriptase-PCR/restriction fragment length polymorphism (Figure 2) ▶ , MwoI restriction enzyme, cutting gcnnnnn/nngc sequences, was predicted to digest amplified wild-type cDNA in nine fragments of 14 to 146 bp, spanning nucleotides 1073 to 1558 of exons 10 to 12. In patient 1, the G deletion predicted in cDNA position 1285 would determine the appearance of an additional MwoI restriction cut site (Figure 2) ▶ . Therefore, 10 fragments of 14 to 109 bp were expected to be formed in this patient. This resulted to be the case, as in Figure 2 ▶ two fragments of 87 bp and 58 bp were observed in the patient, but not in the control. In contrast, the 146-bp fragment apparent in the control subject was not observed in the patient.
Figure 2.
Restriction cuts sorted by MwoI enzyme. Analysis refers to patient 1. Top: Wild-type (left) and patient (right) sequences, spanning nucleotides 1073 to 1558/1557 of exons 10 to 12, and the positions of the gcnnnnn/nngc cuts by the MwoI restriction enzyme. Bottom: Control and patient fragments sorted by MwoI cuts resolved by ethidium-bromide 2.5% agarose gel electrophoresis and ultraviolet transillumination. Underlined, physiological cut sites by the MwoI enzyme; bold, additional cut-site in patient; g (bold and italics), G deleted in patient.
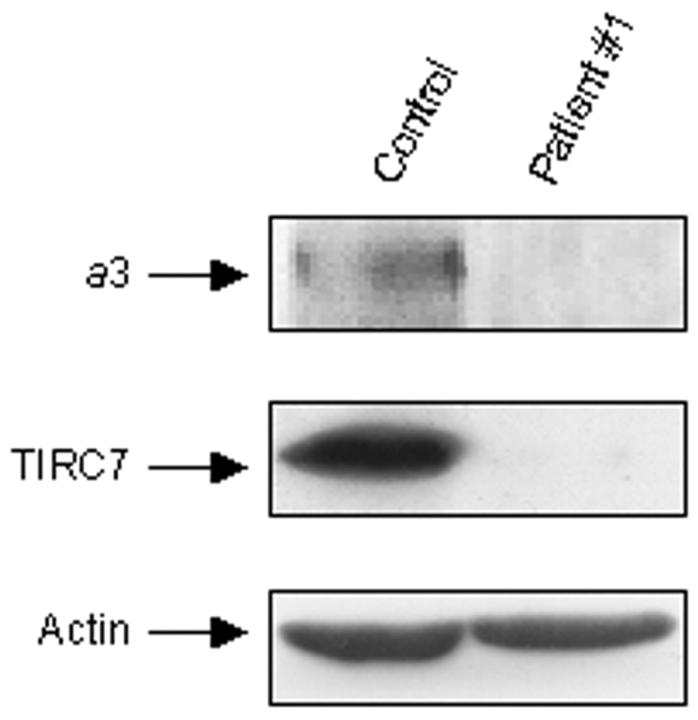
We next performed Western blot analysis using an antiserum recognizing the C-terminal peptide of the a3 subunit of the osteoclast V-ATPase. Figure 3 ▶ shows that peripheral blood mononuclear cells harvested from a control subject express high amounts of the TIRC7 protein, derived by alternative splicing of the ATP6i gene, which is known to play a relevant role in lymphocyte activation. 18 Long film exposure demonstrated also faint expression in these cells of the 116-kd a3 subunit. In contrast, proteins extracted from peripheral blood mononuclear cells of patient 1 failed to immunoreact with this antibody, confirming lacking of the protein C-terminal sequence.
Figure 3.
Western blot analysis of a3 and TIRC7 proteins. Proteins were extracted from peripheral blood mononuclear cells of control and patient 1, as described in Materials and Methods, and resolved by sodium dodecyl sulfate-polyacrylamide gel electrophoresis. Immunoblotting was performed using an antiserum against the C-terminal peptide of the a3 V-ATPase subunit, also recognizing the TIRC7 splice variant of the ATP6i gene (middle). Long-term film exposition allowed detection in these cells also of the modestly expressed a3 protein (top). Bottom: The constitutive protein actin used as an internal control.
Clinical Follow-Up
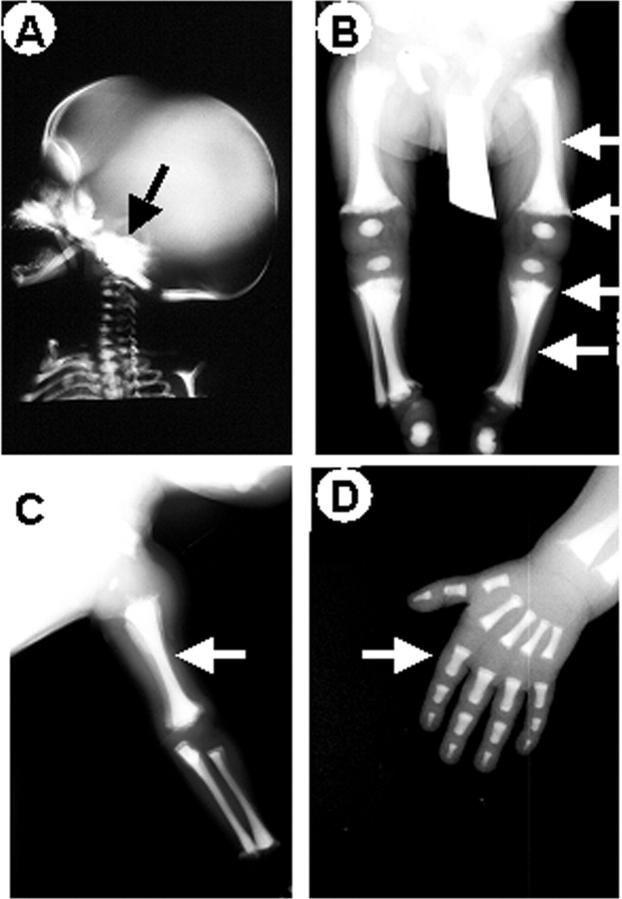
Clinical follow-up was available for our patients (Table 1) ▶ . Symptoms were quite variable, however all patients shared macrocephaly, growth retardation, and compromised vision because of optic nerve compression syndrome. Three patients also showed hepatosplenomegaly. Laboratory findings (Table 4) ▶ revealed severe anemia and altered white cell counts in all patients, whereas platelet counts were low only in one patient. Interestingly, all patients shared mild to severe hypocalcemia, and elevated serum alkaline phosphatase activity and PTH levels. When available, total creatinine kinase enzyme was unremarkable. Radiographs showed a generalized increase in bone density, sclerosis of the basis of the skull with increased density of the orbits (Figure 4A) ▶ . Proximal metaphyses of femurs and tibias were irregularly shaped (Figure 4B) ▶ and, together with forearms, showed diffused osteosclerosis and absence of medullary cavities (Figure 4, B and C) ▶ . Femurs, tibias, forearms, phalanges, (Figure 4; B to D) ▶ and iliac crests (not shown) showed endobone appearance.
Table 4.
Laboratory Findings
| Patient 1 | Patient 2 | Patient 3 | Patient 4 | |
|---|---|---|---|---|
| Hgb (g/dl) | 8.9 | 9.4 | 7.8 | 10.1 |
| WBC (×103/l) | 8.17 | 7.7 | 11.9 | 25.1 |
| PLT (×103/l) | 138 | 205 | 122 | 41 |
| Alkaline phoshatase (n.v. 100–300 mU/ml) | 2730 | 612 | 1990 | 2600 |
| Calcaemia (n.v. 8.6–10.8 mg/dl) | 7.0 | 8.7 | 8.4 | 8.2 |
| PTH (n.v. 10-65 pg/ml) | 265 | 695 (PTH-COOH) 180 (total PTH) | 611 | n.d. |
| CK (n.v. 30–170U/L) | 90 | 80 | n.d. | n.d. |
Hgb, haemoglobin; WBC, white blood cells; PLT, platelets; n.v., normal values; n.d., nondetected.
Figure 4.
X-ray analysis. Radiographs of patient 1. A: Sclerosis of the base of the skull (arrow). Obliterated cavities and irregularly shaped extremities (arrows) in femurs and tibias (B) and in left forearm (C). Endobone appearance (arrow) in left hand phalanges (D). Similar patterns were noted in patients 2 to 4.
All patients underwent bone marrow transplantation (BMT) (Table 1) ▶ . Nine months post-BMT (which was received at the age of 6 months), patient 1 shows a mild osteosclerotic pattern. Patient 2 was transplanted 1 year ago at the age of 22 months. She still shows growth retardation and post-BMT hypercalcemia. 22 Patient 3 was transplanted 2.5 years ago at the age of 9 months. This patient had severe optic nerve failure, which was not rescued by BMT. Because of positive family history, patient 4 was investigated at birth and received an early diagnosis. Pre-BMT evoked visual potential analysis had revealed bilateral severely compromised optic nerve function. This patient was transplanted 5 years ago at the age of 2 months and underwent surgery for optic channel decompression. Now he is healthy, with normal growth rate. The right eye completely rescued its function, whereas the left eye still presents remarkable reduced vision (<1/50).
Bone Biopsies
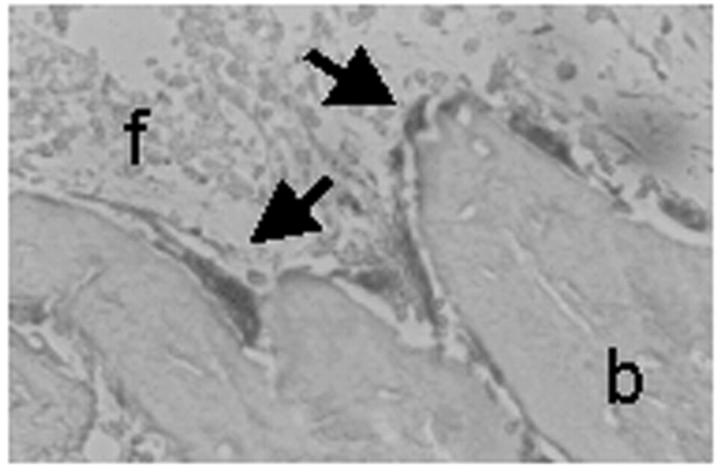
A clear-cut osteosclerotic pattern was obvious in sections of iliac crest biopsies of all patients (Figure 5) ▶ . Bone trabeculae were massive and irregular in shape. In some of them inner cores of unresorbed mineralized cartilage (endochondral trabeculae) (Figure 5, B and H) ▶ were noticed. Several osteoclasts noted for their large size, multinuclearity (average, four to seven nuclei per cell; Figure 5 ▶ ), and positivity to TRAP activity (Figure 6) ▶ were associated with the trabecular profiles. These osteoclasts showed apparent normal polarization and contact with bone (Figure 5) ▶ . Some of them laid in shallow Howship lacunae, indicating that some resorption of bone could take place (Figure 5H) ▶ . Some trabeculae were layered by active matrix-forming osteoblasts (not shown). Hematopoietic tissue was scarce against a remarkable background of diffuse fibrosis (Figure 5) ▶ .
Figure 5.
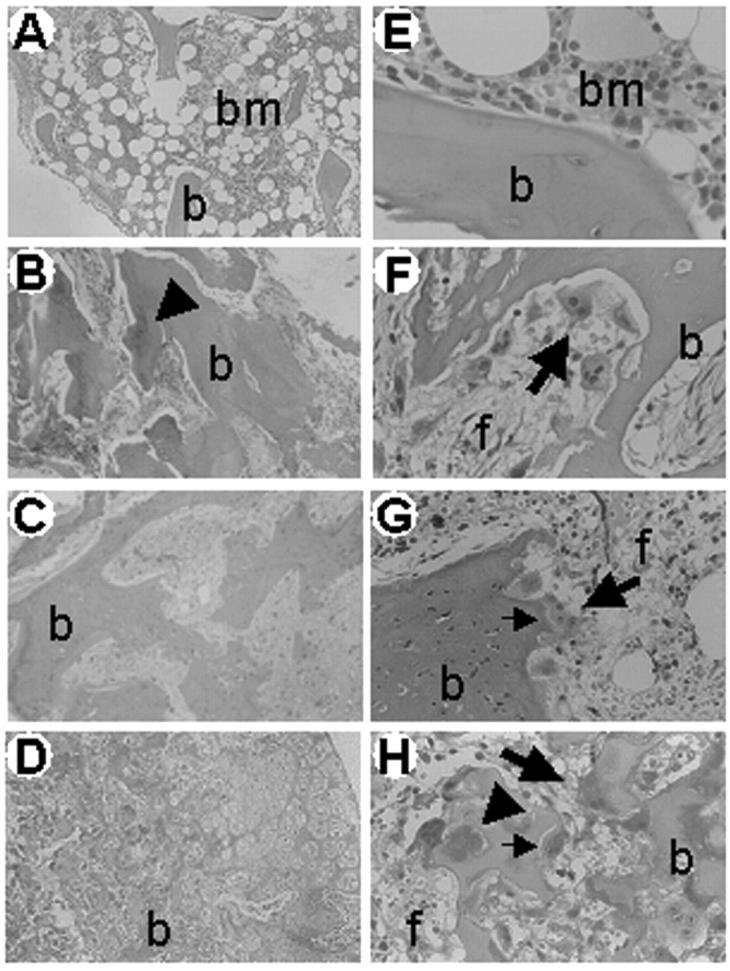
Iliac crest bone biopsies. H&E routine staining of paraffin sections of an age-matched control (A, E) and of patients 1 (B, F), 3 (C, G), and 4 (D, H). Of note, irregular and massive primary trabeculae (b) surrounded by abnormal fibrous tissue (f), and layered by several osteoclasts (large arrows) are apparent in patients. In contrast, mature trabeculae (b) surrounded by normal hematopoietic bone marrow (bm) and no osteoclasts are observed in the control subject. Small arrows, Howship lacunae; arrowheads, unresorbed cartilage. Original magnifications: ×10 (A–D); ×40 (E–H).
Figure 6.
TRAP staining. Iliac crest bone biopsy paraffin section of patient 1 histochemically stained for the osteoclast-specific marker TRAP. Massive trabeculae (b) are layered by a prominent number of TRAP-positive osteoclasts (arrows) and surrounded by fibrous tissue (f). Original magnification, ×40.
Sections were also immunoreacted with anti-a3 antibody recognizing the C-terminus epitope of the protein. For comparison, samples from ATP6i-independent osteopetrosis were immunostained as control, where immunoreactivity with the a3 antiserum was noticed. In contrast, reaction with this antibody was negligible in the bone biopsies of the ATP6i-dependent patients (Figure 7) ▶ .
Figure 7.
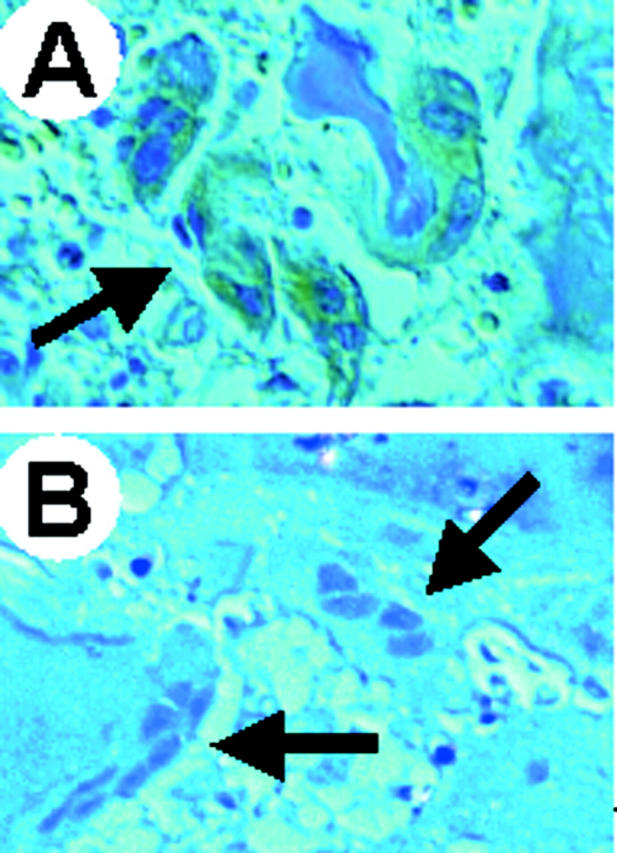
Immunohistochemical detection of the a3 V-ATPase subunit in bone biopsies. A: The bone biopsy of a patient affected by ATP6i-independent osteopetrosis was used as positive control for reaction to the anti-a3 antiserum. The arrow shows a group of osteoclasts labeled with brownish color because of positive reaction to the antiserum revealed by a horseradish-conjugated secondary antibody. B: Bone biopsy of patient 3 showing a3-negative osteoclasts (arrows) counterstained with hematoxylin. Original magnifications, ×40.
In Vitro Osteoclast Phenotype
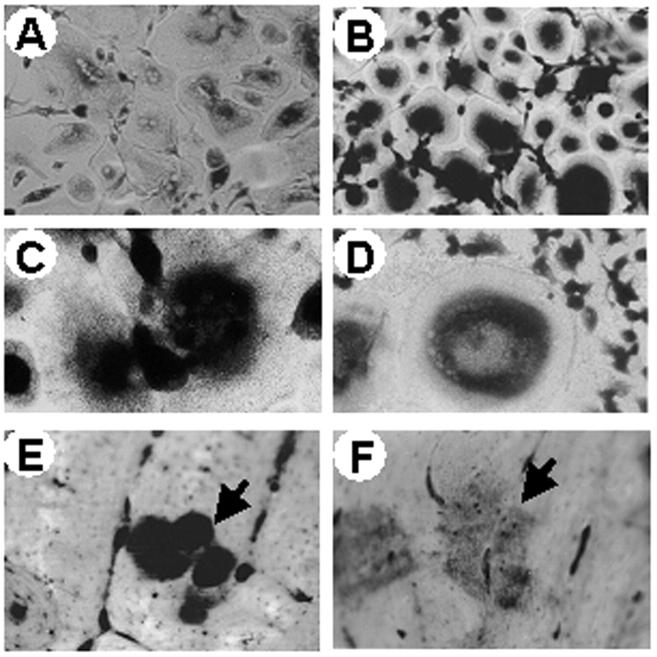
Growth of bone marrow cells from patient 1 resulted in the immediate appearance of a population of giant cells, phenotypically indistinguishable from multinucleated osteoclasts. These cells attached to the culture dish in a few hours and showed a highly motile phenotype underlined by the appearance of well-developed lamellipodia in their paramarginal area (Figure 8A) ▶ . Similar to what was observed in the iliac crest biopsy, giant cells had an average number of nuclei ranging from four to seven, with prominent nucleoli. Nuclei were located in the cell center together with organelles and vacuoles of variable size. As expected, no giant cells were readily apparent in the cultures of the healthy sister of this patient and of control donors (not shown). Long-term cultures resulted in the overgrowth of a stromal-like cell population, both in the patient and in the normal controls. However, histochemical staining revealed the presence of TRAP-positive giant cells only in the patient (Figure 8B) ▶ , whereas, as already described, 27 in the cultures of controls no TRAP-positive cells or only TRAP-positive putative mononuclear osteoclast precursors were observed (not shown). Despite the large numbers of osteoclasts in the bone marrow culture of the patient, only small pits could be detected (Figure 8C) ▶ , thus indicating a failure in the resorbing function of the giant cells.
Figure 8.
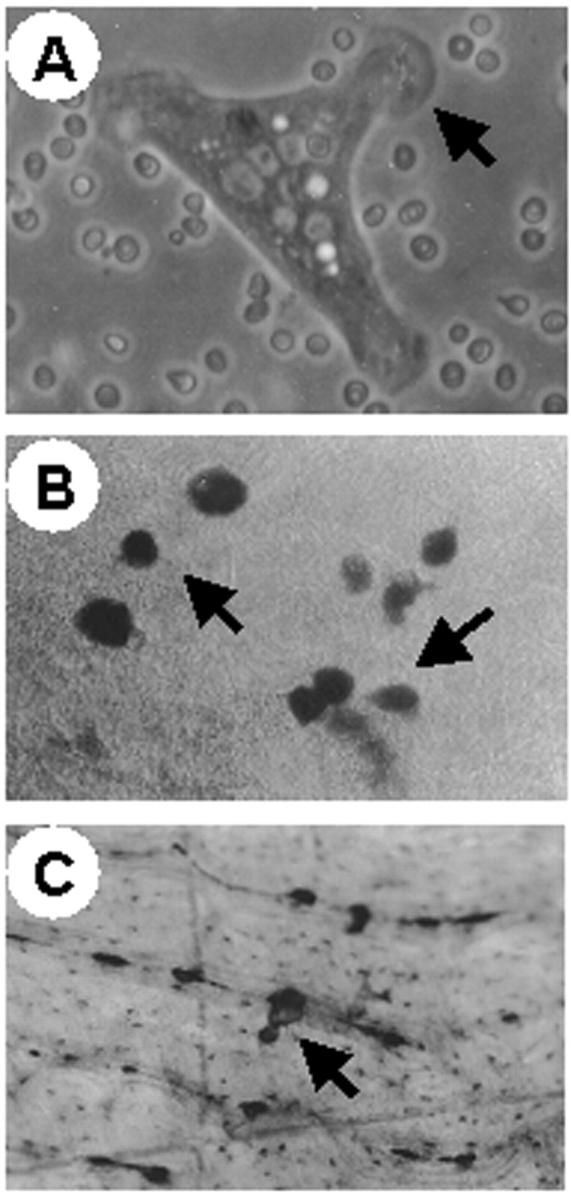
In vitro bone marrow osteoclasts. Bone marrow was harvested from patient 1 and cultured in vitro by standard procedure (see Materials and Methods). A: Phase-contrast micrograph of a 1-day cultured osteoclast showing motile morphology and prominent lamellipodia (arrow). B: TRAP histochemical staining of 1-week culture showing several large, TRAP-positive, osteoclasts (arrows) against a background of TRAP-negative stromal cells. C: Bone section showing a small pit (arrow) excavated by an osteopetrotic osteoclast. Original magnifications: ×63 (A); ×25 (B and C).
Similar to controls, giant cells obtained from peripheral blood monocytes of patients 1 and 2 were numerous. Morphologically, no obvious differences were noted between normal and osteopetrotic osteoclasts (Figure 9, A and B) ▶ . In both cultures, giant cells appeared disk-shaped, with a clear zone-like paramarginal area, nuclei and organelles were unremarkable. A strong TRAP activity was apparent in the giant cells from the patient (Figure 9, B and C) ▶ . Enzyme distribution in perinuclear vesicles was identical to control cells, however stain intensity was twofold higher in diseased relative to normal osteoclasts (Figure 9; A to C) ▶ (quantitative analysis, arbitrary units ± SEM: control, 10.8 ± 0.57; patient, 20.1 ± 1.13; n = 5; P < 0.001). Interestingly, osteoclasts harvested from patient 1 after BMT that were supposed to derive from the donor showed TRAP staining apparently lower than in pre-BMT osteoclasts (Figure 9, C and D) ▶ . Notably, although control osteoclasts immunostained with the antisera raised against the C-terminal peptide of the a3 subunit of the osteoclast V-ATPase the osteoclasts from the patient were immunonegative. Osteoclasts harvested from patient 1 after BMT showed rescue of the immunoreactivity (not shown).
Figure 9.
In vitro peripheral blood osteoclasts. Osteoclasts were generated in vitro from controls and patient 1 as described in Materials and Methods. A: Control culture showing several TRAP-positive osteoclasts. B: Patient’s culture showing similar number of osteoclasts with a strongly positive TRAP reaction. C: Patient’s culture at higher magnification showing strong TRAP positivity. D: Patient’s post-BMT osteoclasts showing less pronounced TRAP activity relative to the pre-BMT osteoclasts depicted in C. E: Pits (arrow) excavated by control osteoclasts showing regular morphology and intense toluidine-blue staining. F: Pits (arrow) excavated by the patient’s osteoclasts showing irregular edges and pale staining relative to control pits. Original magnifications: ×25 (A and B); ×40 (C–F).
The osteoclasts obtained from the patient were capable of resorbing bone. However, although the pits formed by control osteoclasts appeared well shaped with regular margins and intensely stained with toluidine blue (Figure 9E) ▶ , those excavated by osteopetrotic osteoclasts appeared very pale indicating that little organic matrix was exposed (Figure 9F) ▶ . However, the number of pits was similar in the control and in the patient (number/section: control, 24.6 ± 1.94; patient, 22.8 ± 0.88; n = 3; n.s.). Together with the observation in the bone biopsies, these findings indicate that in ATP6i-dependent osteopetrosis, osteoclast bone resorption is severely compromised but not completely absent.
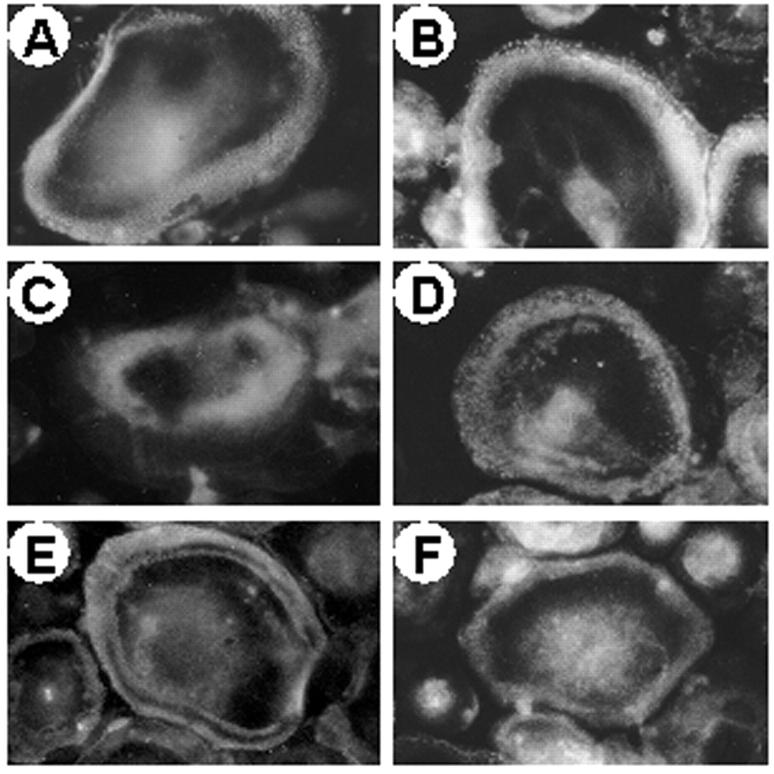
Consistent with the normal polarization of osteoclasts observed in the iliac crest biopsies, osteoclasts harvested from the peripheral blood monocytes of the patients did not show remarkable alteration of cytoskeletal arrangement and podosome distribution. Fluorescent phalloidin staining revealed normal actin rings with typical punctate patterns as also observed in control cells (Figure 10, A and B) ▶ . Membrane distribution of the vitronectin αVβ3 integrin receptor was unremarkable (Figure 10, C and D) ▶ . Thus, at variance with previous observations by us and others, 27,28 and similar to what observed by Flanagan and colleagues 29 in patients affected by malignant osteopetrosis of unknown genetic origin, no obvious alteration of the adhesion and polarization patterns is observed in our ATP6i-dependent patients. Consistently, in the osteopetrotic osteoclasts PYK2 and c-Src appeared normally distributed at the paramarginal area overlapping the actin ring (Figure 10, E and F) ▶ where these tyrosine kinases are supposed to contribute to integrin-mediated osteoclast adhesion and outside-in signaling.
Figure 10.
Cytoskeletal and adhesion properties of peripheral blood osteoclasts. Osteoclasts were generated in vitro from controls and patient 1 and processed for fluorescence microscopy as described in Materials and Methods. Actin rings (rhodamine-conjugated phalloidin staining) in control (A) and patient’s (B) osteoclasts. αVβ3 receptor in control (C) and patient’s (D) osteoclasts. c-Src (E) and PYK2 (F) in patient’s osteoclasts. No differences were noted between control and osteopetrotic controls. Original magnifications, ×40.
Discussion
To the best of our knowledge, this is the first phenotypic characterization of human osteopetrosis dependent on ATP6i gene mutations in which both clinical and cellular aspects have been analyzed.
Previous reports have indicated that ATP6i mutations account for most cases of autosomal-recessive osteopetrosis 19-21 and in our studies, this gene was mutated in all four patients. In three cases, the ATP6i gene mutations discovered were novel (exon 9, DelG8521; exon 13, C8980A; exon 18, C11278T). Interestingly, in all cases investigated so far, 20% of the alleles were found to carry a G10106A transition in intron 14 leading to abnormal splicing, suggesting that this could be a candidate hot spot for mutations. 21
In this study all patients showed high alkaline phosphatase and PTH serum levels. These two biochemical findings are inconsistently present in osteopetrosis and reports can be contradictory. 22,30,31 The elevated alkaline phosphatase activity could depend on altered osteoblast function. 32 This biochemical marker is higher in children than in adults, reflecting elevated bone formation for skeletal growth. 33 Its further increase in infants with osteopetrosis does not have a definitive explanation yet. Osteopetrosis is regarded as an osteoclast disease. However, some extent of osteosclerosis, namely increased osteoblast activity and bone formation, has been claimed to occur in this disease, 34,35 and in our iliac crest biopsies, active osteoblasts are seen in patients. This event is not easily explainable if the osteoclast-osteoblast coupling is taken in account. However, it must be considered that during skeletal development, osteoclast and osteoblast activities are often uncoupled, as it occurs, for instance, during periosteal bone formation associated to endosteal bone resorption to increase diaphyseal collar size accompanied by enlargement of medullary cavity. 36
Most forms of the disease in humans display increased numbers of osteoclasts. In our patients, this was a constant and obvious feature in bone biopsies, and others have reported similar findings. 37,38 In the past, insensitivity of osteoclasts and osteoblasts to the effects of PTH was thought to be a cause of osteopetrosis. 39-42 In the light of recent data, 43 we speculate that the increased PTH levels are a result of the disease, because of the hypocalcemia that presumably depends on ineffective bone resorption. The increased osteoclast formation and bone formation that was observed could simply be a reflection of the elevated PTH levels, which also could contribute, in three of our patients, to maintain serum calcium values close to the normal ranges by its action on other organs (ie, the kidney).
Osteoclast morphology in our patients seems to be normal. Lack of ruffled border is claimed to be a common feature of osteopetrotic osteoclasts. Unfortunately, we could not address this issue in our study because of the lack of electron microscope samples of bone biopsies. Nevertheless, relative to another case of osteopetrosis investigated in our laboratory, 27 where the ruffled borders of the osteoclasts were lacking and the adhesion properties altered, the osteoclasts of our ATP6i-positive patients showed no obvious morphological alterations by routine histology. Holliday and colleagues 12 and Lee and colleagues 13 have demonstrated that the mouse osteoclast V-ATPase interacts with microfilaments during bone resorption and proposed that proton transport by this pump is associated with reorganization of the actin cytoskeleton during osteoclast activation. However, this interaction seems to depend on the B subunits of the V-ATPase, therefore it is not surprising that no cytoskeletal rearrangements or abnormal polarization is observed in the osteoclasts of our patients.
Interestingly, bone biopsies showed intensely TRAP-positive osteoclasts placed in altered resorption lacunae, which we believe to represent the result of impaired, but still remarkable, bone resorption. This result was confirmed in our in vitro assay, in which toluidine blue staining demonstrated similar pit numbers, although little organic matrix was exposed in the pits excavated by the osteoclasts of our patient. We believe that it would be remarkable to investigate the molecular mechanisms that could complement a3 activity, ie, other a subunits, or other proton extrusion devices, such as the Na+/H+ anti-port. It is interesting to note that redundant activities are often observed in bone cells, and double-knockout experiments are sometime required to disclose effective functions of given genes. 44 We believe that such a knowledge in a3-deficient osteoclasts could be helpful for future pharmacological management of the disease.
Interestingly, TRAP-activity was found to be elevated in patients’ osteoclasts. Unfortunately, this marker has not been evaluated in the sera of these patients, therefore we cannot address the issue of whether a correlation exists between the cellular and the clinical findings. Notably, TRAP-activity was less pronounced in post-BMT osteoclasts harvested from the monocytic fraction of peripheral blood of patients. We believe that these are donor osteoclasts because of the fact that these osteoclasts are now positive to the a3 subunit of the V-ATPase. Clinical follow-up of this patient shows so far a marked amelioration of skeletal, hematological, and biochemical symptoms, thus confirming our hypothesis.
One of the means whereby we tested integrity of the ATP6i gene in one patient was the analysis of the TIRC7 protein in lymphocytes. 18,45,46 This is a novel ATP6i gene product consisting of an ∼75-kd transmembrane protein expressed in the early stages of T-cell activation, which does not share structural or sequence homology with any of the known T-cell accessory molecules. 18 TIRC7 expression increases during acute rejection of cardiac allografts, 45,46 however its molecular and cellular roles are at present still unclear. Despite this, detection of TIRC7 expression could be used as a valid tool for a rapid diagnosis of ATP6i-dependent osteopetrosis, at least in those cases in which the genetic mutation leads to loss of the a3/TIRC7 C-terminus (the majority so far). In addition, antibodies against TIRC7 inhibit in vitro proliferation and Th1-type cytokine production by activated human T cells, 47 thus representing an additional tool to investigate alteration of this gene in osteopetrotic patients. Further insights into the TIRC7 protein structure and function are however necessary to fully understand its role in lymphocytes and in other cell types.
In conclusion, we described genetic, clinical, and cellular findings in four individuals affected by ATP6i-dependent autosomal-recessive infantile osteopetrosis. We believe that this genotype/phenotype correlation will help future developments of successful management, including cell and gene therapy.
Acknowledgments
We thank Drs. J.P. Mattsson and D. Keeling (AstraZeneca, Mölndal, Sweden) for kindly providing the anti-a3 antiserum.
Footnotes
Address reprint requests to Prof. Anna Teti, Department of Experimental Medicine, Via Vetoio-Coppito 2, 67100 L’Aquila, Italy. E-mail: teti@univaq.it.
Supported by the Telethon (grant E.0831), the Fondo per gli Investimenti per la Ricerca di Base (grant RBAU01X3NH), the University of L’Aquila (to A. T.), and by the Ministero della Salute (grant code 0002P70), Ricerca Corrente to Ospedale Bambino Gesù.
References
- 1.Baron R, Neff L, Louvard D, Courtoy PJ: Cell-mediated extracellular acidification and bone resorption: evidence for a low pH in resorbing lacunae and localization of a 100-kD lysosomal membrane protein at the osteoclast ruffled border. J Cell Biol 1985, 101:2210-2222 [DOI] [PMC free article] [PubMed] [Google Scholar]
- 2.Blair HC, Teitelbaum SL, Ghiselli R, Gluck S: Osteoclastic bone resorption by a polarized vacuolar proton pump. Science 1989, 245:855-857 [DOI] [PubMed] [Google Scholar]
- 3.Vaananen KH, Zhao H, Mulari M, Hallen JM: The cell biology of osteoclast function. J Cell Sci 2000, 113:377-381 [DOI] [PubMed] [Google Scholar]
- 4.Blair HC, Schlesinger PH: The mechanism of osteoclast acidification. Rifkin BR Gay CV eds. Biology and Physiology of the Osteoclast. 1992:pp 259-287 CRC Press, Boca Raton
- 5.Forgac M: Structure and properties of the vacuolar (H+)-ATPases. J Biol Chem 1999, 274:12951-12954 [DOI] [PubMed] [Google Scholar]
- 6.Weber J, Senior A: Catalytic mechanism of F1-ATPase. Biochim Biophys Acta 1997, 1319:19-58 [DOI] [PubMed] [Google Scholar]
- 7.Fillingame RH: Getting to the bottom of the F1-ATPase. Nat Struct Biol 2000, 7:1002-1004 [DOI] [PubMed] [Google Scholar]
- 8.Cross RL, Duncan TM: Subunit rotation in F0F1-ATP synthase as a means of coupling proton transport through F0 to the binding changes in F1. J Bioenerg Biomembr 1996, 28:403-408 [DOI] [PubMed] [Google Scholar]
- 9.Stevens TH, Forgac M: Structure, function and regulation of the vacuolar (H+)-ATPase. Ann Rev Cell Dev Biol 1997, 13:779-808 [DOI] [PubMed] [Google Scholar]
- 10.Peng S-B, Li X, Crider BP, Zhou Z, Andersen P, Tsai SJ, Xie X-S, Stone DK: Identification and reconstitution of an isoform of the 116-kDa subunit of the vacuolar proton translocating ATPase. J Biol Chem 1999, 274:2549-2555 [DOI] [PubMed] [Google Scholar]
- 11.Margolles-Clark E, Tenney K, Bowman EJ, Bowman BJ: The structure of the vacuolar ATPase in Neurospora crassa. J Bioenerg Biomembr 1999, 31:29-37 [DOI] [PubMed] [Google Scholar]
- 12.Holliday LS, Lu M, Lee BS, Nelson RD, Solivan S, Zhang L, Gluck SL: The amino-terminal domain of the B subunit of the vacuolar H+-ATPase contains a filamentous actin binding site. J Biol Chem 2000, 275:32331-32337 [DOI] [PubMed] [Google Scholar]
- 13.Lee BS, Gluck SL, Holliday LS: Interaction between vacuolar H+-ATPase and microfilaments during osteoclast activation. J Biol Chem 1999, 274:29164-29171 [DOI] [PubMed] [Google Scholar]
- 14.Perin MS, Fried VA, Stone DK, Xie XS, Sudhof TC: Structure of the 116-kDa polypeptide of the clathrin-coated vesicle/synaptic vesicle proton pump. J Biol Chem 1991, 266:3877-3881 [PubMed] [Google Scholar]
- 15.Zhang J, Feng Y, Forgac M: Proton conduction and bafilomycin binding by the V0 domain of the coated vesicle ATPase. J Biol Chem 1994, 269:23518-23523 [PubMed] [Google Scholar]
- 16.Li Y-P, Chen W, Liang Y, Li E, Stashenko P: ATP6i-deficient mice exhibit severe osteopetrosis due to loss of osteoclast-mediated extracellular acidification. Nat Genet 1999, 23:447-451 [DOI] [PubMed] [Google Scholar]
- 17.Li Y-P, Chen W, Stashenko P: Molecular cloning and characterization of a putative novel human osteoclast-specific 116 kDA vacuolar proton pump subunit. Biochem Biophys Res Comm 1996, 218:813-821 [DOI] [PubMed] [Google Scholar]
- 18.Heinemann T, Bulwin G-C, Randall J, Schnieders B, Sandhoff K, Volk H-D, Milford E, Gullans SR, Utku N: Genomic organization of the gene coding for TIRC7, a novel membrane protein essential for T cell activation. Genomics 1999, 57:398-406 [DOI] [PubMed] [Google Scholar]
- 19.Frattini A, Orchard PJ, Sobacchi C, Giliani S, Abinun M, Mattsson JP, Keeling DJ, Andersson A-K, Wallbrandt P, Zecca L, Notarangelo LD, Vezzoni P, Villa A: Defects in TCIRG1 subunit of the vacuolar proton pump are responsible for a subset of human autosomal recessive osteopetrosis. Nat Genet 2000, 25:343-346 [DOI] [PubMed] [Google Scholar]
- 20.Kornak U, Schulz A, Friedrich W, Uhlhaas S, Krmens B, Voit T, Hasan C, Bode U, Jentsch TJ, Kubisch C: Mutations in the a3 subunit of the vacuolar H+-ATPase cause infantile malignant osteopetrosis. Hum Mol Genet 2000, 9:2059-2063 [DOI] [PubMed] [Google Scholar]
- 21.Sobacchi C, Frattini A, Orchard P, Porras O, Tezcan I, Andolina M, Babul-Hirji R, Baric I, Canham N, Chitayat D, Dupuis-Girod S, Ellis I, Etzioni A, Fasth A, Fisher A, Gerritsen B, Gulino V, Horwitz E, Klamroth V, Lanino E, Mirolo M, Musio A, Matthijs G, Nonomaya S, Notarangelo LD, Ochs HD, Superti-Furga A, Valiaho J, van Hove JLK, Vihinen M, Vujic D, Vezzoni P, Villa A: The mutational spectrum of human malignant autosomal recessive osteopetrosis. Hum Mol Genet 2001, 10:1767-1773 [DOI] [PubMed] [Google Scholar]
- 22.Whyte MP: Osteopetrosis. Royce PM Steinmann B eds. Connective Tissue and Its Heritable Disorders: Medical, Genetic, and Molecular Aspects, ed 2 2002:pp 753-770 Wiley-Liss, Inc., New York
- 23.De Vernejoul MC, Bénichou O: Human osteopetrosis and other sclerosing disorders: recent genetic development. Calcif Tissue Int 2001, 69:1-6 [DOI] [PubMed] [Google Scholar]
- 24.Sly WS, Hu PY: The carbonic anhydrase II deficiency syndrome: osteopetrosis with renal tubular acidosis and cerebral calcification. Scriver CR Beaudet AL Sly WS Valle D eds. The Metabolic and Molecular Bases of Inherited Diseases, ed 7 1995:pp 4113-4124 McGraw-Hill, New York
- 25.Kornak U, Kasper D, Bösl MR, Kaiser E, Schwalzer M, Schulz A, Friedrich W, Delling G, Jentsch TJ: Loss of the ClC-7 chloride channel leads to osteopetrosis in mice and man. Cell 2001, 104:205-215 [DOI] [PubMed] [Google Scholar]
- 26.Cleiren E, Bénichou O, Van Hul E, Gram J, Bollerslev J, Singer FR, Beacerson K, Aledo A, Whyte MP, Yoneyama T, de Vernejoul MC, Van Hul: Albers-Schönberg disease (autosomal dominant osteopetrosis, type II) results from mutations in the ClCN7 chloride channel gene. Hum Mol Genet 2001, 10:2861-2867 [DOI] [PubMed] [Google Scholar]
- 27.Teti A, Migliaccio S, Taranta A, Bernardini S, DeRossi G, Luciani M, Iacobini M, De Felice L, Boldrini R, Bosman C, Corsi A, Bianco P: Mechanisms of osteoclast dysfunction in human osteopetrosis: abnormal osteoclastogenesis and lack of osteoclast-specific adhesion structures. J Bone Miner Res 1999, 14:2107-2117 [DOI] [PubMed] [Google Scholar]
- 28.Helfrich MH, Gerristen EJA: Formation of non-resorbing osteoclasts from peripheral blood mononuclear cells of patients with malignant juvenile osteopetrosis. Br J Haematol 2001, 112:64-68 [DOI] [PubMed] [Google Scholar]
- 29.Flanagan A, Sarma U, Steward CG, Vellodi A, Horton MA: Study of the nonresorptive phenotype of osteoclast-like cells from patients with malignant osteopetrosis: a new approach to investigating pathogenesis. J Bone Miner Res 2000, 15:352-360 [DOI] [PubMed] [Google Scholar]
- 30.Lejeunesse D, Busque L, Menard P, Brunette MG, Bonny Y: Demonstration of an osteoblast defect in two cases of human malignant osteopetrosis. Correction of the phenotype after bone marrow transplantation. J Clin Invest 1996, 98:1835-1842 [DOI] [PMC free article] [PubMed] [Google Scholar]
- 31.Cournot G, Trubert-Thil CL, Petrovic M, Boyle A, Cormier C, Girault D, Fisher A, Garabedian M: Mineral metabolism in infants with malignant osteopetrosis: heterogeneity in plasma 1,25-dihydroxyvitamin D levels and bone histology. J Bone Miner Res 1992, 7:1-10 [DOI] [PubMed] [Google Scholar]
- 32.Gundberg CM: Biochemical markers of bone formation. Clin Lab Med 2000, 20:489-501 [PubMed] [Google Scholar]
- 33.van der Sluis IM, de Muinck-Schrama SM: Osteoporosis in childhood: bone density of children in health and disease. J Pediatr Endocrinol Metab 2001, 14:817-832 [DOI] [PubMed] [Google Scholar]
- 34.Marzia M, Sims NA, Voit S, Migliaccio S, Taranta A, Bernardini S, Faraggiana T, Yoneda T, Mundy GR, Boyce BF, Baron R, Teti A: Decreased c-Src expression enhances osteoblast differentiation and bone formation. J Cell Biol 2000, 151:311-320 [DOI] [PMC free article] [PubMed] [Google Scholar]
- 35.Amling M, Neff L, Priemel M, Schilling AF, Rueger JM, Baron R: Progressive increase in bone mass and development of odontomas in aging osteopetrotic c-src-deficient mice. Bone 2000, 27:603-610 [DOI] [PubMed] [Google Scholar]
- 36.Baron R: Anatomy and ultrastructure of bone. Favus MJ eds. Primer of the Metabolic Bone Disease and Disorders of Mineral Metabolism, ed 4 1999:pp 3-10 Lippincott Williams & Wilkins, Philadelphia
- 37.Shapiro F, Glimcher MJ, Holtrop ME, Tashjian AH, Jr, Brickely-Parsons D, Kenzora JE: Human osteopetrosis: a histological, ultrastructural, and biochemical study. J Bone Joint Surg Am 1980, 62:384-399 [PubMed] [Google Scholar]
- 38.Shapiro F: Osteopetrosis: current clinical considerations. Clin Orthop 1993, 294:34-44 [PubMed] [Google Scholar]
- 39.Parfitt M: The actions of parathyroid hormone on bone: relation to bone remodeling and turnover, calcium homeostasis, and metabolic bone disease, IV: the state of the bones in uremic hyperparathyroidism—the mechanisms of skeletal resistance to PTH in renal failure and pseudohypoparathyroidism and the role of PTH in osteoporosis, osteopetrosis, and osteofluorosis. Metabolism 1976, 25:1157-1188 [DOI] [PubMed] [Google Scholar]
- 40.Reeves J, Arnaud S, Gordon S, Subryan B, Block M, Huffer W, Arnaud C, Mundy G, Haussler M: The pathogenesis of infantile malignant osteopetrosis: bone mineral metabolism and complications in five infants. Metab Bone Dis Relat Res 1981, 3:135-142 [DOI] [PubMed] [Google Scholar]
- 41.Aarskog D, Aksnes L, Markestad T: Effect of parathyroid hormone on vitamin D metabolism in osteopetrosis. Pediatrics 1981, 68:109-112 [PubMed] [Google Scholar]
- 42.Glorieaux FH, Pettifor JM, Marie PJ, Delvin EE, Travers R, Shepard N: Induction of bone resorption by parathyroid hormone in congenital malignant osteopetrosis. Metab Bone Dis Relat Res 1981, 3:143-150 [DOI] [PubMed] [Google Scholar]
- 43.Karaplis AC, Goltzman D: PTH and PTHrP effects on the skeleton. Rev Endocr Metab Disord 2000, 1:331-341 [DOI] [PubMed] [Google Scholar]
- 44.Suter E, Everts V, Boyde A, Jones SJ, Lullmann-Rauch R, Hartmann D, Hayman AR, Cox TM, Evans MJ, Meister T, von Figura K, Saftig P: Overlapping functions of lysosomal acid phosphatase (LAP) and tartrate-resistant acid phosphatase (Acp5) revealed by double deficient mice. Development 2001, 128:4899-4910 [DOI] [PubMed] [Google Scholar]
- 45.Morgun A, Shulzhenko N, Diniz RVZ, Almeida DR, Carvahlo ACC, Gerbase-DeLima M: Cytokine and TIRC7 mRNA expression during acute rejection in cardiac allograft recipients. Transpl Proc 2001, 33:1610-1611 [DOI] [PubMed] [Google Scholar]
- 46.Shulzhenko N, Morgun A, Rampim GF, Franco M, Almeida DR, Diniz RVZ, Carvalho ACC, Gerbase-DeLima M: Monitoring of ingraft and peripheral blood TIRC7 expression as a diagnostic tool for acute cardiac rejection in humans. Hum Immunol 2001, 62:342-347 [DOI] [PubMed] [Google Scholar]
- 47.Utku N, Heinemann T, Tulius SG, Bulwin G-C, Beinke S, Blumberg RS, Beato F, Randall J, Kojima R, Busconi L, Robertson ES, Schulein R, Volk H-D, Milford EL, Gullans SR: Prevention of acute allograft rejection by antibody targeting of TIRC7, a novel T cell membrane protein. Immunity 1998, 8:509-518 [DOI] [PubMed] [Google Scholar]


