

Abstract
Patients with extensive ulcerative colitis (UC) of longer than 8 years duration are at high risk for the development of colorectal cancer. The cancers in these patients appear to develop in a stepwise manner with progressive histological changes from negative for dysplasia → indefinite for dysplasia → dysplasia → cancer. The aim of this study was to determine the timing and extent of genomic instability in the progression of UC dysplasia and cancer. Using two polymerase chain reaction (PCR)-based DNA fingerprinting methods, arbitrarily primed PCR and intersimple sequence repeat PCR, we assessed DNA sequence variation in biopsies across the spectrum of cancerous, dysplastic, and nondysplastic mucosa. UC patients with dysplasia/cancer had substantial genomic instability in both their dysplastic and nondysplastic colonic mucosa, whereas instability was not present in the majority of UC patients without dysplasia/cancer. The degree of instability in nondysplastic tissue was similar to that of dysplastic/cancerous mucosa from the same patient, suggesting that this instability was widespread and reached the maximum level early in neoplastic progression. These results suggest that UC patients who develop dysplasia or cancer have an underlying process of genomic instability in their colonic mucosa whereas UC patients who are dysplasia-free do not.
Ulcerative colitis (UC) is an inflammatory bowel disease, characterized by cycles of inflammation and ulceration of colonic mucosa. Patients with chronic UC have an elevated risk for the development of colorectal cancer, increasing with duration and extent of disease. 1,2 Patients at high cancer risk are advised to undergo colonoscopic surveillance. However, such surveillance is problematic because the colon is a large organ and dysplasia can be focal and endoscopically invisible. Thus, sampling errors are very common in surveillance. A better understanding of the precursors of cancer in UC might help identify early and widespread markers that could be exploited to improve cancer surveillance.
Neoplastic progression in UC occurs in a stepwise manner of histological changes from negative → indefinite for dysplasia → dysplasia → cancer. 3 Unlike sporadic colon cancer, which develops from a distinct adenomatous precursor, dysplasia in UC is often multifocal, and the cancer usually does not destroy its dysplastic precursor. It has been previously shown that aneuploidy, 4 chromosomal alterations detected by comparative genomic hybridization, 5 and p53 loss of heterozygosity and mutation 6 are associated with large field defects in the normal appearing mucosa adjacent to regions of cancer or high-grade dysplasia. Recent studies using fluorescence in situ hybridization suggest that chromosomal instability involves essentially the entire colon when dysplasia or cancer is present. 7 The purpose of this study is to further investigate and characterize the genomic instability present during UC tumorigenesis.
Although measurements of genomic instability can be made by a variety of techniques, polymerase chain reaction (PCR)-based methodologies are especially attractive for this purpose. Inter-simple sequence repeat PCR (ISSR-PCR); 8,9 and arbitrarily primed PCR (AP-PCR) 10,11 are PCR-based DNA fingerprinting techniques that use random primers to amplify the genome. These DNA fingerprinting methods have previously been used to quantify genomic instability in sporadic tumors, adenomas, and matching constitutional DNA. 8,12-14 In this report, we have used ISSR-PCR and AP-PCR to quantify genomic instability in the neoplastic progression of UC tumors. By comparing the DNA fingerprinting patterns of various histological grades of UC dysplasia and cancer with the matching constitutional tissue from the same patient, we were able to quantify the degree of genomic instability for each specimen. Our study demonstrates that increased genomic instability occurs in histologically normal regions, as well as in abnormal regions, of the colon in UC patients with dysplasia/cancer; it is not present in the mucosa of the majority of UC patients who do not have dysplasia/cancer or in non-UC controls. Finally, a novel band from a high-grade dysplasia fingerprint was further characterized to document that the DNA fingerprinting alterations seen in the colonic mucosa of UC-dysplasia patients represent DNA sequence abnormalities.
Materials and Methods
Specimens
Seven non-UC control patients and 21 UC patients were included in this study: 11 with cancer/dysplasia (progressors) and 10 without dysplasia/cancer (nonprogressors). Tissues were collected in accordance with approved Human Subject’s Guidelines at the University of Washington. Of the 11 UC progressors, 2 had a highest histological grade of cancer and 9 had dysplasia. The 10 nonprogressors were long-term UC patients who remained dysplasia-free throughout a period of several years of surveillance. The average age of the 7 non-UC control patients (all male) was 54 years; the average age of the 21 UC patients (10 males and 11 females) was 45 years. The known duration of disease was 22 ± 9 years (mean + SD; range, 3 to 36 years) for UC progressors, and 18 ± 8 years (mean + SD; range, 12 to 37 years) for UC nonprogressors.
The specimens of all progressors and two nonprogressors were obtained from surgical resections; the remaining nonprogressors’ biopsies were obtained at colonoscopy. The progressor samples consisted of a full spectrum of histological grades from 11 patients with dysplasia/cancer: negative for dysplasia, indefinite for dysplasia, low-grade dysplasia, high-grade dysplasia, and when applicable cancer. The diagnosis of dysplasia as a histological category between dysplasia was made according the Inflammatory Bowel Disease/Dysplasia Morphology Study Group (DMSG) consensus criteria 3 with the exception that the indefinite group was not subdivided into three categories.
Efforts were made to have similar levels of inflammation in biopsies from the progressors and nonprogressors. Every biopsy was assessed for inflammation and scored from 0 to 4, with 4 for the severest inflammation. Half of the specimens from the UC nonprogressor patients were selected from active inflammation sites, whereas the other half were from noninflamed sites. The inflammation score for the progressor specimens was 1.3 ± 0.24 and 0.8 ± 0.36 for nonprogressor specimens. All specimens were frozen at −70°C in minimal essential medium with 10% dimethyl sulfoxide until use.
DNA
Colonic epithelial cells were isolated from specimens by ethylenediaminetetraacetic acid shake-off; this provides >90% purity of epithelial cells, as previously described. 7 Peripheral blood lymphocytes or the residual stroma (that was microscopically free of epithelium) were used as constitutional tissue controls. The genomic DNA was extracted by the phenol/chloroform method 15 or filtration column (Qiagen, Valencia, CA).
ISSR-PCR and AP-PCR
ISSR-PCR and AP-PCR were performed as previously described 8,12 with some modifications. Briefly, for AP-PCR, three primers were used separately. They were: MCG1 (5′-AACCCTCACCCTAACCCCAA-3′), Blue (5′-CCGAATTCGCAAAGCTCTGA-3′), and F (5′-ATTCAAGACTGCCTTTCCTA-3′). DNA (5 to 20 ng) was subjected to AP-PCR in 7 μl of reaction mix: 0.3 U of Taq DNA polymerase, PCR reaction buffer (Roche, Indianapolis, IN), 1.5 mmol/L MgCl2, 200 μmol/L each dNTP, 36 ng of primers (end labeled with γ-32P-ATP). The PCR conditions were 94°C for 3 minutes, and then 5 cycles at (94°C for 30 seconds, 50°C for 1 minute, 72°C for 1.5 minutes), followed by 25 cycles at (94°C for 15 seconds, 60°C for 15 seconds, 72°C for 1 minute). Primers CG8RG (5′-CACACACACACACACARG-3′, R = 1:1 A:G) and CG8RY (5′-CACACACACACACACARY-3′, R = 1:1 A:G, Y = 1:1 C:T) were used for ISSR-PCR PCR. Amplification of ISSR-PCR was performed in a 7-μl reaction mixture consisting of 36 ng of primers (end labeled with γ-32P-ATP), 0.3 U of Taq polymerase, PCR buffer, 2% formamide, 200 mmol/L dNTPs, 0.01% Triton X-100, and DNA (5 to 20 ng). After an initial denaturation for 3 minute at 94°C, 30 PCR cycles were performed at (30 seconds at 94°C, 45 seconds at 52°C, and 2 minutes at 72°C), followed by a final 7-minute extension at 72°C. PCR products were analyzed in 6% denaturing polyacrylamide gel. Dried gels were then scanned using a phosphorimager (Molecular Dynamics, Sunnyvale, CA).
Quantification
Band intensity was measured by ImageQuant software (Molecular Dynamics). Bands at the very top and very bottom of the gel (>1400 bp and <200 bp) were less consistent and were excluded from analysis. For each sample, the bands from colonic epithelial DNA were compared to DNA of constitutional stroma or lymphocytes from the same patient. Any band with greater than twofold intensity change compared to the constitutional counterpart was scored as a change. The total number of changes divided by the total number of bands examined was defined as percent alteration or genomic instability.
Statistics
The frequency of genomic instability in the tissue samples of the various histological grades was compared to that in constitutional tissue using a marginal generalized linear model for correlated data, with an independent working correlation matrix. Tests of statistical significance were conducted using a generalized estimating equations generalized Wald test. A similar model and associated test statistic was used to test for a trend in genomic instability across the histological grades. These models and tests account for the repeated, and possibly correlated, observations taken within the same subject. The Wilcoxon rank-sum test was used to test for differences in median genomic instability between UC progressors and UC nonprogressors. Empirical receiver-operator curves (ROC) were used to analyze the sensitivity and specificity of the measure of genomic instability to distinguish progressors from nonprogressors. 16 The ROC curve shows the trade-off between sensitivity and specificity as the threshold for defining a positive test is varied. The optimal cutoff was determined as that corresponding to the ROC point closest to the upper left corner of the plot. Generalized linear models were used to test for association between the degree of genomic alteration and various factors.
Cloning and Sequencing
A small region encompassing the AP-PCR fingerprint band X from the MCG1 primers was excised from the dry gel and incubated in 50 μl of deionized water at 60°C for 30 minutes. 13 One μl of the eluted DNA was reamplified with the MCG1 primers, the PCR product was analyzed on polyacrylamide and agarose gels to confirm its size and purity. The amplified PCR product was cloned into the pGEM-T vector (Promega, Madison, WI). The sequencing was performed with the Big Dyes terminator cycle sequencing kit (Applied Biosystems, Foster City, CA).
Multiplex PCR Assay
The four primer sequences were: SP/LP 5′-ACAGGAATTATGCCCCACAG-3′; SP/RP 5′-AGAGCTGAGTCCCAAGCAAA-3′; intern-2A 5′-CTGTGAATCCAGTGCCCTCT-3′; intern2B 5′-TCTTACCCTGGTTGGAGCAG-3′. Genomic DNA (1.0 ng) or microdissected DNA was subjected to multiplex PCR in 10 μl of reaction mixture: 0.3 U of Taq DNA polymerase, PCR reaction buffer (Roche), 1.5 mmol/L MgCl2, 100 μmol/L each dNTP, 40 ng of each of the four primers. The PCR conditions were 94°C for 2 minutes, and then 36 cycles at (94°C for 10 seconds, 62°C for 30 seconds, 72°C for 1 minute), followed by a final 7-minute extension at 72°C.
Results
Reproducibility and Background Fluctuation
AP-PCR and ISSR-PCR have previously been shown to be reproducible techniques, however understanding the absolute reproducibility of these techniques is essential to the interpretation of results. 8,9,17 Therefore, we conducted a rigorous evaluation of the reproducibility of PCR reactions, DNA extraction methods, and specimen variations. The results are summarized in Figure 1 ▶ , and in general show that both methods of DNA fingerprinting are highly reproducible.
Figure 1.

Reproducibility of ISSR-PCR and AP-PCR. The variation between PCR replicates, DNA quantity, DNA extraction methods, and intertissue were tested. n represents the number of samples tested, and error bars represent SD.
Assay Reproducibility
We first determined the reproducibility of the reaction product fingerprint derived from the same initial DNA but amplified in different PCR reaction tubes (replicates). Twelve pairs of normal colon DNA replicates for ISSR-PCR and 24 pairs of DNA replicates for AP-PCR were included in this experiment to assess this interreaction reproducibility. The average difference, assessed as percent alteration between two replicates was 1.5% (SD = 2%) for ISSR and 2.5% (SD = 2%) for AP-PCR (Figure 1) ▶ . Representative examples of ISSR-PCR and AP-PCR products are shown in Figure 2 ▶ . These results indicate that there is some level of minor variation, even when the DNA is identical, but that this variation is well within the control range suggested by previous studies. 9,17 When the DNA input quantity was varied by threefold, the fingerprint variation was slightly higher, averaging 4.8% altered bands (SD = 2.8%) by ISSR. Finally, we determined the variation between different DNA extraction methods of the same normal colon biopsy sample, using two different methods, phenol extraction and column filtration. The average variation between fingerprints produced using the two different types of DNA extraction was 2.8% (SD = 2.2%).
Figure 2.

Representative examples of genomic instability detected by ISSR-PCR (A) and AP-PCR (B) in UC patients with dysplasia or cancer. The top parts of each figure are the densitometry tracings of each lane of the gel, which is shown below. Altered bands are indicated by arrows; + represents gain, − represents loss.
The above results indicate that the assay variation between different PCR reaction tubes, between different DNA input quantities, or between different DNA extraction methods is within 5%. Because the fingerprint reproducibility is slightly affected by DNA input concentration, we were careful to determine the amount of input DNA.
Interbiopsy Reproducibility
To determine the variation between biopsies of the same histological grade from a single patient, multiple biopsies were chosen from a single UC patient with cancer representing a range of histological grades. To test for the variation between biopsies with the same grade, we obtained four biopsies each of: 1) stroma (constitutional tissue), 2) negative for dysplasia tissue, and 3) cancer from the same cancer patient. By AP-PCR, the average alteration between biopsies of the same histological grade was 4.3% for constitutional tissue, 10.9% (SD = 1.7%) for negative for dysplasia tissue, and 14.1% (SD = 2.1%) for cancer. Our results indicate that different biopsies with the same histological grade have some variation of instability and that this variation in interbiopsy variability is greatest in tissues that contain cancer. Using ISSR-PCR, similar results were obtained: average alteration was 2.1% (SD = 2.5%) for constitutional tissue, 4.3% (SD = 3.5%) for negative for dysplasia tissue, and 18.5% (SD = 10.2%) for cancer.
UC Genomic Instability Detected by ISSR-PCR
Two ISSR-PCR primers (CA8RG and CA8RY) were applied to all of the samples in this study. The average number of bands examined by ISSR-PCR was 55. Lymphocytes or stroma were used as the constitutional control for all comparisons to colonic epithelium. A second, separate control sample from the same patient was also included to give a background level of variation for the assay. As illustrated in Figure 3 ▶ , the average alteration in constitutional tissue (background variation) was 3.6%; this is within the range of the assay variation described above. In UC patients with dysplasia or cancer, the average percent alteration from specimens that were negative for dysplasia was 11.2%, a significant increase compared to constitutional tissue. The average percent alteration in indefinite for dysplasia, low-grade dysplasia, high-grade dysplasia, and cancer were all increased compared to constitutional tissue (Figure 3) ▶ . The difference between constitutional tissue and each UC specimen from every histological category was significant (all P < 0.0002) from UC progressors.
Figure 3.

Genomic instability in UC detected by ISSR-PCR. In A, each line represents one patient, showing the percentage of altered bands in each histological category within that patient’s colon. Also shown are the average percentage altered bands (B), average band gains (C), and losses (D) for each histological category across all patients. Bars indicate ±SEM.
Figure 3, C and D ▶ , shows the data broken down as average genomic gain and genomic loss for each histological category. The genomic gains and losses for each histological category were significantly higher than that of constitutional tissue (all P < 0.008), with the exception of genomic gains in negative for dysplasia specimens (P = 0.13). A generalized estimating equations Wald model was fitted to test if there was any trend of genomic instability across different histological categories of UC. The result was that there was no increase in genomic loss, genomic gain, or total genomic instability with advancing histological grade.
To determine whether the instability as measured by DNA fingerprinting was unique to the colons of UC patients with dysplasia or cancer, five pairs of stroma and epithelium from normal (non-UC) colon specimens were assayed by ISSR-PCR. The average percent alteration from normal colonic epithelium was 2.4% (SEM = 1.0%). Thus, normal colon epithelium demonstrates no excess genomic instability, nor do other noncolonic organs. The percent alteration for liver, lung, heart, spleen, muscle, and brain from the same control, were all <5% (mean, 1.2%; SEM = 0.4%) as determined by ISSR-PCR. Finally, to address the question of whether the gastrointestinal genomic instability found in UC patients with dysplasia or cancer was specific to the large bowel, we examined samples of small bowel from two UC patients with dysplasia. The alterations from these two ileum samples were 4.7% and 4.8% by ISSR-PCR; while the colon epithelium negative for dysplasia from the same two progressor patients showed 13.9% and 9.5% alterations, respectively.
Generalized linear models were used to test for association between the degree of genomic instability and its distance from the nearest high-grade dysplasia or cancerous tissue sample. No significant association was found (R2 = 0.001, P = 0.93). Other factors, including age of onset, duration of disease, degree of inflammation (R2 = 0.05, P = 0.26), primary sclerosing cholangitis status, and gender, were not correlated with the degree of genomic alteration either.
UC Genomic Instability Detected by AP-PCR
We performed AP-PCR on the same specimens that were tested by ISSR-PCR. Three AP-PCR primers were applied in this study, and an average of 91 bands was examined for each specimen. As shown in Figure 4 ▶ , the average alteration between two constitutional tissues was 2.5%; this is similar to the low background variation seen with ISSR-PCR. Instability was significantly higher in all colonic epithelium from UC progressors: the average alteration was 9.7% for negative for dysplasia, 12.2% for indefinite for dysplasia, 13.4% for low-grade dysplasia, and 13.0% for high-grade dysplasia/cancer (all P < 0.001 compared to constitutional). Increased genomic gains (Figure 4C) ▶ as well as genomic losses (Figure 4D) ▶ were seen in all histological categories, and were also significant compared to that constitutional tissue (all P < 0.002). Trend analysis showed a significant trend of increasing genomic losses with increased histological grade (P = 0.022). However, there was not a significant trend for genomic gains or total genomic instability with advancing neoplastic grade.
Figure 4.

Genomic instability in UC detected by AP-PCR. In A, each line represents one patient, showing the percentage of altered bands in each histological category within that patient’s colon. Also shown are the average percentage altered bands (B), average band gains (C), and losses (D) for each histological category across all patients. Bars indicate ±SEM.
A number of normal control studies were also performed using AP-PCR. Alterations in five normal colons, two samples of small bowel from two UC patients with dysplasia, and multiple tissue sources from a normal control were all <5% as determined by AP-PCR.
Using generalized linear models, there was a weak association between the degree of genomic instability detected by AP-PCR and its distance from the nearest high-grade dysplasia or cancerous tissue sample (R2 = 0.46, P = 0.03). Other factors including age of onset, duration of disease, degree of inflammation (R2 = 0.01, P = 0.59), primary sclerosing cholangitis status, and gender were not correlated with the degree of genomic alteration.
Correlation of AP-PCR and ISSR-PCR Data
Both AP-PCR and ISSR-PCR had demonstrated increased genomic instability in colonic epithelium from UC progressors. A simple regression analysis revealed that there was a strong correlation between AP-PCR and corresponding ISSR-PCR results: P < 0.001, R2 = 0.545.
Genomic Instability in UC Nonprogressors
We have demonstrated that UC patients with dysplasia/cancer (progressors) have widespread genomic instability, including nondysplastic regions, as measured by AP-PCR and ISSR-PCR. We wished to determine whether UC patients who have never had dysplasia or cancer during 10 years or greater duration of UC (nonprogressors) had evidence of genomic instability. Negative specimens from patients from these two categories (progressors and nonprogressors) were tested for genomic instability by AP-PCR and ISSR-PCR.
Figure 5 ▶ illustrates the comparison of genomic instability in the colons of UC progressors and nonprogressors. For AP-PCR, the median alteration for progressors was 10.1% in negative for dysplasia specimens, this is significantly different from the median alteration of nonprogressors, which was 4.3% (P = 0.03). Separated into genomic gain and genomic loss from the total altered bands, only genomic loss showed a significant difference between progressors and nonprogressors (P = 0.04). For ISSR-PCR, the median alteration for progressors was 13.2%, this was also significantly different from nonprogressors, which was 4.6% (P = 0.04). Again, only genomic loss showed a significant difference between progressors and nonprogressors (P = 0.026; for genomic gain, P = 0.42).
Figure 5.
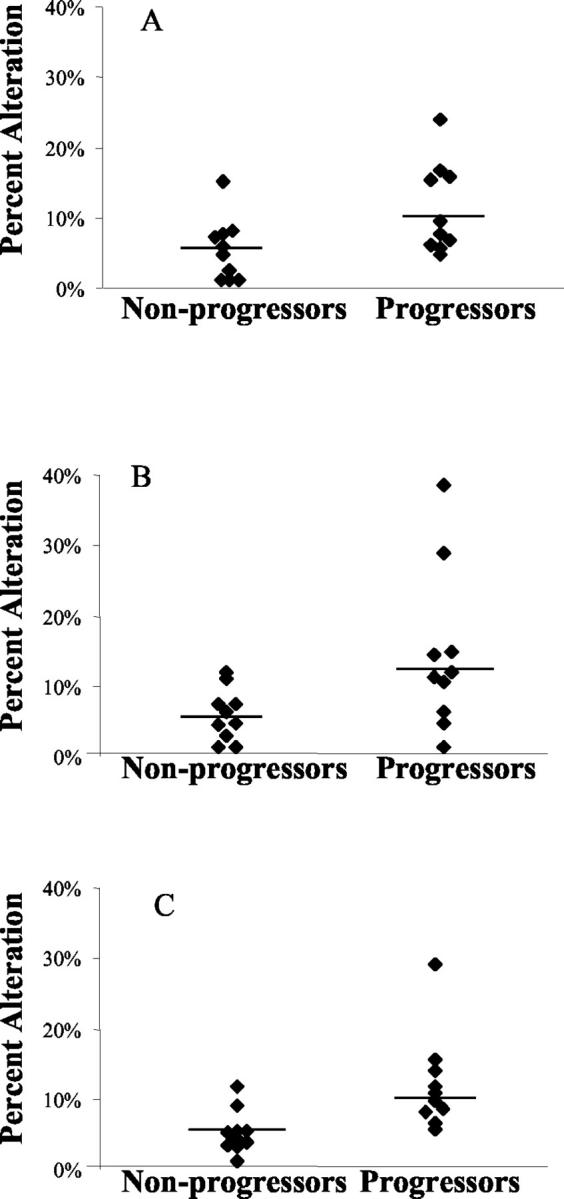
Genomic instability of biopsies negative for dysplasia from UC progressors and UC nonprogressors. Data shown were genomic instability detected by AP-PCR (A), ISSR-PCR (B), and combined ISSR-PCR and AP-PCR (C). Each dot represents a case, and the line represents the median value of that category. Note that the combination of both DNA fingerprinting techniques provides the best sensitivity and specificity for instability.
Because AP-PCR and ISSR-PCR are separate and independent measures of genomic instability, we summed the alterations measured by each method to obtain the maximum confidence in the data. Using this combined analysis, the median percent alteration in negative for dysplasia specimens was 10.8% for UC progressors, which was significantly different from 4.1% seen in UC nonprogressors (P = 0.002). Total ISSR-PCR and AP-PCR losses in UC progressors is higher than that of nonprogressors (P = 0.005), but gains were not significantly different (P = 0.15).
The sensitivity and specificity of colonic genomic instability for distinguishing UC progressors’ negative biopsies from UC nonprogressors’ biopsies were determined by ROC analysis. Sensitivity in this context refers to the probability of a positive test result in an individual UC progressor biopsy (true positive). Specificity refers to the probability that the test is negative in a UC nonprogressor biopsy (true negative). Table 1 ▶ shows the optimum combinations of sensitivity and specificity derived from ROC analysis. Different cutoff values generated different sensitivity and specificity. Analysis by AP-PCR results or ISSR-PCR results yielded fair sensitivity (0.8 and 0.7, respectively). However, from the combined ISSR-PCR and AP-PCR analyses, a cutpoint of 4.4% alteration achieved optimum sensitivity (1.0) and specificity (0.8) for distinguishing UC progressor-negative biopsies from UC nonprogressor biopsies. Results from genomic loss were almost as good as those from total genomic instability.
Table 1.
Optimal Sensitivity and Specificity of Genomic Instability for Discriminating Histologically Negative UC Progressor from UC Nonprogressor Biopsies
| Genomic instability | Sensitivity | Specificity | Cutoff value, % |
|---|---|---|---|
| AP-PCR | |||
| Gain | 0.5 | 1.0 | 6.70 |
| Loss | 0.7 | 0.8 | 3.80 |
| Total | 0.8 | 0.6 | 5.10 |
| ISSR-PCR | |||
| Gain | 0.5 | 0.9 | 4.40 |
| Loss | 0.7 | 0.9 | 4.30 |
| Total | 0.7 | 0.8 | 9.50 |
| AP-PCR + ISSR-PCR | |||
| Gain | 0.5 | 1.0 | 5.80 |
| Loss | 0.9 | 0.8 | 2.90 |
| Total | 1.0 | 0.8 | 4.40 |
Cloning and Characterization of a Novel AP-PCR Product
To demonstrate that the DNA fingerprinting gains and losses actually translate into sequence changes in DNA, a gained AP-PCR band, designated as band X, was further characterized. As shown in Figure 6 ▶ , band X appeared as gain of a new band, only in high-grade dysplasia lanes (Figure 6A) ▶ . Subsequent cloning and sequencing of this band X revealed that its size was 386 bp. A Blast search of the National Center for Biotechnology Information nucleotide database revealed that band X matched to human DNA sequence on chromosome 6p12.1-21.1, position 48.6 Mb, but with an internal deletion of 1015 bp (Figure 6B) ▶ . The deleted region involves an inverted Alu-repeat.
Figure 6.

Cloning and characterization of a novel AP-PCR product band X. A: Fingerprint from AP-PCR. The arrow indicates the position where band X was located. B: The positions of primers and inverted Alu repeats on band X sequence. The dotted line represents the deleted sequence in high-grade dysplasia. C: Multiplex PCR of genomic DNA, the upper band indicates the presence of DNA with deletion, the lower bands indicate the presence of normal DNA. D: Multiplex PCR of microdissected DNA. NL, DNA from normal individual; F1 to F9, microdissected fractions 1 to 9.
To verify that this deletion in chromosome 6p generated the novel AP-PCR product (band X), a multiplex PCR with two sets of PCR primers was designed (Figure 6B) ▶ : 1) primers SP-LP and SP-RP, located external to the deleted region, verified the presence of mutant DNA with a PCR product of 315 bp. It also generated a 1330-bp PCR product for normal DNA; however, this normal 1330-bp product was not readily amplified, and thus, a second set of primers was designed; 2) internal primers located within the deleted region, verified the presence of normal DNA by a PCR product of 250 bp. Multiplex PCR using these two sets of primer confirmed the presence of DNA with the expected deletion in the high-grade dysplasia biopsy previously used for AP-PCR (Figure 6C) ▶ .
To understand how widespread the DNA sequence change might be, we next tested for this deletion in adjacent biopsies using the multiplex PCR assay. None of the seven nearest biopsies had a detectable deletion. To further uncover the extent of the band X change within a single biopsy, a 2 × 40 μmol/L section from the paraffin-embedded tissue was placed onto a slide. This 2 × 40 μmol/L section was divided into nine fractions, epithelium from each fraction was microdissected out into PCR tubes and multiplex PCR was performed. As shown in Figure 6D ▶ , fractions 7 to 9 demonstrate the presence of deletion, whereas the rest only show the presence of the normal product. These results suggest that this deletion occurs only in a small portion of the epithelium. Thus, although the process of instability is widespread throughout the colons of UC progressors, the individual gains and losses are focal.
Discussion
In this report, we have applied methods of DNA fingerprinting to quantitatively measure genomic instability during UC neoplastic progression. Our data shows that instability is present in nondysplastic mucosa of UC patients with dysplasia or cancer elsewhere, and persists at a similar level throughout the histological progression to cancer. The genomic instability is restricted to the colon and does not occur in the small bowel or in organs outside the gastrointestinal tract. We have used rigorous methods testing assay reproducibility to ensure that the findings are not spurious.
To demonstrate that the band changes found in DNA fingerprinting represent actual DNA sequence changes, we investigated a novel band gain from one of the high-grade dysplasia samples (band X). The gain of band X was a result of a deletion in a repetitive sequence-rich region containing inverted Alu-repeats. Thus, this gained band appearing in the DNA fingerprint represents actual DNA sequence change.
Genomic instability in negative biopsies from UC patients with dysplasia (progressors) is significantly higher than the instability of UC patients who are dysplasia/cancer-free (nonprogressors). The sensitivity and specificity of genomic instability, as measured by DNA fingerprinting, for distinguishing UC progressors from UC nonprogressors is excellent. From the combined ISSR-PCR and AP-PCR analyses, a cutpoint of 4.4% alteration achieved optimum sensitivity (1.0) and specificity (0.8) for distinguishing UC progressors from UC nonprogressors (Table 1) ▶ . This is no small feat, given the difficulties associated with the clinical detection of dysplasia in UC patients. The colon is ∼3 feet long and dysplasia/cancer can be endoscopically invisible. The ability to surveillance the colon for neoplastic change is hampered by sampling problems (biopsies are the size of a piece of rice) and by the fact that experienced gastrointestinal pathologists are required to interpret the biopsy histology. The fact that the DNA fingerprinting abnormalities in the progressors are widespread and present in even the nonneoplastic mucosa makes it plausible to consider the use of a simple rectal biopsy to help identify UC patients who are likely to have neoplasia from those who have not. Such an approach would require prospective study, however the potential for using a biomarker as an adjunct to the time-intensive, and costly methods of colonoscopic surveillance would be quite valuable.
DNA fingerprinting has identified genomic instability in sporadic colon cancers and adenomas, but it is not present in nondysplastic tissues from the sporadic cases. 14 In contrast, UC instability measured by DNA fingerprinting is widespread, precedes neoplastic transformation; and may be related to the extensive and chronic inflammation that defines UC. These observations parallel the pathobiology of UC cancers, which differ from sporadic colon cancers, in that UC neoplasia is frequently multifocal, widespread, and may occur in flat mucosa.
Why does this instability occur? UC colonocytes are subject to high levels of genetic damage. Chronic inflammation in UC has been associated with elevated levels of reactive oxygen species and reduced oxidative defenses, both of which might contribute to genetic damage. 18-25 Reactive oxygen species induce damage to DNA in the form of base alterations, abasic sites, and strand breaks; because AP-PCR and ISSR-PCR can sensitively measure DNA mutations and rearrangements, each of these types of damage could cause the genomic instability detected. Thus, we postulate that in a subset of UC patients (ie, the progressors), the colonic epithelium is damaged by reactive oxygen species and this, in turn, leads to the observed genomic instability and eventually tumor progression. In support of this hypothesis, we have previously described microsatellite instability in the nondysplastic mucosa of UC patients with dysplasia and cancer, 26 as well as chromosomal instability measured by fluorescence in situ hybridization 7 and comparative genomic hybridization. 5 Moreover, we have demonstrated that microsatellite instability can be caused by reactive oxygen species. 27
Genomic instability occurs at the same level (∼10%) throughout the neoplastic progression in UC, as measured by both ISSR-PCR and AP-PCR. Thus, the genomic instability does not accumulate as the neoplasia progresses, but rather occurs very early and stays at a steady level. A steady state of instability may reflect a maximal tolerated degree of genetic damage and the dynamic rate of cell death, repair, and cell turnover in the UC colon.
The nonprogressor patients may be subject to less oxidative stress in their colon than UC progressors, or perhaps they have a lower susceptibility to developing genomic instability after oxidative stress because of better protective mechanisms. For example, glutathione and glutathione S-transferase levels vary in UC patients and could influence the levels of oxygen-free radicals. 28 A small amount of heterogeneity is also found in the nonprogressor cohort: ∼20% of the patients demonstrated increased genomic instability in negative colonic mucosa at the optimized combination of sensitivity and specificity. Certainly the percentage showing instability approximates the percentage of patients with negative histology that one might anticipate to histologically progress in the next 20 to 30 years. 1 If this can be confirmed by future prospective study, measurement of genomic instability could be applied to identify those UC patients at increased risk of future cancer progression.
The finding of widespread genomic instability in UC patients with neoplasia is important for several reasons: 1) it sheds light on the underlying mechanism of UC tumorigenesis, one of a mutator phenotype. 2) It may provide a molecular biomarker for patients who have neoplasia or might develop it in the future, offering a needed adjunct to histological-based surveillance. 3) It opens the door to address new key questions, such as why it is that some UC patients have a mutator phenotype, while others do not.
Footnotes
Address reprint requests to Teri A. Brentnall, M.D., Division of Gastroenterology, University of Washington, Seattle, WA 98195. E-mail: teribr@u.washington.edu.
Supported by the National Institutes of Health (grant R01CA68124).
The contents of this work are solely the responsibility of the authors and do not necessarily represent the official views of the National Institutes of Health.
References
- 1.Ekbom A, Helmick C, Zack M, Adami HO: Ulcerative colitis and colorectal cancer. A population-based study. N Engl J Med 1990, 323:1228-1233 [DOI] [PubMed] [Google Scholar]
- 2.Prior P, Gyde SN, Macartney JC, Thompson H, Waterhouse JA, Allan RN: Cancer morbidity in ulcerative colitis. Gut 1982, 23:490-497 [DOI] [PMC free article] [PubMed] [Google Scholar]
- 3.Riddell RH, Goldman H, Ransohoff DF, Appelman HD, Fenoglio CM, Haggitt RC, Ahren C, Correa P, Hamilton SR, Morson BC: Dysplasia in inflammatory bowel disease: standardized classification with provisional clinical applications. Hum Pathol 1983, 14:931-968 [DOI] [PubMed] [Google Scholar]
- 4.Burmer GC, Rabinovitch PS, Haggitt RC, Crispin DA, Brentnall TA, Kolli VR, Stevens AC, Rubin CE: Neoplastic progression in ulcerative colitis: histology, DNA content, and loss of a p53 allele. Gastroenterology 1992, 103:1602-1610 [DOI] [PubMed] [Google Scholar]
- 5.Willenbucher RF, Aust DE, Chang CG, Zelman SJ, Ferrell LD, Moore DH, Waldman FM: Genomic instability is an early event during the progression pathway of ulcerative-colitis-related neoplasia. Am J Pathol 1999, 154:1825-1830 [DOI] [PMC free article] [PubMed] [Google Scholar]
- 6.Brentnall TA, Crispin DA, Rabinovitch PS, Haggitt RC, Rubin CE, Stevens AC, Burmer GC: Mutations in the p53 gene: an early marker of neoplastic progression in ulcerative colitis. Gastroenterology 1994, 107:369-378 [DOI] [PubMed] [Google Scholar]
- 7.Rabinovitch PS, Dziadon S, Brentnall TA, Emond MJ, Crispin DA, Haggitt RC, Bronner MP: Pancolonic chromosomal instability precedes dysplasia and cancer in ulcerative colitis. Cancer Res 1999, 59:5148-5153 [PubMed] [Google Scholar]
- 8.Basik M, Stoler DL, Kontzoglou KC, Rodriguez-Bigas MA, Petrelli NJ, Anderson GR: Genomic instability in sporadic colorectal cancer quantitated by inter-simple sequence repeat PCR analysis. Genes Chromosom Cancer 1997, 18:19-29 [PubMed] [Google Scholar]
- 9.Zietkiewicz E, Rafalski A, Labuda D: Genome fingerprinting by simple sequence repeat (SSR)-anchored polymerase chain reaction amplification. Genomics 1994, 20:176-183 [DOI] [PubMed] [Google Scholar]
- 10.Welsh J, McClelland M: Fingerprinting genomes using PCR with arbitrary primers. Nucleic Acids Res 1990, 18:7213-7218 [DOI] [PMC free article] [PubMed] [Google Scholar]
- 11.Williams JG, Kubelik AR, Livak KJ, Rafalski JA, Tingey SV: DNA polymorphisms amplified by arbitrary primers are useful as genetic markers. Nucleic Acids Res 1990, 18:6531-6535 [DOI] [PMC free article] [PubMed] [Google Scholar]
- 12.Malkhosyan S, Yasuda J, Soto JL, Sekiya T, Yokota J, Perucho M: Molecular karyotype (amplotype) of metastatic colorectal cancer by unbiased arbitrarily primed PCR DNA fingerprinting. Proc Natl Acad Sci USA 1998, 95:10170-10175 [DOI] [PMC free article] [PubMed] [Google Scholar]
- 13.Peinado MA, Malkhosyan S, Velazquez A, Perucho M: Isolation and characterization of allelic losses and gains in colorectal tumors by arbitrarily primed polymerase chain reaction. Proc Natl Acad Sci USA 1992, 89:10065-10069 [DOI] [PMC free article] [PubMed] [Google Scholar]
- 14.Stoler DL, Chen N, Basik M, Kahlenberg MS, Rodriguez-Bigas MA, Petrelli NJ, Anderson GR: The onset and extent of genomic instability in sporadic colorectal tumor progression. Proc Natl Acad Sci USA 1999, 96:15121-15126 [DOI] [PMC free article] [PubMed] [Google Scholar]
- 15.Davis LG, Dibner MD, Battery JF: Preparation of DNA from eucaryotic cells. Davis LG Dibner MD Battery JF eds. Basic Methods in Molecular Biology. 1986:pp 44-46 Elsevier, New York
- 16.Pagano M, Gauvreau K: Principles of Biostatistics. 1993. Duxbury Press, Belmont
- 17.Arribas R, Tortola S, Welsh J: Arbitrarily primed PCR and RAPDs. Micheli MR Bova R eds. Fingerprinting Methods Based on Arbitrarily Primed PCR. 1996:pp 47-53 Springer-Verlag, Heidelberg
- 18.Ames BN, Shigenaga MK, Hagen TM: Oxidants, antioxidants, and the degenerative diseases of aging. Proc Natl Acad Sci USA 1993, 90:7915-7922 [DOI] [PMC free article] [PubMed] [Google Scholar]
- 19.Beckman KB, Ames BN: Oxidative decay of DNA. J Biol Chem 1997, 272:19633-19636 [DOI] [PubMed] [Google Scholar]
- 20.Buffinton GD, Doe WF: Depleted mucosal antioxidant defences in inflammatory bowel disease. Free Radic Biol Med 1995, 19:911-918 [DOI] [PubMed] [Google Scholar]
- 21.Cerutti PA: Prooxidant states and tumor promotion. Science 1985, 227:375-381 [DOI] [PubMed] [Google Scholar]
- 22.Feig DI, Reid TM, Loeb LA: Reactive oxygen species in tumorigenesis. Cancer Res 1994, 54:1890s-1894s [PubMed] [Google Scholar]
- 23.Holmes EW, Yong SL, Eiznhamer D, Keshavarzian A: Glutathione content of colonic mucosa: evidence for oxidative damage in active ulcerative colitis. Dig Dis Sci 1998, 43:1088-1095 [DOI] [PubMed] [Google Scholar]
- 24.Lih-Brody L, Powell SR, Collier KP, Reddy GM, Cerchia R, Kahn E, Weissman GS, Katz S, Floyd RA, McKinley MJ, Fisher SE, Mullin GE: Increased oxidative stress and decreased antioxidant defenses in mucosa of inflammatory bowel disease. Dig Dis Sci 1996, 41:2078-2086 [DOI] [PubMed] [Google Scholar]
- 25.McKenzie SJ, Baker MS, Buffinton GD, Doe WF: Evidence of oxidant-induced injury to epithelial cells during inflammatory bowel disease. J Clin Invest 1996, 98:136-141 [DOI] [PMC free article] [PubMed] [Google Scholar]
- 26.Brentnall TA, Crispin DA, Bronner MP, Cherian SP, Hueffed M, Rabinovitch PS, Rubin CE, Haggitt RC, Boland CR: Microsatellite instability in nonneoplastic mucosa from patients with chronic ulcerative colitis. Cancer Res 1996, 56:1237-1240 [PubMed] [Google Scholar]
- 27.Jackson AL, Chen R, Loeb LA: Induction of microsatellite instability by oxidative DNA damage. Proc Natl Acad Sci USA 1998, 95:12468-12473 [DOI] [PMC free article] [PubMed] [Google Scholar]
- 28.Sido B, Hack V, Hochlehnert A, Lipps H, Herfarth C, Droge W: Impairment of intestinal glutathione synthesis in patients with inflammatory bowel disease. Gut 1998, 42:485-492 [DOI] [PMC free article] [PubMed] [Google Scholar]