

Abstract
Gene amplification is an important mechanism of oncogene activation in various human cancers, including ovarian carcinomas (OvCas). We used restriction landmark genomic scanning (RLGS) to detect amplified DNA fragments in the genomes of 47 primary OvCas. Visual analysis of the RLGS gel images revealed several OvCa samples with spots of greater intensity than corresponding spots from normal tissues, indicating possible DNA amplification in specific tumors. Two primary tumors (E1 and S12) shared four high-intensity spots. A recently developed informatics tool termed Virtual Genome Scans was used to compare the RLGS patterns in these tumors with patterns predicted from the human genome sequence. Virtual Genome Scans determined that three of the four fragments localized to chromosome 1p34-35, a region containing the proto-oncogene L-MYC. Sixty-eight primary OvCas, including 40 analyzed by RLGS, were screened by quantitative polymerase chain reaction (PCR) for possible amplification of L-MYC. Ten tumors with increased L-MYC copy number were identified, including tumor E1, which showed an ∼24-fold increase in copy number compared to normal DNA. Southern analysis of several tumors confirmed the quantitative PCR results. Using sequence tagged site (STS) markers flanking L-MYC, increased DNA copy number in tumor E1 was found to span the region flanking L-MYC between D1S432 and D1S463 (≈3.1 Mb). Other tumors showed amplification only at the L-MYC locus. Using oligonucleotide microarrays, L-MYC was found to be more frequently overexpressed in OvCas than either c-MYC or N-MYC relative to ovarian surface epithelium. Quantitative reverse transcriptase-PCR analysis confirmed elevated L-MYC expression in a substantial fraction of OvCas, including nine of nine tumors with increased L-MYC copy number. The data implicate L-MYC gene amplification and/or overexpression in human OvCa pathogenesis.
Gene amplification is a major mechanism underlying activation of human proto-oncogenes in tumor cells. 1 Amplification of a variety of oncogenes, such as HER-2/NEU and c-MYC, has been reported in many types of primary human cancers, including those of the colorectum, 2 prostate, 3 breast, 4,5 lung, 6,7 cervix, 8 and ovary. 9 Although oncogene amplification can be a relatively early event in tumorigenesis, it is more often observed in advanced stages of cancer. 10-14
Ovarian carcinoma (OvCa) is the leading cause of death from gynecological malignancy in the United States, with ∼23,000 new cases diagnosed and 14,000 deaths annually. 15 A number of genetic alterations have been described in OvCas, with many observed preferentially in specific histological types. 16,17 These alterations can be hereditary (eg, inactivation of BRCA1 and BRCA2) or somatic. 18 A few oncogenes have been shown to be amplified in a subset of OvCas. For example, somatic amplification of the HER-2/NEU gene on chromosome 17q has been observed in primary OvCas, although the frequency with which amplification is reported to occur is quite variable (0 to 66%). 4,19-21 This wide range likely reflects, at least in part, methodological differences and sample size and tumor specimen variability from study to study. Similarly, amplification of c-MYC on chromosome 8 has been observed in up to 40% of primary OvCas. 22-25
Restriction landmark genome scanning (RLGS) has been widely used for comparison of genomic DNA copy number, 11,26-31 and to detect changes in DNA methylation among related tissues of interest. 32-35 For RLGS, genomic DNA is cleaved with a rare-cutting restriction endonuclease and the cleavage sites are radioactively labeled before first-dimension electrophoresis. The separated DNA fragments are then digested in situ with a frequent-cutting restriction endonuclease before second-dimension electrophoresis. The use of the methylation-sensitive endonuclease NotI to digest genomic DNA before labeling allows visualization of DNA fragments (landmarks) that occur preferentially in CpG islands, and hence near the vicinity of coding sequences. 36 Approximately 3000 to 4000 spots, each representing a specific chromosomal segment, can be visualized on a two-dimensional gel image. Gel spot images of labeled DNA fragments can be quantitatively compared between tissues of interest. At least two factors have hindered the ability to rapidly identify genes within amplified DNA fragments identified by RLGS: difficulty cloning the extremely small amount of DNA from two-dimensional spots of interest, and difficulty deriving sequence information for displayed fragments. The Virtual Genome Scans (VGS) informatics tool recently developed by Rouillard and colleagues, 37 applies the same set of restriction enzymes used in actual two-dimensional gel experiments to the genome sequence databases and computationally overlays the predicted fragment locations on actual RLGS images. This permits tentative identification of fragments of interest, and can lead to confident predictions if additional information is known, such as a fragment’s chromosomal location or origin or knowledge that a set of fragments originates from a single, perhaps unknown, chromosome. 30,38 We used a combination of RLGS and VGS to identify additional genes frequently amplified in ovarian cancer. DNA samples from 47 primary OvCas were compared to normal controls. We show that the L-MYC gene on chromosome 1p34 is amplified and overexpressed in a subset of OvCas.
Materials and Methods
Tumor Samples
Seventy-five OvCas were studied by RLGS and/or quantitative polymerase chain reaction (PCR) analyses, including 6 clear cell, 7 mucinous, 32 endometrioid, and 30 serous adenocarcinomas. Eight were obtained from the University of Michigan Health System, 11 from Cornell University Hospital, 24 from the Cooperative Human Tissue Network, and 32 from the Johns Hopkins Medical Institutions. All samples were kept frozen at −80°C before microdissection and DNA extraction. Primary tumor tissues were manually microdissected before DNA extraction to ensure each tumor sample contained at least 70% neoplastic cells. Hematoxylin and eosin-stained frozen sections were used as dissection guides. Analysis of tissues from human patients was approved by the University of Michigan’s Institutional Review Board (IRB-MED no. 2001-0022).
Genomic DNA Isolation, RNA Extraction, and Reverse Transcription
Genomic DNA was extracted from frozen tumor tissues by standard proteinase K digestion and phenol/chloroform extraction. Total RNA was extracted using Trizol reagent (Invitrogen, Gaithersburg, MD), according to the manufacturer’s instructions. Reverse transcription was performed with 5 μg of RNA, random hexamers (Amersham Pharmacia Biotech, Piscataway, NJ), and Superscript II reverse transcriptase (Invitrogen).
Restriction Landmark Genome Scanning (RLGS)
DNA samples from 47 primary ovarian tumors (28 serous, 6 clear cell, 7 endometrioid, and 6 mucinous adenocarcinomas) were analyzed by RLGS. The enzymatic digestions, DNA labeling, and electrophoresis were performed as previously described. 39 Briefly, 5 μg of genomic DNA was digested with NotI and the 5′-protruding ends were end-labeled with [α-32P]dCTP and [α-32P]dGTP (New Life Science Products, Boston, MA). A second enzyme, EcoRV, was used to further digest the DNA fragments before size fractionation (1.0 to 5.0 kb) in the first dimension in 32-cm 0.9% disk-agarose gels. The separated DNA fragments were then digested in situ with HinfI for further cleavage before second-dimension separation in large format (25 × 43 cm) 5.2% polyacrylamide slab gels. The gels were then dried and exposed to PhosphorImager screens and scanned with a PhosphorImager (Molecular Dynamics, Sunnyvale, CA) at a resolution of 176 μm per pixel. Digitized images were translated into 1024 × 1024 pixel formats, suitable for VISAGE software (BioImage, Ann Arbor, MI), which was used to perform spot (fragment) detection and quantitation. Amplification of specific fragments was estimated by comparing spot intensities in tumor samples to spot intensities in normal (nontumor) DNA from 10 OvCa patients.
Semiquantitative Multiplex PCR
The sequences of oligonucleotides used for PCR are summarized in Table 1 ▶ . DNA microsatellite markers in the 1p34 amplicon were selected by sequence tagged site (STS) database analyses. The amplified fragment was used as the anchor to select neighboring STS markers. Primers for each selected marker were chosen using DNASTAR software to ensure that the melting temperature (Tm) of the STS PCR fragments was nearly equivalent to the Tm of the co-amplified internal control (ATPase or GAPDH). Each PCR reaction contained 2 μCi of [α-32P]dCTP (ICN, Costa Mesa, CA); 25 μmol/L dCTP; 200 μmol/L dATP, dGTP, and TTP; 1 μmol/L of each primer (both target gene and internal control); 1 U of Taq polymerase (Invitrogen) or FastStart Taq polymerase (Roche, Indianapolis, IN); and 20 ng of genomic DNA. After 22 to 28 cycles of PCR, products were resolved on 6% denaturing polyacrylamide gels. After drying, the gels were exposed to PhosphoImager screens (Molecular Dynamics). To determine the level of target gene amplification in tumors, tumor and normal samples were compared after normalizing target gene values with the values for the co-amplified internal control gene in the same samples. All reactions were performed at least twice. Tumor samples showing increased (>2 fold) DNA copy number at selected markers were further analyzed, and the minimal amplified region was determined using additional flanking markers.
Table 1.
Oligonucleotide Sequences
| Markers | Sequences | Size (bp) | GenBank ID | |
|---|---|---|---|---|
| D1S2368 | Forward | CTAATCACAGTAGCACTGAACATGG | 182 | |
| Reverse | CCTAGTGCTGGGAGTTCAGT | |||
| D1S432 | Forward | CAGAGGTTCTGGTGAGCAG | 163 | |
| Reverse | CCCTGGTACCCCATAGTAG | |||
| WI-15142 | Forward | ATTTTTACACACTTTGACAAGGAGG | 157 | |
| Reverse | CACATTGGCAAGGGGGAG | |||
| stSG48383 | Forward | CCATTTTCTAATTTTCTTCGCA | 138 | XM_044944 |
| Reverse | GGTCCTGGAAGCTGACGTA | |||
| WI-12773 | Forward | CGCAAATTTCAAAGTCTTTGGT | 146 | |
| Reverse | GATTTGAGTGAATGGCAGGAA | |||
| A002R05 | Forward | GAGGTGGTTGACTTTCTCATGT | 158 | |
| Reverse | AGTCCACCACTGTGTAATTGGT | |||
| L-MYC (exon 2) | Forward | GGACATCTGGAAGAAATTCGA | 191 | M19720 |
| Reverse | CGTATGATGGAGGCGTAGTT | |||
| L-MYC (exon 3) | Forward | CCATCAGCAACAGCACAACTA | 178 | M19720 |
| Reverse | CACTTTCTACAGGTGGGGGA | |||
| D1S2743 | Forward | GGTTTCACTGTAGCACCACT | 176 | |
| Reverse | CTTGAACAGGAATGTGTGTGT | |||
| A008Q33 | Forward | TTTCCTTAGCAATTCCTTTAGTA | 184 | |
| Reverse | GTGCTCGTTTTTTAGAGATACAT | |||
| D1S463 | Forward | TGCATTTTGTTTTCACATCTGT | 164 | |
| Reverse | GTGTTAACCACCTCCCTTCA | |||
| ATPase | Forward | CCCCTGCTCCAGAATTTTC | 165 | M30310 |
| Reverse | GTTCATCCATGTCCCTGTC | |||
| GAPDH | Forward | GCCAAAAGGGTCATCATCTCT | 182 | XM_066753 |
| Reverse | GGTCATGAGTCCTTCCACGA | |||
| TaqMan Primer/Probe Set | ||||
| L-MYC | Forward | TGGATCCCTGCATGAAGCA | 70 | M19720 |
| Reverse | AGGAAAACGGGCAGCATAGTT | |||
| TaqMan probe | 6FAM-CCACATCTCCATCCATCAGCAACAGC | |||
| ATPase | Forward | AGATCCTGGCGCGAGATG | 73 | M30310 |
| Reverse | CCGACAAAACTTGATCCATTCA | |||
| TaqMan probe | VIC-CCCAACGCCCTCACTCCCCCT | |||
| HPRT1 | Forward | TTGCTCGAGATGTGATGAAGGA | 93 | NM_000194 |
| Reverse | CCAGCAGGTCAGCAAAGAATT | |||
| TaqMan probe | VIC-CCATCACATTGTAGCCCTCTGTGTGCTC | |||
| Probe for Southern blot | ||||
| L-MYC | Forward | GCTGCAGGGGAAAAGGAAGAT | M19720 | |
| Reverse | CTAAAGGGGAGAGGGAGGTT | 449 | ||
| β-actin | Forward | GGCACCACACCTTCTACAATG | M10027 | |
| Reverse | CTCCTTAATGTCACGCACGA | 780 |
Quantitative PCR and RT-PCR
Primer Express (version 1.0; PE Applied Biosystems, Foster City, CA) was used to select the primer and probe sequences for quantitative PCR (Table 1) ▶ . The L-MYC probe was labeled with the reporter dye 6-carboxy fluorescein (FAM) and the ATPase and HPRT1 probes with the reporter dye VIC. Primers and probes for quantitative PCR were purchased from PE Applied Biosystems. Quantitative PCR was performed using an ABI Prism 7700 Sequence Analyzer (PE Applied Biosystems) in 25-μl reactions containing 1× Universal PCR mix, 200 nmol/L of each forward and reverse primer, 200 nmol/L of each probe, and 20 ng of genomic DNA. Each 40-cycle reaction was set up in duplicate. For quantitative RT-PCR, all RNA samples were pretreated with DNaseI to avoid amplification of contaminating genomic DNA and 10 to 20 ng of first strand cDNA was amplified in each reaction. Quantitative PCR reactions for target and internal control genes (ATPase on chromosome 1p13 for genomic DNA, HPRT1 for cDNA) were performed in separate tubes. The comparative threshold cycle (CT) method was used for the calculation of amplification fold as specified by the manufacturer.
Southern Blot Analysis
For Southern blotting, 8 μg of genomic DNA from each sample was digested with EcoRI at 37°C overnight, separated in 0.8% agarose gels, and transferred to Zeta-probe membranes with 0.4 N NaOH as described by the supplier (Bio-Rad, Richmond, CA). Membranes were prehybridized in Rapid-hyb buffer (Amersham Pharmacia Biotech) at 65°C for 1 hour and hybridized overnight with a 449-bp genomic [α-32P]dCTP-labeled L-MYC probe (3000 Ci/mmol, Amersham Pharmacia Biotech). Blots were stripped and rehybridized with a β-actin probe as a loading control. The membranes were exposed to Kodak X-ray film overnight at −80°C.
Evaluation of c-MYC, L-MYC, and N-MYC Expression Using Affymetrix Oligonucleotide Microarrays
The results of global gene expression profiling of 113 primary OvCas using Affymetrix HuGeneFL oligonucleotide microarrays have recently been reported in detail. 40 These 113 tumors included 29 of the 75 used for studies described here. Briefly, the preparation of cRNA, hybridization, and scanning of the microarrays were performed according to the manufacturer’s protocols. To obtain expression measures for each of the 7069 noncontrol probe sets on the chip, mismatch hybridization values were subtracted from the perfect match values and the average of the middle 50% of these differences was used as the expression measure. A quantile normalization procedure was performed to adjust for differences in the probe intensity distribution across different chips. These data are available at http://dot.ped.med.umich.edu:2000/pub/Ovary/index.html. Expression data for L-MYC, c-MYC, and N-MYC in the 113 primary OvCas were extracted from the larger data set. Six samples of ovarian surface epithelium (OSE) were also included in the microarray-based gene expression analysis, including two immortalized with SV40 LgTAg (IOSE-144 and IOSE-80, gift of N. Auersperg, University of British Columbia), two immortalized with HPV16 E6/E7 (96.1.24 and 96.9.18, gift of W. Lancaster, Wayne State University) and two short-term OSE cultures (D Schwartz and KR Cho, unpublished).
Results
Combined RLGS and VGS Identifies an Amplified Chromosome 1p34 Sequence in OvCas
RLGS was applied to 47 primary OvCas using the restriction enzyme combination of NotI/EcoRV/HinfI. Most of the very intense spots visible in the two-dimensional gels represent ribosomal DNA sequences, which are present in multiple copies. 41 On visual scanning of the gel images, four restriction fragments with increased image intensity as compared to the corresponding RLGS fragments from normal tissue DNA were identified in tumor E1 (Figure 1A ▶ , left and middle). Using VGS, three of these four fragments (Figure 1A ▶ , right), namely fragment 1 (1059, 476), fragment 2 (1984, 470), and fragment 3 (2952,856) were matched to respective predicted fragments thought to be from chromosome 1. 30 Specifically, the sequences of matched predicted fragments 1, 2, and 3 are present in BAC clones AL606484, AL139015, and AL139158, respectively (NCBI GenBank database). A predicted fragment of similar RLGS size for fragment 4 (320,950) was not found, perhaps because this specific genomic sequence was not present in the databases. Using a combination of bioinformatics tools from the NCBI (eg, Electronic PCR, Map Viewer, UniGene Resources) all three BAC clones were localized to chromosomal band 1p34 (Figure 1B) ▶ . The L-MYC gene resides in the same region of chromosome arm 1p, ∼40 Mb from the telomere, and 1 Mb centromeric to fragment 2. By comparing RLGS images of all 47 primary tumors, tumor S12 was also found to display high-intensity spots corresponding to the same four RLGS fragments observed in tumor E1 (data not shown). Although none of the remaining tumors displayed the same pattern of high-intensity spots by RLGS, a small amplicon containing the specific target of the 1p34 amplification cannot be excluded based on the RLGS analysis.
Figure 1.
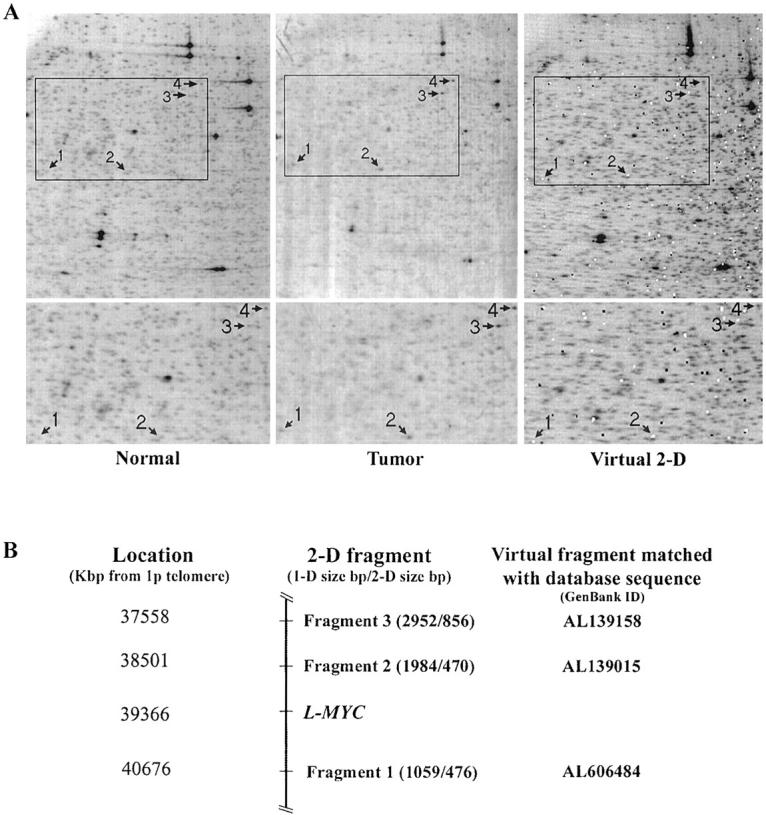
A: Two-dimensional RLGS and VGS analyses. Four NotI/EcoRV/HinfI fragments 1 through 4 with increased image intensity are observed in E1 tumor DNA (middle) compared to normal tissue DNA (left). White and black dots in the VGS image superimposed on the RLGS image (right) represent final and draft sequences, respectively, in the genome sequence databases. B: Schematic map of the three VGS-matched fragments with increased intensity in tumors E1 and S12. L-MYC resides ∼1 Mb centromeric to fragment 2. VGS was unable to match fragment 4 to a database sequence.
The Amplified Region of 1p34 Includes L-MYC, Which Is at the Center of the Amplicon in Tumor E1
L-MYC gene copy number was evaluated by quantitative (Taqman or real-time) PCR in 68 primary OvCas, including 39 of the 47 analyzed by RLGS. The reference gene ATPase was used as an internal control because it is located in a more centromeric position on the same chromosomal arm as the presumptive amplicon. Ten primary tumors showed increased copy numbers of L-MYC (more than twofold) relative to DNA from normal tissue, including E1, the tumor with presumed high-copy number amplification by RLGS.
To further characterize and map the minimal critical region (core-amplified domain) of this amplicon, DNA samples from five OvCas with extra copies of L-MYC based on the quantitative PCR results were further screened using a STS-amplification mapping approach based on competitive multiplex PCR as previously described. 42 The ratios of internal control (ATPase and GAPDH, co-amplified in the same reaction) and tested marker between normal DNA and tumor DNA were compared for each of 10 STS or gene markers spanning more than 4 Mb along chromosome 1p34-1p35 and centered around L-MYC (Figures 2 and 3) ▶ . The markers include one STS marker within BAC clone AL139015 and one within the PPIE gene (stSG48383). Based on STS mapping, tumor E1 possesses the largest amplicon (≈1.4 Mb) and the highest copy number, ≈24-fold increase, of L-MYC among the tumors examined (ie, ≈48 copies relative to the two copies present in DNA from normal tissue). Nine additional tumors showed more modest increases of DNA copy number at the L-MYC locus (twofold to fivefold) using these methods. Hence, 10 of 68 (15%) primary OvCas showed gains in L-MYC copy number without associated genomic amplification of chromosome 1p STS markers flanking L-MYC. L-MYC amplification in a subset of tumors was confirmed by Southern blot analysis (Figure 4) ▶ .
Figure 2.

Semiquantitative multiplex PCR for L-MYC and representative STS markers in primary OvCas. Representative multiplex PCR gel images from five tumors with increased L-MYC copy number compared to DNA from normal tissue (E2N) using chromosome 1 STS markers in and flanking the L-MYC gene. ATPase (chromosome 1) or GAPDH (chromosome 12) co-amplified in each reaction served as internal controls for DNA copy number.
Figure 4.

Southern blot showing amplification of L-MYC in selected primary OvCas. Three tumors with L-MYC amplification (E1T, S12T, and S1T) and three tumors without L-MYC amplification (E2T, C4T, and M3T) based on quantitative PCR were evaluated by Southern analysis. After hybridization to the L-MYC probe, the blot was stripped and rehybridized with a β-actin probe to control for loading. An EcoRI polymorphism in the region of L-MYC detected by the probe accounts for variability in the band pattern for L-MYC observed in tumor DNA from different individuals.
c-MYC, L-MYC, and Less Frequently, N-MYC, Are Overexpressed in Primary OvCas Relative to OSE
The relative expression of c-MYC, L-MYC, and N-MYC transcripts in 113 primary OvCas and 6 OSE samples based on oligonucleotide microarrays is shown in Figure 5 ▶ . This set of tumors was largely independent of the group analyzed by RLGS or q-PCR for increased L-MYC copy number. Notably, when expression levels of each gene were compared between OvCas and OSE, a greater fraction of OvCas showed elevated expression of L-MYC than either c-MYC or N-MYC. Specifically, 46 of 113 (41%) of OvCas showed L-MYC expression values of at least 500 (compared to mean expression of −6 for OSE samples). Two tumors (E8 and E10) with 4.8-fold and 3.3-fold increased L-MYC copy number, respectively, were included in the analysis (marked by asterisk in Figure 5 ▶ ). A few tumors showed strikingly high levels of N-MYC, suggesting the possibility of N-MYC gene defects (eg, amplification) in those samples.
Figure 5.

Comparison of C-MYC, L-MYC, and N-MYC gene expression in primary OvCas and OSE samples using oligonucleotide microarrays. Relative expression of each gene in individual samples is expressed in arbitrary units. Samples are color coded by histological type as indicated. The two tumors with increased L-MYC copy number based on quantitative PCR are indicated by asterisks.
L-MYC Is Overexpressed in OvCas with L-MYC Amplification and in Additional OvCas Lacking the 1p34 Amplicon
To further examine whether increased copy number of L-MYC is associated with elevated L-MYC expression, we performed quantitative (Taqman) RT-PCR to measure levels of L-MYC transcripts in 59 of the 68 primary tumors evaluated for increased L-MYC copy number by q-PCR. Increased expression of L-MYC was defined as more than twofold L-MYC expression relative to HPRT1, primarily because this is approximately the minimum value obtained from tumors with amplifications. Based on this definition, 21 of the 59 (36%) of the OvCas examined showed increased L-MYC expression (Figure 6) ▶ . These data are in keeping with those based on the microarray-based analysis. As expected, nine of nine tumors containing the 1p34 amplicon overexpressed L-MYC. Increased expression of L-MYC was also observed in 12 tumors without the 1p34 amplicon, suggesting that activation of L-MYC can also occur via mechanisms independent of gene amplification.
Figure 6.

Quantitative (Taqman) RT-PCR analysis of L-MYC expression in primary OvCas and OSE samples. After normalization for HPRT1 expression, data from individual tumors and OSE samples were plotted showing relative levels of L-MYC expression. The nine tumors with increased L-MYC copy number included in the q-RT-PCR analysis are indicated.
Discussion
Previous studies have demonstrated frequent alterations of chromosome 1 in OvCas, including genomic gains/amplifications on the short arm and chromosomal translocation at distal 1p. 43-47 However, the amplified region(s) have not been well characterized nor have candidate genes targeted by the amplifications been identified. In the present study we have shown that L-MYC is a gene affected by chromosome 1p amplification in a subset of primary OvCas.
c-MYC, N-MYC, and L-MYC are the three major members of the MYC proto-oncogene family. These genes encode proteins that play distinct, but overlapping roles in a wide range of normal and aberrant cellular processes including cell proliferation, differentiation, apoptosis, and tumorigenesis. 48-51 All three MYC proteins have been shown to bind the CACGTG (E-box) motif, a function that is critical for the transforming activity of myc proteins. 52,53 Either n-myc, c-myc, or l-myc can cooperate with mutant ras to neoplastically transform primary rodent cells. However, in such in vitro assays, the transforming activity of l-myc is only 1 to 10% that of c-myc. 54,55
L-MYC has been much less intensively studied than c-MYC or N-MYC, and no previous studies have reported genetic alterations of L-MYC associated with OvCa. In contrast, c-MYC has been found to be amplified in a significant fraction of OvCas. 22-24 L-MYC was first found to be amplified in human primary small cell lung cancer and lung carcinoma cell lines. 56 Approximately one-fourth of primary small cell lung cancer tumors contain amplified copies of one of the three MYC proto-oncogenes, 57 although amplification of L-MYC is relatively infrequent compared to c-MYC or N-MYC. 58 Co-amplification of the cyclophilin-like gene (PPIE) has been reported in small cell lung cancer cell lines containing L-MYC gene amplification. 59 We found PPIE co-amplified with L-MYC in one tumor (E1) but not in other tumors with more modest L-MYC amplification, suggesting that PPIE is likely to be a passenger associated with L-MYC amplification in tumor E1.
We observed increased L-MYC gene copy number in ∼15% of primary OvCas, and overexpression of L-MYC transcripts even more frequently (∼40%). We note that we have compared L-MYC expression in primary tumors to short-term and immortalized OSE cultures, rather than uncultured or in situ OSE cells. Although immortalization per se does not appear to change L-MYC transcript levels, we cannot exclude the possibility that the process of cell culture itself may affect L-MYC gene expression. Certainly, in situ hybridization or immunohistochemical studies could provide further evidence for low L-MYC expression in normal OSE and high expression in a subset of OvCas.
It is interesting that L-MYC overexpression and/or amplification seem less prevalent in mucinous OvCas compared to the other tumor types, as L-MYC overexpression was observed in only 1 of 10 mucinous carcinomas based on the microarray analysis and none of the tumors with increased L-MYC copy number were mucinous. However, these findings may be in part because of the relatively small number of mucinous tumors studied. In addition to implicating L-MYC gene amplification and/or overexpression in the pathogenesis of human ovarian cancer, our findings confirm that VGS provides a powerful tool to enhance gene discovery using RLGS. Further work with RLGS and VGS approaches will likely implicate additional oncogene and tumor suppressor gene defects in cancer pathogenesis.
Figure 3.

Mapping of the chromosome 1p34-1p35-amplified region in primary OvCas using multiplex PCR. The loci are listed based on distance from the telomere. DNA from tumor E1 contains the largest amplicon, spanning >1.4 Mb of genomic DNA.
Footnotes
Address reprint requests to Kathleen R. Cho, M.D., 4301 MSRBIII, 1150 West Medical Center Dr., Ann Arbor, MI 48109. E-mail: kathcho@umich.edu.
Supported by the Department of Defense (grant DAMD17-1-1-0727), the National Institutes of Health (grant U19 CA84953), and the University of Michigan’s Cancer Center (grant P30 CA46592).
References
- 1.Schwab M: Amplification of oncogenes in human cancer cells. Bioessays 1998, 20:473-479 [DOI] [PubMed] [Google Scholar]
- 2.Heerdt BG, Molinas S, Deitch D, Augenlicht LH: Aggressive subtypes of human colorectal tumors frequently exhibit amplification of the c-MYC gene. Oncogene 1991, 6:125-129 [PubMed] [Google Scholar]
- 3.Jenkins RB, Qian J, Lieber MM, Bostwick DG: Detection of c-MYC oncogene amplification and chromosomal anomalies in metastatic prostatic carcinoma by fluorescence in situ hybridization. Cancer Res 1997, 57:524-531 [PubMed] [Google Scholar]
- 4.Slamon DJ, Godolphin W, Jones LA, Holt JA, Wong SG, Keith DE, Levin WJ, Stuart SG, Udove JA, Ullrich A: Studies of the HER-2/neu proto-oncogene in human breast and ovarian cancer. Science 1989, 244:707-712 [DOI] [PubMed] [Google Scholar]
- 5.Bonilla M, Ramirez M, Lopez-Cueto J, Gariglio P: In vivo amplification and rearrangement of c-MYC oncogene in human breast tumors. J Natl Cancer Inst 1988, 80:665-671 [DOI] [PubMed] [Google Scholar]
- 6.Little CD, Nau MM, Carney DN, Gazdar AF, Minna JD: Amplification and expression of the c-MYC oncogene in human lung cancer cell lines. Nature 1983, 306:194-196 [DOI] [PubMed] [Google Scholar]
- 7.Wong AJ, Ruppert JM, Eggleston J, Hamilton SR, Baylin SB, Vogelstein B: Gene amplification of c-MYC and N-MYC in small cell carcinoma of the lung. Science 1986, 233:461-464 [DOI] [PubMed] [Google Scholar]
- 8.Sharma A, Pratap M, Sawhney VM, Khan IU, Bhambhani S, Mitra AB: Frequent amplification of C-erbB2 (HER-2/Neu) oncogene in cervical carcinoma as detected by non-fluorescence in situ hybridization technique on paraffin sections. Oncology 1999, 56:83-87 [DOI] [PubMed] [Google Scholar]
- 9.Fukushi Y, Sato S, Yokoyama Y, Kudo K, Maruyama H, Saito Y: Detection of numerical aberration in chromosome 17 and c-erbB2 gene amplification in epithelial ovarian cancer using recently established dual color FISH. Eur J Gynaecol Oncol 2001, 22:23-25 [PubMed] [Google Scholar]
- 10.Vos CB, Ter Haar NT, Peterse JL, Cornelisse CJ, van de Vijver MJ: Cyclin D1 gene amplification and overexpression are present in ductal carcinoma in situ of the breast. J Pathol 1999, 187:279-284 [DOI] [PubMed] [Google Scholar]
- 11.Lin L, Prescott MS, Zhu Z, Singh P, Chun SY, Kuick RD, Hanash SM, Orringer MB, Glover TW, Beer DG: Identification and characterization of a 19q12 amplicon in esophageal adenocarcinomas reveals cyclin E as the best candidate gene for this amplicon. Cancer Res 2000, 60:7021-7027 [PubMed] [Google Scholar]
- 12.Brodeur GM, Seeger RC, Schwab M, Varmus HE, Bishop JM: Amplification of N-MYC in untreated human neuroblastomas correlates with advanced disease stage. Science 1984, 224:1121-1124 [DOI] [PubMed] [Google Scholar]
- 13.Seshadri R, Matthews C, Dobrovic A, Horsfall DJ: The significance of oncogene amplification in primary breast cancer. Int J Cancer 1989, 43:270-272 [DOI] [PubMed] [Google Scholar]
- 14.Mizutani T, Onda M, Tokunaga A, Yamanaka N, Sugisaki Y: Relationship of C-erbB-2 protein expression and gene amplification to invasion and metastasis in human gastric cancer. Cancer 1993, 72:2083-2088 [DOI] [PubMed] [Google Scholar]
- 15.Jemal A, Thomas A, Murray T, Thun M: Cancer statistics, 2002. CA Cancer J Clin 2002, 52:23-47 [DOI] [PubMed] [Google Scholar]
- 16.Feeley KM, Wells M: Precursor lesions of ovarian epithelial malignancy. Histopathology 2001, 38:87-95 [DOI] [PubMed] [Google Scholar]
- 17.Aunoble B, Sanches R, Didier E, Bignon YJ: Major oncogenes and tumor suppressor genes involved in epithelial ovarian cancer. Int J Oncol 2000, 16:567-576 [DOI] [PubMed] [Google Scholar]
- 18.Lynch HT, Casey MJ, Lynch J, White TE, Godwin AK: Genetics and ovarian carcinoma. Semin Oncol 1998, 25:265-280 [PubMed] [Google Scholar]
- 19.Leary JA, Edwards BG, Houghton CR, Kefford RF, Friedlander ML: Amplification of HER-2/neu oncogene in human ovarian cancer. Int J Gynecol Cancer 1992, 2:291-294 [DOI] [PubMed] [Google Scholar]
- 20.Ross JS, Yang F, Kallakury BV, Sheehan CE, Ambros RA, Muraca PJ: HER-2/neu oncogene amplification by fluorescence in situ hybridization in epithelial tumors of the ovary. Am J Clin Pathol 1999, 111:311-316 [DOI] [PubMed] [Google Scholar]
- 21.Afify AM, Werness BA, Mark HF: HER-2/neu oncogene amplification in stage I and stage III ovarian papillary serous carcinoma. Exp Mol Pathol 1999, 66:163-169 [DOI] [PubMed] [Google Scholar]
- 22.Baker VV, Borst MP, Dixon D, Hatch KD, Shingleton HM, Miller DE: C-MYC amplification in ovarian cancer. Gynecol Oncol 1990, 38:340-342 [DOI] [PubMed] [Google Scholar]
- 23.Schreiber G, Dubeau L: C-MYC proto-oncogene amplification detected by polymerase chain reaction in archival human ovarian carcinomas. Am J Pathol 1990, 137:653-658 [PMC free article] [PubMed] [Google Scholar]
- 24.Wang ZR, Liu W, Smith ST, Parrish RS, Young SR: c-MYC and chromosome 8 centromere studies of ovarian cancer by interphase FISH. Exp Mol Pathol 1999, 66:140-148 [DOI] [PubMed] [Google Scholar]
- 25.Berns EM, Klijn JG, Henzen-Logmans SC, Rodenburg CJ, van der Burg ME, Foekens JA: Receptors for hormones and growth factors and (onco)-gene amplification in human ovarian cancer. Int J Cancer 1992, 52:218-224 [DOI] [PubMed] [Google Scholar]
- 26.Asakawa J, Kuick R, Neel JV, Kodaira M, Satoh C, Hanash SM: Genetic variation detected by quantitative analysis of end-labeled genomic DNA fragments. Proc Natl Acad Sci USA 1994, 91:9052-9056 [DOI] [PMC free article] [PubMed] [Google Scholar]
- 27.Hatada I, Hayashizaki Y, Hirotsune S, Komatsubara H, Mukai T: A genomic scanning method for higher organisms using restriction sites as landmarks. Proc Natl Acad Sci USA 1991, 88:9523-9527 [DOI] [PMC free article] [PubMed] [Google Scholar]
- 28.Hirotsune S, Hatada I, Komatsubara H, Nagai H, Kuma K, Kobayakawa K, Kawara T, Nakagawara A, Fujii K, Mukai T, Hiyshizaki Y: New approach for detection of amplification in cancer DNA using restriction landmark genomic scanning. Cancer Res 1992, 52:3642-3647 [PubMed] [Google Scholar]
- 29.Wimmer K, Kuick R, Thoraval D, Hanash SM: Two-dimensional separations of the genome and proteome of neuroblastoma cells. Electrophoresis 1996, 17:1741-1751 [DOI] [PubMed] [Google Scholar]
- 30.Wimmer K, Thoraval D, Asakawa J, Kuick R, Kodaira M, Lamb B, Fawcett J, Glover T, Cram S, Hanash S: Two-dimensional separation and cloning of chromosome 1 NotI-EcoRV-derived genomic fragments. Genomics 1996, 38:124-132 [DOI] [PubMed] [Google Scholar]
- 31.Wimmer K, Zhu XX, Lamb BJ, Kuick R, Ambros PF, Kovar H, Thoraval D, Motyka S, Alberts JR, Hanash SM: Co-amplification of a novel gene, NAG, with the N-MYC gene in neuroblastoma. Oncogene 1999, 18:233-238 [DOI] [PubMed] [Google Scholar]
- 32.Kawai J, Suzuki H, Taga C, Hara A, Watanabe S: Correspondence of RLGS-M spot behavior with tissue expression on mouse homologue of DP1/TB2 gene. Biochem Biophys Res Commun 1995, 213:967-974 [DOI] [PubMed] [Google Scholar]
- 33.Akama TO, Okazaki Y, Ito M, Okuizumi H, Konno H, Muramatsu M, Plass C, Held WA, Hayashizaki Y: Restriction landmark genomic scanning (RLGS-M)-based genome-wide scanning of mouse liver tumors for alterations in DNA methylation status. Cancer Res 1997, 57:3294-3299 [PubMed] [Google Scholar]
- 34.Zardo G, Tiirikainen MI, Hong C, Misra A, Feuerstein BG, Volik S, Collins CC, Lamborn KR, Bollen A, Pinkel D, Albertson DG, Costello JF: Integrated genomic and epigenomic analyses pinpoint biallelic gene inactivation in tumors. Nat Genet 2002, 32:453-458 [DOI] [PubMed] [Google Scholar]
- 35.Wimmer K, Zhu XX, Rouillard JM, Ambros PF, Lamb BJ, Kuick R, Eckart M, Weinhausl A, Fonatsch C, Hanash SM: Combined restriction landmark genomic scanning and virtual genome scans identify a novel human homeobox gene, ALX3, that is hypermethylated in neuroblastoma. Genes 2002, 33:285-294 [DOI] [PubMed] [Google Scholar]
- 36.Lindsay S, Bird AP: Use of restriction enzymes to detect potential gene sequences in mammalian DNA. Nature 1987, 327:336-338 [DOI] [PubMed] [Google Scholar]
- 37.Rouillard JM, Erson AE, Kuick R, Asakawa J, Wimmer K, Muleris M, Petty EM, Hanash S: Virtual genome scan: a tool for restriction landmark-based scanning of the human genome. Genome Res 2001, 11:1453-1459 [DOI] [PMC free article] [PubMed] [Google Scholar]
- 38.Yoshikawa H, de la Monte S, Nagai H, Wands JR, Matsubara K, Fujiyama A: Chromosomal assignment of human genomic NotI restriction fragments in a two-dimensional electrophoresis profile. Genomics 1996, 31:28-35 [DOI] [PubMed] [Google Scholar]
- 39.Kuick R, Asakawa J, Neel JV, Satoh C, Hanash SM: High yield of restriction fragment length polymorphisms in two-dimensional separations of human genomic DNA. Genomics 1995, 25:345-353 [DOI] [PubMed] [Google Scholar]
- 40.Schwartz DR, Kardia SL, Shedden KA, Kuick R, Michailidis G, Taylor JM, Misek DE, Wu R, Zhai Y, Darrah DM, Reed H, Ellenson LH, Giordano TJ, Fearon ER, Hanash SM, Cho KR: Gene expression in ovarian cancer reflects both morphology and biological behavior, distinguishing clear cell from other poor-prognosis ovarian carcinomas. Cancer Res 2002, 62:4722-4729 [PubMed] [Google Scholar]
- 41.Kuick R, Asakawa J, Neel JV, Kodaira M, Satoh C, Thoraval D, Gonzalez IL, Hanash SM: Studies of the inheritance of human ribosomal DNA variants detected in two-dimensional separations of genomic restriction fragments. Genetics 1996, 144:307-316 [DOI] [PMC free article] [PubMed] [Google Scholar]
- 42.Lin L, Aggarwal S, Glover TW, Orringer MB, Hanash S, Beer DG: A minimal critical region of the 8p22-23 amplicon in esophageal adenocarcinomas defined using sequence tagged site-amplification mapping and quantitative polymerase chain reaction includes the GATA-4 gene. Cancer Res 2000, 60:1341-1347 [PubMed] [Google Scholar]
- 43.Huang NF, Gupta M, Varghese S, Rao S, Luke S: Detection of numerical chromosomal abnormalities in epithelial ovarian neoplasms by fluorescence in situ hybridization (FISH) and a review of the current literature. Appl Immunohistochem Mol Morphol 2002, 10:187-193 [DOI] [PubMed] [Google Scholar]
- 44.Kalir T, Eisberg A, Dottino P, Cohen C: Interphase fluorescence in situ hybridization studies of ovarian adenocarcinomas using the midisatellite probe. Gynecol Oncol 1999, 72:208-214 [DOI] [PubMed] [Google Scholar]
- 45.Thompson FH, Taetle R, Trent JM, Liu Y, Massey-Brown K, Scott KM, Weinstein RS, Emerson JC, Alberts DS, Nelson MA: Band 1p36 abnormalities and t(1,17) in ovarian carcinoma. Cancer Genet Cytogenet 1997, 96:106-110 [DOI] [PubMed] [Google Scholar]
- 46.Evans MF, McDicken IW, Herrington CS: Numerical abnormalities of chromosomes 1, 11, 17, and X are associated with stromal invasion in serous and mucinous epithelial ovarian tumours. J Pathol 1999, 189:53-59 [DOI] [PubMed] [Google Scholar]
- 47.Ioakim-Liossi A, Gagos S, Athanassiades P, Athanassiadou P, Gogas J, Davaris P, Markopoulos C: Changes of chromosomes 1, 3, 6, and 11 in metastatic effusions arising from breast and ovarian cancer. Cancer Genet Cytogenet 1999, 110:34-40 [DOI] [PubMed] [Google Scholar]
- 48.Grandori C, Cowley SM, James LP, Eisenman RN: The Myc/Max/Mad network and the transcriptional control of cell behavior. Annu Rev Cell Dev Biol 2000, 16:653-699 [DOI] [PubMed] [Google Scholar]
- 49.Ingvarsson S, Sundaresan S, Jin P, Francke U, Asker C, Sumegi J, Klein G, Sejersen T: Chromosome localization and expression pattern of Lmyc and Bmyc in murine embryonal carcinoma cells. Oncogene 1988, 3:679-685 [PubMed] [Google Scholar]
- 50.Schreiber-Agus N, Torres R, Horner J, Lau A, Jamrich M, DePinho RA: Comparative analysis of the expression and oncogenic activities of Xenopus c-, N-, and L-myc homologs. Mol Cell Biol 1993, 13:2456-2468 [DOI] [PMC free article] [PubMed] [Google Scholar]
- 51.Morgenbesser SD, Schreiber-Agus N, Bidder M, Mahon KA, Overbeek PA, Horner J, DePinho RA: Contrasting roles for c-Myc and L-Myc in the regulation of cellular growth and differentiation in vivo. EMBO J 1995, 14:743-756 [DOI] [PMC free article] [PubMed] [Google Scholar]
- 52.Blackwell TK, Kretzner L, Blackwood EM, Eisenman RN, Weintraub H: Sequence-specific DNA binding by the c-Myc protein. Science 1990, 250:1149-1151 [DOI] [PubMed] [Google Scholar]
- 53.Ma A, Moroy T, Collum R, Weintraub H, Alt FW, Blackwell TK: DNA binding by N- and L-Myc proteins. Oncogene 1993, 8:1093-1098 [PubMed] [Google Scholar]
- 54.DePinho RA, Hatton KS, Tesfaye A, Yancopoulos GD, Alt FW: The human MYC gene family: structure and activity of L-MYC and an L-MYC pseudogene. Genes Dev 1987, 1:1311-1326 [DOI] [PubMed] [Google Scholar]
- 55.Birrer MJ, Segal S, DeGreve JS, Kaye F, Sausville EA, Minna JD: L-myc cooperates with ras to transform primary rat embryo fibroblasts. Mol Cell Biol 1988, 8:2668-2673 [DOI] [PMC free article] [PubMed] [Google Scholar]
- 56.Nau MM, Brooks BJ, Battey J, Sausville E, Gazdar AF, Kirsch IR, McBride OW, Bertness V, Hollis GF, Minna JD: L-MYC, a new MYC-related gene amplified and expressed in human small cell lung cancer. Nature 1985, 318:69-73 [DOI] [PubMed] [Google Scholar]
- 57.Makela TP, Saksela K, Alitalo K: Amplification and rearrangement of L-myc in human small-cell lung cancer. Mutat Res 1992, 276:307-315 [DOI] [PubMed] [Google Scholar]
- 58.Nesbit CE, Tersak JM, Prochownik EV: MYC oncogenes and human neoplastic disease. Oncogene 1999, 18:3004-3016 [DOI] [PubMed] [Google Scholar]
- 59.Kim JO, Nau MM, Allikian KA, Makela TP, Alitalo K, Johnson BE, Kelley MJ: Co-amplification of a novel cyclophilin-like gene (PPIE) with L-myc in small cell lung cancer cell lines. Oncogene 1998, 17:1019-1026 [DOI] [PubMed] [Google Scholar]