Abstract
In the tumor cells exposed to hypoxia, hypoxia-inducible factor-1 (HIF-1)-mediated adaptation responses such as angiogenesis and anaerobic metabolism are induced for their survival. We have recently reported that the constitutive expression of HIF-1α renders pancreatic cancer cells resistant to apoptosis induced by hypoxia and glucose deprivation. We then established dominant-negative HIF-1α (dnHIF-1α) transfectants and examined their susceptibility to apoptosis and growth inhibition induced by hypoxia and glucose deprivation in vitro and their tumorigenicity in SCID mice. We further examined the expressions of aldolase A and Glut-1 in vitro and Glut-1 expression and glucose uptake in the tumor tissues and microvessel counts in the tumor tissues. As a result, dnHIF-1α rendered the pancreatic cancer cells sensitive to apoptosis and growth inhibition induced by hypoxia and glucose deprivation. Also it abrogated the enhanced expression of Glut-1 and aldolase A mRNAs under hypoxia and reduced the expression of Glut-1 and the glucose uptake in the tumor tissues and consequently in vivo tumorigenicity. We found no significant difference in the microvessel counts among the tumor tissues. From these results, we suggest that the disruption of the HIF-1 pathway might be effective in the treatment of pancreatic cancers.
Aggressive tumors often have insufficient blood supply, partly because the tumor cells grow faster than endothelial cells, and partly because a newly formed vascular supply is disorganized. 1,2 Under such a microenvironment, tumor cells are exposed to both hypoxia and nutrient deprivation. 3,4 In the tumor cells exposed to hypoxia, hypoxia-inducible factor-1 (HIF-1), which is a transcription factor composed of HIF-1α and HIF-1β subunits, 5-8 is activated to promote the transcription of several genes such as glucose transporters, glycolytic enzymes, and angiogenic factors. Thus HIF-1α plays an important role in the protection of solid tumor cells against hypoxia and nutrient deprivation in vivo by promoting angiogenesis and glycolysis. 9-11 We have recently reported that constitutive expression of HIF-1α rendered pancreatic cancer cells resistant to apoptosis and growth inhibition induced by hypoxia and glucose deprivation in vitro, and enhanced the tumorigenicity of pancreatic cancer cells without affecting angiogenesis. 12 Because tumor cells preferentially metabolize glucose by either aerobic or anaerobic glycolysis rather than by oxidative phosphorylation, 13 these findings led us to hypothesize that disruption of HIF-1-mediated adaptation responses might reduce their tumorigenicity through the suppression of glycolysis.
Although most of recent reports demonstrated that HIF-1α acted as a positive regulator of tumor growth, it is controversial what role the HIF-1-mediated hypoxic response might play in tumor growth. 9,10,14-16 Studies using HIF-1α−/− knockout embryonic stem cells indicate conflictingly that HIF-1α acts as a positive regulator of tumor growth on one hand, most likely through its activation of vascular endothelial growth factor (VEGF), 9,10,15 and acts as a negative regulator on the other hand, possibly through the stabilization of p53 in hypoxic cells. 14,17 Therefore it should be determined how it would affect the disruption of the HIF-1-mediated adaptation responses in the cells harboring mutated p53. Furthermore, it is yet to be determined how the disruption of the HIF-1 pathway inhibits the tumor growth. Most of recent reports demonstrated that the disruption of the HIF-1 pathway suppressed the tumor growth most likely through the suppression of angiogenesis. 14,16,17 In contrast to these reports, a recent report demonstrated that the disruption of the HIF-1 pathway inhibited the tumor formation without any change of angiogenesis. 15 As both angiogenesis and glycolysis are considered to be important adaptation responses of cancer cells against hypoxia, 7 it seems reasonable to hypothesize that the disruption of the HIF-1 pathway may inhibit glycolysis as well as angiogenesis, resulting in the inhibition of tumor growth in vivo. To date, there has been no report demonstrating whether or not the disruption of the HIF-1 pathway affects the glucose metabolism in tumor tissues in vivo.
In this study, we established dominant-negative HIF-1α (dnHIF-1α) transfectants from a pancreatic cancer cell line and examined their growth under hypoxia and low glucose, and their susceptibility to apoptosis and growth inhibition induced by hypoxia and glucose deprivation in vitro. We then examined their tumorigenicity in SCID mice and found that the tumorigenicity of the dnHIF-1α transfectants decreased compared with the vector transfectant. To explore the mechanisms of decreased tumorigenicity of the dnHIF-1α transfectants, we examined the in vitro expression of Glut-1, aldolase A, and VEGF in the transfectants under normoxia and hypoxia as a representative glucose transporter, a glycolytic enzyme, and an angiogenic factor, respectively. Expression of glucose transporters and glycolytic enzymes are essential for glucose metabolism. Glut-1 is the most primitive type of glucose transporter expressed in most types of tissues and cell lines. 18 It is expressed in a dominant form in most of the human fetal pancreatic tissues. 19 Aldolase A is one of the key regulatory glycolytic enzymes; it has been reported to increase in the sera of patients with several cancers including pancreatic cancers. 20 VEGF is a representative angiogenic factor induced by hypoxia. We further examined the glucose uptake in the tumor tissues by a 2-fluorodeoxyglucose (FDG) uptake analysis, the expression of Glut-1 and the microvessel counts in the tumor tissues to explore the roles of HIF-1α in the glucose metabolism and angiogenesis required for the tumor formation in vivo.
Materials and Methods
Cell Line and Culture Conditions
A pancreatic ductal adenocarcinoma cell line (PCI-43 cells) was maintained in Dulbecco’s modified Eagle’s medium/F12 medium supplemented with 10% fetal calf serum. As reported previously, 12 PCI-43 cells have mutated p53. As tumor hypoxia was defined as median pO2 < 10 mmHg (∼1.25%), 21 incubation under hypoxic condition (1% O2) was done in a hypoxic chamber gassed with 95% N2 and 5% CO2 (Wakenyaku Co. Ltd., Tokyo, Japan). Incubation in low-glucose medium was done in a glucose-free Dulbecco’s modified Eagle’s medium (Life Technologies, Inc., Gaithersburg, MD) supplementedwith 10% fetal calf serum (concentration of glucose in this medium at 16 mg/dl).
Growth of the Cells
Growth of the cells was estimated by a colorimetric MTS assay using a tetrazolium compound (3-(4,5-dimethylthiazol-2-yl)-5-(3-carboxymethoxyphenyl)-2-(4-sulfophenyl)-2H-tetrazolium, inner salt; MTS) (Promega, Madison, WI) according to the manufacturer’s instruction. Briefly, 1 × 10⁴ cells were plated in 100 ml of Dulbecco’s modified Eagle’s medium containing 1000 mg/L of glucose supplemented with 10% fetal calf serum or glucose-free Dulbecco’s modified Eagle’s medium supplemented with 10% fetal calf serum in 96-well flat-bottomed microplates and incubated under hypoxic (1% O2) or nonhypoxic conditions. The cultures were incubated for the first 24, 48, 72, and 96 hours and then incubated with MTS for the final 1 to 4 hours. Absorbance at 490 nm was read on an MTP-100 microplate reader (Corona Electric, Tokyo, Japan).
Fluorescence-Activated Cell Sorting Analysis
Fluorescence-activated cell sorting analysis was done according to the previously described method. 12 Briefly, after staining with propidium iodide and fluorescein isothiocyanate-conjugated anti-annexin V with the use of the Annexin-V-FLUOS kit (Japan Roche Diagnostic Co. Ltd., Tokyo, Japan) according to the manufacturer’s instruction, the cells were analyzed with a FACScaliber (Becton Dickinson, Mountain View, CA).
Western Blot Analysis
The samples were electrophoresed under reducing conditions on 7.5% or 12% polyacrylamide gels in Tris-glycine buffer and transferred to 0.45-mm nitrocellulose membranes. The membrane was then blocked for 30 minutes in blocking buffer (5% skim milk in 1% Tween-phosphate-buffered saline) and probed with first antibody for 1 hour. After being washed, the membrane was incubated with a peroxidase-conjugated goat anti-mouse IgG and developed with the use of an ECL detection kit (Amersham, Tokyo, Japan).
Reverse Transcriptase-Polymerase Chain Reaction (RT-PCR)
RT-PCR was done according to the previously described method. 22 Briefly each RNA sample (5 mg) was subjected to cDNA synthesis in 50 μl of reaction mixture containing 75 mmol/L KCl, 50 mmol/L Tris-HCl (pH 8.3), 3 mmol/L MgCl2, 10 mmol/L dithiothreitol, 0.5 mmol/L each dNTP, 2 μmol/L random primer, and 1000 U AMLV reverse transcriptase (Life Technologies, Inc.) by incubation at 37°C for 1 hour. PCR amplification of cDNA wasperformed in 50 μl of reaction mixture containing 50 mmol/L KCl, 10 mmol/L Tris-HCl (pH 9.0), 2.5 mmol/L MgCl2, 0.1% Triton X-100, 200 μmol/L each dNTP, 10 μmol/L each specific primers, and 1 U Taq polymerase (Life Technologies, Inc.). PCR was performed in a DNA thermal cycler (Barnstead/Thermolyne, Dubuque, IA) for 35 cycles (94°C for 1 minute, 60°C for 1 minute, and 72°C for 2 minutes). The PCR product (9 μl) was subjected to electrophoresis on 1% agarose gels and stained with ethidium bromide. PCR primers for amplification of VEGF were as follows: forward, gcagctactgccatccaatc; reverse, caaggcccacagggattt.
Northern Blot Analysis
Northern blot analysis was performed by the method described previously. 23 Total RNA (25 mg) was separated by electrophoresis in 1% denaturing formaldehyde-agarose gels. The RNA was transferred to nylon membrane (Hybond N+, Amersham) by capillary elution overnight and UV cross-linked. After prehybridization of blots for 1 to 2 hours at 42°C in prehybridization buffer (5× sodium chloride/sodium phosphate ethylenediaminetetraacetic acid, 5× Denhardt’s solution, 1% sodium dodecyl sulfate, 50% formamide, and 0.1 mg/ml of denatured salmon sperm DNA), the membrane was hybridized overnight at 42°C with the cDNA probe labeled with 32P by the use of a random primer DNA labeling kit (Takara Biomedicals, Tokyo, Japan) for Glut-1 and aldolase A. The probed membrane was then washed and exposed to Bas-III Imaging Plate and the images were scanned by the use of Bas-2000 Image Scanning System (Fuji Film Co. Ltd., Tokyo, Japan). Probes for Glut-1 and aldolase A were obtained by PCR amplification with the use of PCR primers as follows: Glut-1 forward, atgaaggaagagagtvggca; reverse, tgaagagttcagccacgatg; aldolase A forward, cactgggatcaccttcctgt; reverse, aagacaccacacaccactgt.
Gel Shift Assay
Gel shift assay was performed according to the previously described method. 24 Briefly, nuclear extracts were obtained from nuclei incubated in buffer C (50 mmol/L Hepes, pH 7.8, 420 mmol/L KCl, 0.1 mmol/L ethylenediaminetetraacetic acid, 5 mmol/L MgCl2, 10% glycerol, 1 mmol/L dithiothreitol, 2 mg/ml aprotinin, and 0.5 mmol/L phenylmethyl sulfonyl fluoride) after removing cytoplasmic proteins by incubating the cells in buffer A (10 mmol/L Hepes, pH 7.8, 10 mmol/L KCl, 0.1 mmol/L ethylenediaminetetraacetic acid, 1 mmol/L dithiothreitol, 2 mg/ml aprotinin, 0.5 mmol/L phenylmethyl sulfonyl fluoride, and 0.5% Triton X-100) and the centrifugation. Double-stranded HIF-1-specific oligonucleotide probe containing two tandemly positioned HIF-1-binding sites (5′-gccctacgtgctgtctcacacagcctgtctga-3′ and 5′-gtcagacaggctgtggagacagcacgtaggg-3′) were end-labeled with [32P] dCTP by Klenow fragment. Nuclear extract (3 mg) was incubated with a 300-fmol probe in a total of 30 ml of binding buffer (10 mmol/L Hepes, pH 7.8, 50 mmol/L KCl, 1 mmol/L ethylenediaminetetraacetic acid, 5 mmol/L MgCl2, 10% glycerol, and 2 mg of poly-dI-dC) for 20 minutes at room temperature. For the competition assay, a 50-fold molar excess of unlabeled oligonucleotide probe was added to nuclear extracts for 15 minutes before the addition of a labeled probe.
Establishment of Dominant-Negative HIF-1α Transfectants
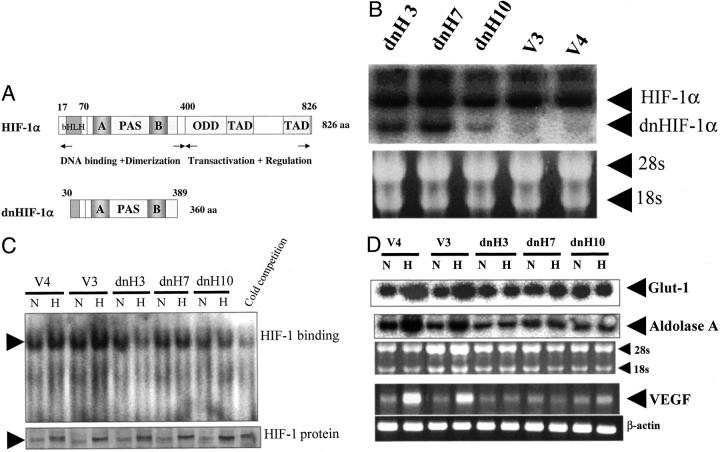
A cDNA for dominant-negative HIF-1α (dnHIF-1α), which lacks a DNA-binding domain, transactivation domains, and an oxygen-dependent degradation domain of HIF-1α (Figure 1A) ▶ , was amplified from RT products of mRNAs purified from the colon cancer cell line KM-12 and then cloned into PCR4-TOPO (Invitrogen, Carlsbad, CA). PCR primers for dominant-negative HIF-1α were selected as previously described 25 (forward, ccgctcgagaccatgcgaaggaaagaatctg; reverse, ggggtacctcatttgtcaaagaggctact). Plasmids were recovered, purified, and sequenced with a DyeDeoxy Terminator kit (Perkin-Elmer, Urayasu, Japan) on an ABI 377 automated sequencer (Applied Biosystems, Urayasu, Japan) under the conditions according to the manufacturer’s protocol. Cloned fragments were recovered from vectors and ligated into PcDNA3.1+ (Invitrogen). PCI-43 cells were transfected with an expression vector with the use of lipofectamine (Life Technologies, Tokyo, Japan). Transfectants were selected with G-418 at 800 mg/ml and cloned by a limiting dilution method. They were maintained in the presence of 400 mg/ml of G-418.
Figure 1.
Expression of dominant-negative HIF-1α and hypoxia-inducible mRNAs. A: Structures of HIF-1α and dominant-negative HIF-1α are shown. A deletion mutant of HIF-1α (amino acids 30 to 389) lacking a DNA-binding domain, transactivation domains, and an oxygen-dependent degradation domain was generated from full-length HIF-1α (amino acids 1 to 826). This deletion mutant was reported to function in a dominant-negative manner through the inhibition of functional HIF-1 formation. B: Dominant-negative HIF-1α mRNA expressions in a vector transfectant and three dominant-negative HIF-1α transfectants are shown. C: Binding of HIF-1 to HIF-1-binding sites examined by gel shift assay and HIF-1α protein expression examined by Western blot are shown. D: Glut-1 and aldolase A mRNA expressions examined by Northern blot and mRNA expression of VEGF amplified by RT-PCR in the transfectants under hypoxic (H) and nonhypoxic (N) conditions are shown. Representative results of three different experiments are shown.
In Vivo Tumorigenicity
Cells (5 × 10⁶) were inoculated subcutaneously into the right flanks of SCID mice. Tumor formation was observed every 3 days and the mice were sacrificed 3 weeks after inoculation. Tumor volumes were measured by the formula as follows: tumor volume = 0.5 × ab2 (a, major axis; b, minor axis).
Determination of FDG Uptake
FDG uptake was determined according to the previously described method. 26 Briefly, 1 week after the inoculation of the transfectants, the mice were deprived of food overnight. Then they were anesthetized with pentobarbital (50 mg/kg), and 5 to 6 MBq of FDG synthesized as previously described was injected into the tail vein. 27 Sixty minutes after the FDG injection, the animals were sacrificed and the tumors, liver, and leg muscles were excised. The tissues were weighed and radioactivity was determined with a gamma counter. After decay correction, the percentage of injected FDG per gram of tissue was obtained and adjusted to the animal’s weight (% ID/g tissue/kg body weight). Blood samples for glucose measurement were obtained twice, immediately before the FDG injection and immediately before sacrifice. The plasma glucose level was determined twice, at the time of FDG injection and sacrifice.
Immunohistochemical Staining
CD31, p53, and Glut-1 were analyzed by immunohistochemical staining using the streptavidin-biotin technique (Histofine SAB-PO kit; Nichirei, Tokyo, Japan) according to the previously described method. 26 Snap-frozen tissue specimens were used for the analysis of CD31 and paraffin-embedded tissue specimens were used for the analysis of p53 and Glut-1. The tissue sections were preincubated for 30 minutes with phosphate-buffered saline (PBS) containing 1% bovine serum albumin and endogenous peroxidase was inactivated with 3% H2O2 in methanol for 15 minutes. The sections were then incubated overnight at 4°C with anti-mouse CD31 antibody (BD Pharmingen, San Diego, CA), anti-human p53 antibody (DO-7; Lab Vision Corp., Fremont, CA) and anti-Glut-1 antibody (Chemicon Intl. Inc., Temecula, CA) at concentrations of 5 μg/ml in PBS. After washing with PBS, the sections were incubated for 1 hour at room temperature with the biotin-conjugated anti-rat second antibody (DAKO, Tokyo, Japan), which was followed by the avidin-biotin-peroxidase reaction. Diaminobenzidine was used as a chromogen to visualize the reaction products. Finally, the sections for CD31, p53, and Glut-1 were counterstained with hematoxylin and methylgreen, respectively.
Results
HIF-1α Protein Expression, HIF-1 Activity, and Expression of Hypoxia-Inducible Genes under Hypoxia in the Transfectants
Figure 1A ▶ shows the structures of HIF-1α and dominant-negative HIF-1α (dnHIF-1α) cDNAs. A deletion mutant of HIF-1α (amino acids 30 to 389) lacking a DNA-binding domain, transactivation domains, and an oxygen-dependent degradation domain was reported to act in a dominant-negative manner through the inhibition of functional HIF-1 formation. 25 Figure 1B ▶ shows the expression of dnHIF-1α mRNA. DnHIF-1α mRNA was expressed in the dnHIF-1α transfectants but not in the vector transfectants. Figure 1C ▶ shows the expressions of HIF-1α protein in the transfectants and the binding of HIF-1 to HIF-1-binding sites under normoxia and hypoxia. All of the transfectants expressed low levels of HIF-1α protein under normoxia as reported previously 12 and expressed high levels of HIF-1α protein under hypoxia. These results indicated that the transfection of dnHIF-1α did not alter the expression of HIF-1α protein. In the vector transfectants, the binding activity of HIF-1 to HIF-1-binding sites was enhanced under hypoxia; however, the binding activity of HIF-1 in the dnHIF-1 transfectants was not enhanced under hypoxia. The binding activity of HIF-1 in the dnH3 cells was rather suppressed under hypoxia. These results suggested that the introduced dnHIF-1 could function in a dominant-negative manner. Figure 1D ▶ shows the expression of Glut-1, aldolase A, and VEGF mRNAs under normoxia and hypoxia. Those expressions were enhanced by the exposure to hypoxia in the vector transfectants but not in the dnHIF-1α transfectants, confirming that the introduced dnHIF-1α did function in a dominant-negative manner. These results suggested that the introduction of dnHIF-1α could reduce glucose uptake and glycolysis in pancreatic cancer cells as well as angiogenesis.
Growth of the Transfectants under Hypoxia and Low-Glucose Level
Because the disruption of the HIF-1 pathway reduced the expression of glucose metabolism-associated genes, Glut-1 and aldolase A, under hypoxia, we hypothesized that the disruption of the HIF-1 pathway might inhibit the growth of the pancreatic cancer cells under hypoxia and low-glucose level. As shown in Figure 2, A and B ▶ , growth of the dnHIF-1α transfectants was suppressed by hypoxia and glucose deprivation. Growth of dnH3 was relatively slow in normoxia and normal media compared with the other dnHIF-1α transfectants, although it was never suppressed. In contrast, the vector transfectants proliferated both in hypoxia and low-glucose medium and in normoxia and normal medium. These results suggested that the transfection of dnHIF-1α rendered the cells susceptible to growth inhibition induced by hypoxia and glucose deprivation.
Figure 2.
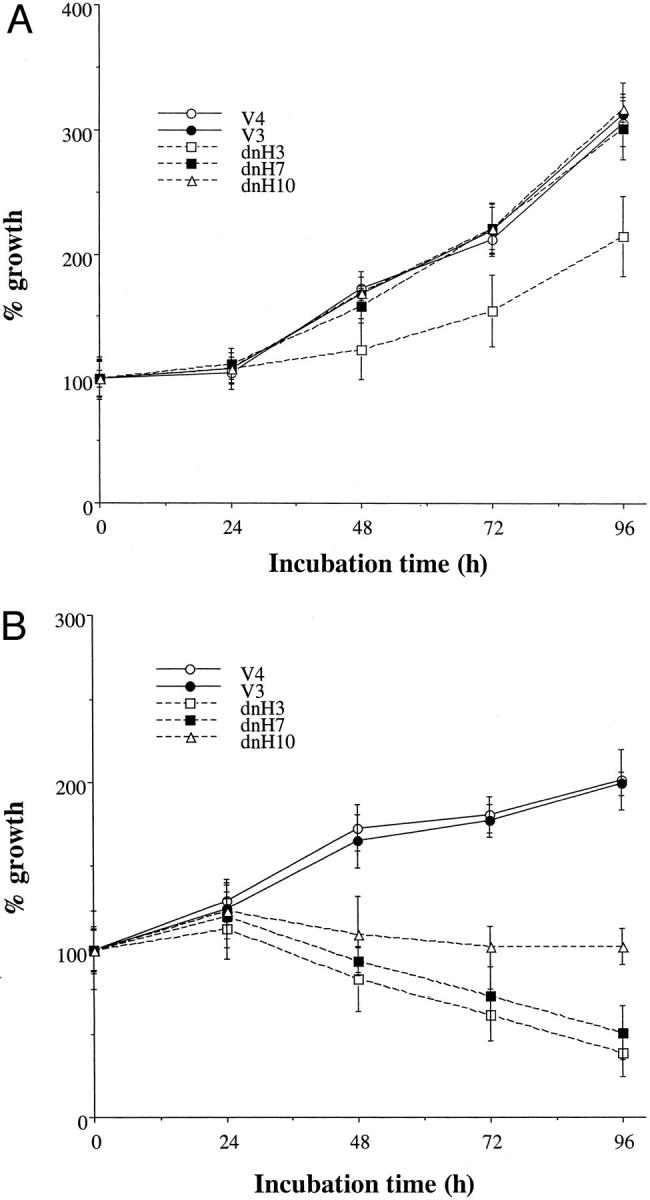
Proliferation of the transfectants in hypoxia and low glucose. A: After incubation in normoxia and normal glucose medium for indicated times, viable cell numbers were estimated by a colorimetric MTS assay. The data are presented as mean ± SD of three different experiments. B: After incubation in hypoxia and low glucose for indicated times, viable cell numbers were estimated by a colorimetric MTS assay. The data are presented as mean ± SD of three different experiments.
Susceptibility of the Transfectants to Apoptosis Induced by Hypoxia and Glucose Deprivation
Next we examined the susceptibility to apoptosis induced by hypoxia and glucose deprivation. Hypoxia alone did not induce apoptosis in the pancreatic cancer cells with the constitutive expression of HIF-1α protein. Even glucose deprivation in combination with hypoxia induced apoptosis in less than 10% of the vector transfectants, as we previously reported that most of pancreatic cancer cell lines were resistant to apoptosis induced by hypoxia and glucose deprivation. 12 However, glucose deprivation in combination with hypoxia induced twofold to threefold higher levels of apoptosis in the dnHIF-1α transfectants (Figure 3, A and B) ▶ . These results suggested that the transfection of dnHIF-1α rendered the cells susceptible to apoptosis induced by hypoxia and glucose deprivation.
Figure 3.
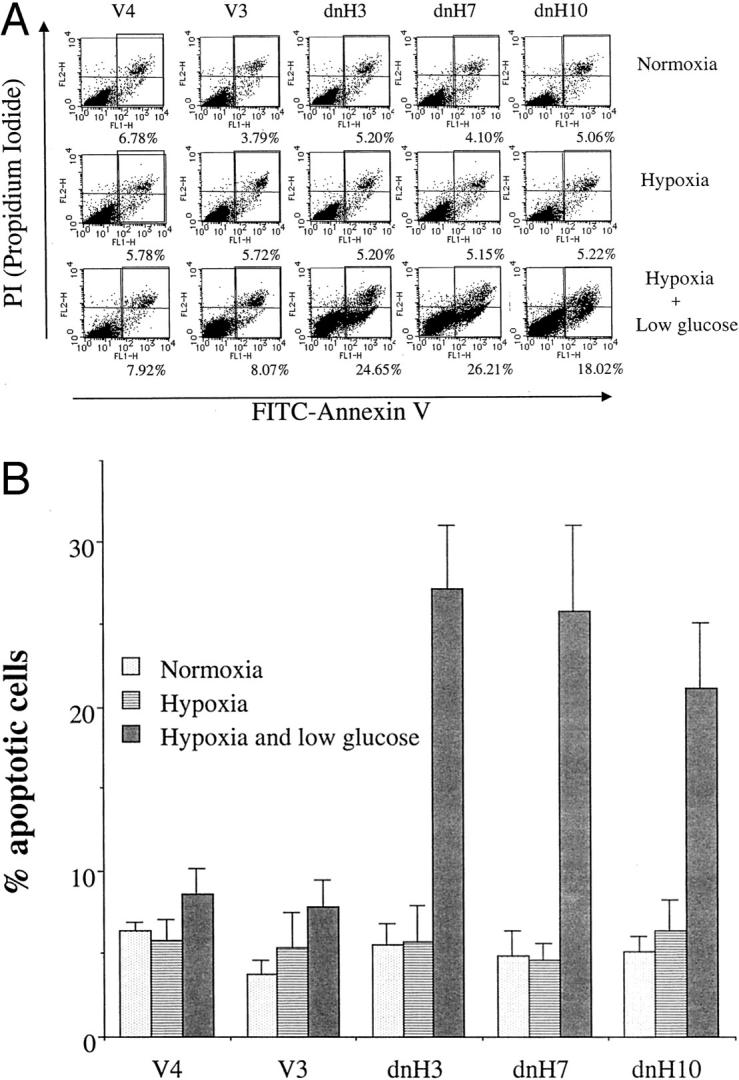
Apoptosis induced by hypoxia and low glucose in the transfectants. A: After incubation under normoxia, hypoxia, and hypoxia plus low glucose for 48 hours, apoptotic cell death was analyzed by the use of a FACScaliber. A representative result of three different experiments is shown. B: Mean ± SD of three different experiments is shown.
In Vivo Tumorigenicity of the Transfectants
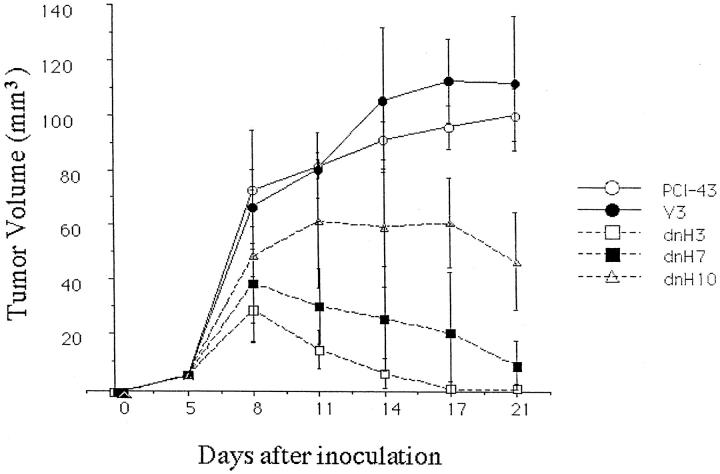
Because our in vitro experiments suggested that the disruption of the HIF-1 pathway abrogated the adaptation responses against hypoxia and glucose deprivation in the pancreatic cancer cells, we next examined the tumorigenicity of the transfectants. As shown in Figure 4 ▶ , the parental PCI-43 cells and the vector transfectant formed tumors in SCID mice, whereas the two dnHIF-1 transfectants PCI-43/dnH3 and PCI-43/dnH7 did not. Tumor formation was observed in PCI-43/dnH10, which was suppressed compared with that in the vector transfectant. The inability of in vivo tumor formation seemed to be closely correlated with the expression levels of dnHIF-1α mRNA in the dnHIF-1α transfectants. These results indicated that the introduction of dnHIF-1α did reduce the tumorigenicity of the pancreatic cancer cells.
Figure 4.
Growth of the tumors in SCID mice. Five mice in each group were inoculated with 5 × 10⁶ cells on day 0. Tumor size was measured every 3 days after inoculation.
Immunohistochemical Analysis of Tumor Tissues in SCID Mice
To explore the mechanisms by which dnHIF-1α inhibited the in vivo tumor growth, we first examined the microvessel density and the expression of Glut-1 in the tumor tissues. Immunohistochemical staining for an endothelial cell marker (CD31/PECAM) revealed similar numbers of CD31-positive cells in the tumor tissues of the dnHIF-1α transfectants and the vector transfectants (Figure 5A) ▶ . As shown in Figure 5B ▶ , there was no significant difference of capillary density estimated according to the previously described method 22 between the tumor tissues of the dnHIF-1α transfectant and the vector transfectant. Immunohistochemical staining for Glut-1 demonstrated that the tumor cells and the host-derived interstitial cells were positive for Glut-1 in the tumor tissues of the vector transfectant, and that only the host-derived interstitial cells were positive for Glut-1 in the tumor tissues of the dnHIF-1α transfectant (Figure 6) ▶ . These results indicated that the introduction of dnHIF-1α resulted in the inhibition of Glut-1 expression without affecting angiogenesis in the tumor cells in vivo.
Figure 5.
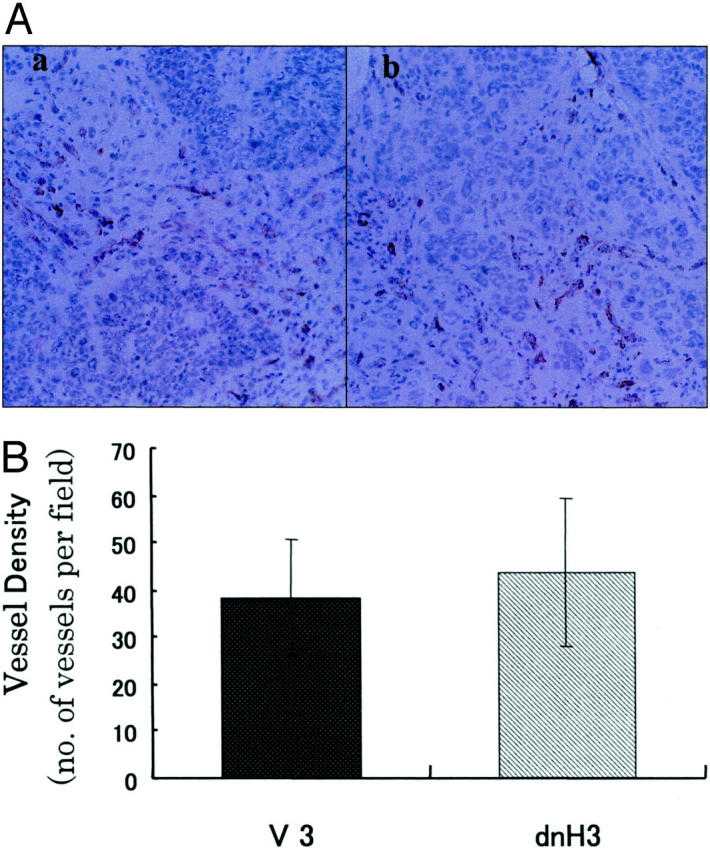
Immunohistochemical staining of the tumor tissues for CD31/PECAM. A: A representative result of immunohistochemical staining of the tumor tissues of V3 and dnH3 for endothelial cell marker (CD31/PECAM). a: V3; b: dnH3. B: Mean ± SD of microvessel counts in three different tumor tissues in each group is shown. Original magnifications, ×200.
Figure 6.
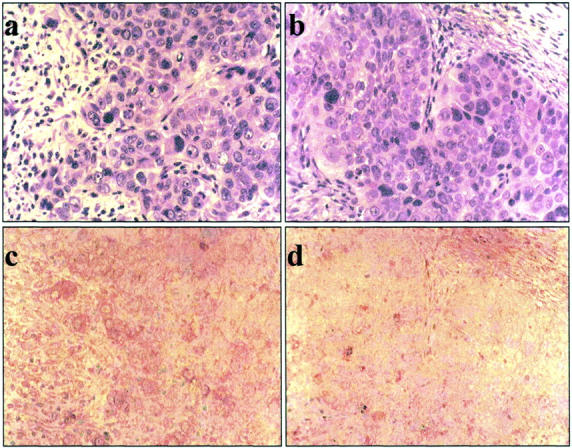
Immunohistochemical staining for Glut-1 in the tumor tissues. A representative result of immunohistochemical staining of the tumor tissues of V3 and dnH3 for Glut-1. a: H&E staining of the tumor of V3; b: HE staining of the tumor of dnH3; c: immunohistochemical staining of the tumor of V3; d: immunohistochemical staining of the tumor of dnH3. Original magnifications, ×200.
Glucose Uptake in the Tumor Tissues
Next we examined the glucose uptake in the tumor tissues by the FDG uptake analysis to explore whether the disruption of the HIF-1 pathway would suppress glucose uptake in the tumor tissues in vivo. As shown in Figure 7A ▶ , mean blood glucose levels, which have been reported to affect the glucose uptake, 28,29 were not significantly different among the mice at the time of FDG injection and sacrifice. The glucose uptake in the tumor tissues of the dnHIF-1α transfectants was lower than that in the tumor tissues of the vector transfectant (Figure 7B) ▶ . There was no significant difference of glucose uptake in the liver, muscle, or blood among the mice (Figure 7B) ▶ . When we examined the expression of Glut-1 in the tumor tissues, we noticed that there were fewer tumor cells in the tumor tissues of the dnHIF-1α transfectants compared with those of the vector transfectant. Therefore, we examined the ratio of tumor cells in the tumor tissues by staining with anti-human p53 antibody. As shown in Figure 7C ▶ , there were fewer tumor cells (strongly stained p53-positive cells) in the tumor tissues of the dnHIF-1α transfectants than in those of the vector transfectant. In combination with the evidence that the host-derived interstitial cells were positive for Glut-1 in the tumor tissues, this finding suggested that the FDG uptake in the tumor tissues of the dnHIF-1α transfectants might be mainly through its uptake into the host-derived interstitial cells.
Figure 7.
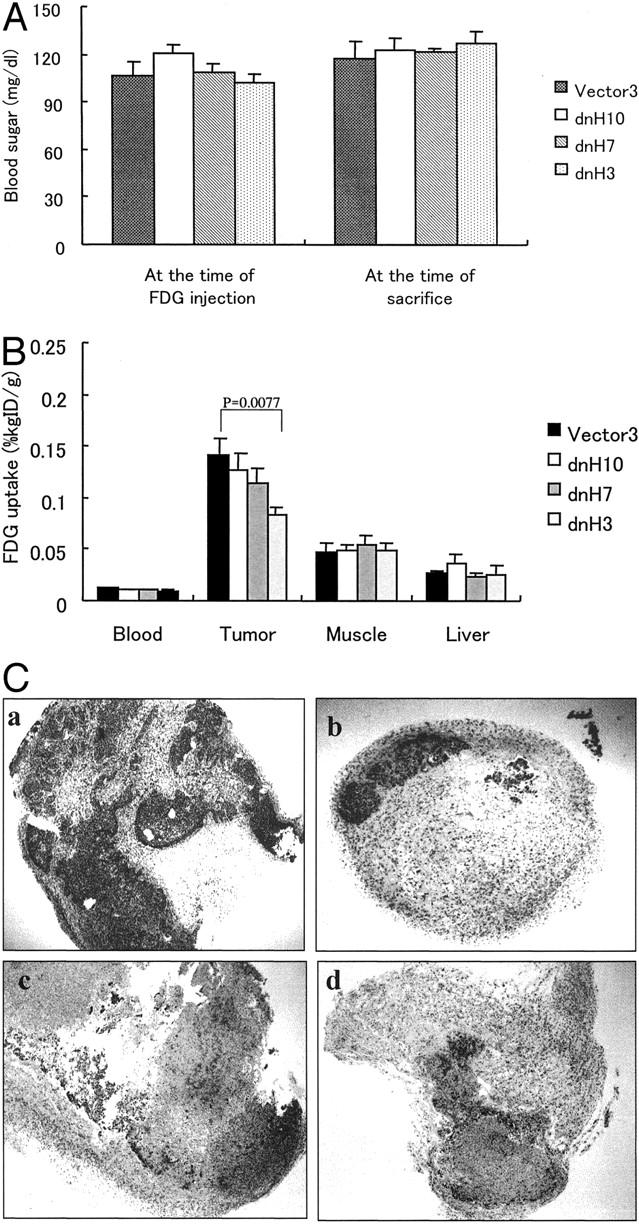
FDG uptake in the tumor tissues. A: Blood glucose levels in the mice. No significant difference was observed among the mice. B: FDG uptake in blood, tumor tissue, liver, and muscle is shown. Mean ± SD of FDG uptake in five mice is shown. C: Immunohistochemical staining of tumor tissues with anti-human p53 antibody is shown. As the antibody is specific to human p53 protein, p53-positive cells are judged as human pancreatic tumor cells. Strong staining indicated p53-positive cells in the tumor tissues. a: V3; b: dnH3; c: dnH7; d: dnH10. Original magnification, ×40.
Discussion
Here we demonstrated that the introduction of dnHIF-1α rendered the pancreatic cancer cells sensitive to apoptosis induced by hypoxia and glucose deprivation and reduced the in vivo tumorigenicity of the pancreatic cancer cells. These findings confirmed the previous reports that the HIF-1 pathway was essential for the growth of tumor cells in vivo 15,16 and suggested that dnHIF-1α would be a useful tool for the treatment of pancreatic cancers. HIF-1 is a transcription factor composed of HIF-1α and HIF-1β subunits 9-11 that is stabilized and activated to promote the transcription of several genes through the binding to hypoxia-responsive elements located in the promoter region, when the cells are exposed to hypoxia. A deletion mutant of HIF-1α (amino acids 30 to 389) that lacks a DNA-binding domain, transactivation domains, and an oxygen-dependent degradation domain, functions in a dominant-negative manner through the inhibition of functional HIF-1 formation, 25 as the recently reported inhibitory PAS domain (IPAS) functions likewise, which also lacks a transactivation domain of HIF-1α. 30
HIF-1α induces adaptation responses to hypoxia including anaerobic metabolism and angiogenesis through the transcription of several angiogenic factors and anaerobic metabolism-associated genes, such as VEGF, aldolase A, and Glut-1. 9-11 Our present results demonstrated that the disruption of the HIF-1 pathway reduced the expression of genes involved in both anaerobic metabolism and angiogenesis in vitro, and that it also reduced glucose uptake necessary for anaerobic metabolism but not angiogenesis in vivo. Most of the previous studies examining the role of HIF-1α in tumor formation demonstrated that the disruption of the HIF-1α pathway reduced angiogenesis and then tumor growth. 9,10,14,16 Only one recent report demonstrated that the disruption of the HIF-1 pathway reduced the expression of VEGF and tumor growth but not in vivo angiogenesis. 15 We now speculate that host-derived cells in the tumor tissues may produce an enough amount of angiogenic factors, especially VEGF, in accordance with the previous report. 31 The recent report that the deletion of VEGF gene in tumor cells did not completely block tumor VEGF production or angiogenesis may also support the contribution of host-derived VEGF in angiogenesis. 32 To verify our speculation, we are now examining the expression of murine and human VEGF proteins in the tumor tissues. Alternatively, pancreatic cancer cells may produce other angiogenic factors under hypoxic conditions in a HIF-1-independent manner that compensate for the decreased production of VEGF. We are now examining some candidate angiogenic factors found in our DNA microarray study in which mRNA expressions in a pancreatic cancer cell line under hypoxic and nonhypoxic conditions were compared (manuscript in preparation). In the previous study demonstrating that the disruption of the HIF-1 pathway inhibited angiogenesis, 14 there was no difference in the numbers of small blood vessels, suggesting that small and large blood vessels are regulated by different angiogenic factors. In our study, the blood vessels we observed in the tumor tissues were mainly small blood vessels, possibly because the tumors we excised 7 days after inoculation was small. This may explain why the angiogenesis was not inhibited in the tumor tissues of the dnHIF-1α transfectants. In any case, our findings demonstrated that the disruption of HIF-1 pathway would not suppress the angiogenesis at least in some pancreatic cancers. Even though the angiogenesis is not suppressed, the disruption of the HIF-1 pathway could be effective in the treatment of pancreatic cancers as it suppresses glucose uptake necessary for anaerobic metabolism.
The most striking feature of cancer cells is the production of large amounts of lactic acid, which is because of the glycolytic conversion of glucose to lactic acid even in the presence of oxygen (a phenomenon known as the Warburg effect); 13 namely cancer cells rely on glycolysis for energy unlike normal mammalian cells which use oxygen to generate energy. Increased glycolysis is usually accompanied by an increased glucose uptake. From these, we propose that the abrogation of increased glucose uptake and glycolysis by dominant-negative HIF-1α reduces the generation of energy in the pancreatic cancer cells under hypoxia and low glucose and then might render them sensitive to apoptosis induced by hypoxia and low glucose. Studies by magnetic-resonance spectroscopy and positron-emission tomography have consistently demonstrated that various clinical tumors show far more glucose uptake in vivo than do normal tissues. 33-35 Another report also shows increased glucose uptake in pancreatic cancers. 36 Because Glut-1, which plays important roles in glucose uptake, is regulated by HIF-1 under hypoxic conditions, 37 it seems likely that the disruption of the HIF-1 pathway inhibits glucose uptake in vivo. We for the first time demonstrated that the disruption of the HIF-1 pathway inhibited glucose uptake into the tumor tissues in vivo. The present findings, in combination with the recent report demonstrating the important roles of HIF-1 in the ATP production and the cell growth, 38 clearly demonstrated the important roles of glucose uptake and glycolysis in the growth and apoptosis of cancer cells.
Recent reports demonstrated that glucose metabolism is essential for the survival and growth of tumor cells stimulated by growth factors and that glycolysis is required for the preservation of mitochondrial integrity. 39-41 These reports in combination with the present results suggest that the pancreatic cancer cells exposed to hypoxia may protect themselves from apoptosis through the enhanced glucose uptake, enhanced anaerobic metabolism, and consequently the stabilization of mitochondrial transmembrane potential. To verify this hypothesis, we are now examining the sensitivity of the transfectants to the apoptosis induced by various stimuli other than hypoxia and low glucose.
Acknowledgments
We thank Dr. Hiroshi Ishikura (The First Department of Pathology, Hokkaido University School of Medicine) for providing us with a pancreatic cancer cell line and Ms. M. Yanome for assistance in preparing the manuscript.
Footnotes
Address reprint requests to Masanobu Kobayashi, M.D., Division of Cancer Pathobiology, Institute for Genetic Medicine, Hokkaido University, Kita-15, Nishi-7, Kita-Ku, Sapporo, 060-0815 Japan. E-mail: mkobaya@med.hokudai.ac.jp.
Supported in part by grants from the Japanese Ministry of Education, Culture, Sports, Science, and Technology.
References
- 1.Vaupel P, Kallinowski F, Okunieff P: Blood flow, oxygen and nutrient supply, and metabolic microenvironment of human tumors: a review. Cancer Res 1989, 49:6449-6465 [PubMed] [Google Scholar]
- 2.Richard DE, Berra E, Pouyssegur J: Angiogenesis: how a tumor adapts to hypoxia. Biochem Biophys Res Comm 1999, 266:718-722 [DOI] [PubMed] [Google Scholar]
- 3.Wang GL, Jiang BH, Rue EA, Semenza GL: Hypoxia-inducible factor 1 is a basic-helix-loop-helix-PAS heterodimer regulated by cellular O2 tension. Proc Natl Acad Sci USA 1995, 92:5510-5514 [DOI] [PMC free article] [PubMed] [Google Scholar]
- 4.Guillemin K, Krasnow MA: The hypoxic response: huffing and HIFing. Cell 1997, 89:9-12 [DOI] [PubMed] [Google Scholar]
- 5.Salceda S, Caro J: Hypoxia-inducible factor 1a (HIF-1 a) protein is rapidly degraded by the ubiquitin/proteasome system under normoxic conditions. J Biol Chem 1997, 272:22642-22647 [DOI] [PubMed] [Google Scholar]
- 6.Blancher C, Harris AL: The molecular basis of hypoxia response pathway: tumor hypoxia as a therapy target. Cancer Metastasis Rev 1998, 17:187-194 [DOI] [PubMed] [Google Scholar]
- 7.Dang CV, Semenza GL: Oncogenic alterations of metabolism. Trends Biochem Sci 1999, 24:68-72 [DOI] [PubMed] [Google Scholar]
- 8.Semenza GL: Expression of hypoxia-inducible factor 1: mechanisms and consequences. Biochem Pharmacol 2000, 59:47-53 [DOI] [PubMed] [Google Scholar]
- 9.Ryan HE, Lo J, Johnson RS: HIF-1 alpha is required for solid tumor formation and embryonic vascularization. EMBO J 1998, 17:3005-3015 [DOI] [PMC free article] [PubMed] [Google Scholar]
- 10.Maxwell PH, Dachs GU, Gleadle JM, Nicholls LG, Harris AL, Stratford IJ, Hankinson O, Pugh CW, Ratcliffe PJ: Hypoxia-inducible factor-1 modulates gene expression in solid tumors and influences both angiogenesis and tumor growth. Proc Natl Acad Sci USA 1997, 94:8104-8109 [DOI] [PMC free article] [PubMed] [Google Scholar]
- 11.Hockel M, Vaupel P: Biological consequences of tumor hypoxia. Semin Oncol 2001, 28:36-41 [PubMed] [Google Scholar]
- 12.Akakura N, Kobayashi M, Horiuchi I, Suzuki A, Wang J, Chen J, Niizeki H, Kawamura K, Hosokawa M, Asaka M: Constitutive expression of hypoxia-inducible factor-1a (HIF-1a) renders pancreatic cancer cells resistant to apoptosis induced by hypoxia and nutrient deprivation. Cancer Res 2001, 61:6548-6554 [PubMed] [Google Scholar]
- 13.Warburg OH: On respiratory impairment in cancer cells. Science 1956, 124:269-270 [PubMed] [Google Scholar]
- 14.Carmeliet P, Dor Y, Herbert JM, Fukumura D, Brusselmans K, Dewerchin M, Neeman M, Bono F, Abramovitch R, Maxell P, Koch CJ, Ratcliffe P, Moons F, Jain RK, Collen D, Keshet E: Role of HIF-1a in hypoxia-mediated apoptosis, cell proliferation and tumor angiogenesis. Nature 1998, 394:485-490 [DOI] [PubMed] [Google Scholar]
- 15.Ryan HE, Poloni M, McNulty W, Elson D, Gassmann M, Arbeit JM, Johnson RS: Hypoxia-inducible factor-1 alpha is a positive factor in solid tumor growth. Cancer Res 2000, 60:4010-4015 [PubMed] [Google Scholar]
- 16.Kung AL, Wang S, Klco JM, Kaelin WG, Jr, Livingston DM: Suppression of tumor growth through disruption of hypoxia-inducible transcription. Nat Med 2000, 6:1335-1340 [DOI] [PubMed] [Google Scholar]
- 17.An WG, Mookerjee ZM, Sutter CH, Artemov D, Zeng Q, Dillehay LE, Madan A, Semenza GL, Bedi A: Stabilization of wild-type p53 by hypoxia-inducible factor 1a. Nature 1998, 392:405-4089537326 [Google Scholar]
- 18.Merral NW, Plevin R, Gould GW: Growth factors, mitogens, oncogenes and the regulation of glucose transport. Cell Signal 1993, 5:667-675 [DOI] [PubMed] [Google Scholar]
- 19.Mally MI, Otonkoski T, Lopez AD, Hayek A: Developmental gene expression in the human fetal pancreas. Pediatr Res 1994, 36:537-544 [DOI] [PubMed] [Google Scholar]
- 20.Asaka M, Nagase K, Miyazaki T, Alpert E: Radioimmunoassay of aldolase A. Determination of normal serum levels and increased serum concentration in cancer patients. Cancer 1983, 51:1873-1878 [DOI] [PubMed] [Google Scholar]
- 21.Kobayashi M, Nagayasu H, Hamada J, Takeichi N, Hosokawa M: ONO-4007, a new synthetic lipid A derivative, induces differentiation of rat myelomonocytic leukemia cells in vitro and in vivo. Exp Hematol 1994, 22:454-459 [PubMed] [Google Scholar]
- 22.Hockel M, Vaupel P: Tumor hypoxia: definitions and current clinical biologic, and molecular aspects. J Natl Cancer Inst 2001, 93:266-276 [DOI] [PubMed] [Google Scholar]
- 23.Choi S, Kobayashi M, Wang J, Habellhah H, Okada F, Hamada J, Moriuchi T, Totsuka Y, Hosokawa M: Activated leukocyte cell adhesion molecule (ALCAM) and annexin II are involved in the metastatic progression of tumor cells after chemotherapy with adriamycin. Clin Exp Metastasis 2000, 18:45-50 [DOI] [PubMed] [Google Scholar]
- 24.Wang J, Kobayashi M, Han M, Choi S, Takano M, Hashino S, Tanaka J, Kondoh T, Kawamura K, Hosokawa M: MyD88 is involved in the signalling pathway for Taxol-induced apoptosis and TNF-alpha expression in human myelomonocytic cells. Br J Haematol 2002, 118:638-645 [DOI] [PubMed] [Google Scholar]
- 25.Halterman MW, Miller CC, Federoff HJ: Hypoxia-inducible factor-1alpha mediates hypoxia-induced delayed neuronal death that involves p53. J Neurosci 1999, 19:6818-6824 [DOI] [PMC free article] [PubMed] [Google Scholar]
- 26.Zhao S, Kuge Y, Tsukamoto E, Mochizuki T, Kato T, Hisokawa K, Hosokawa M, Kohanawa M, Tamaki N: Effects of insulin and glucose loading on FDG uptake in experimental malignant and inflammatory lesions. Eur J Nucl Med 2001, 28:730-735 [DOI] [PubMed] [Google Scholar]
- 27.Vincent KA, Shyu KG, Luo Y, Magner M, Tio RA, Jiang C, Goldberg MA, Akita GY, Gregory RJ, Isner JM: Angiogenesis is induced in a rabbit model of hindlimb ischemia by naked DNA encoding an HIF-1alpha/VP16 hybrid transcription factor. Circulation 2000, 102:2255-2261 [DOI] [PubMed] [Google Scholar]
- 28.Tooronjian SA, Mulhorando GK, Jewett DM, Bachlor MA, Kilbourn MR: Routine production of 2-deoxy-2-[18F] fluoro-D-glucose by direct nucleophilic exchange on a quaternary 4-aminopyridinium resin. Nucl Med Biol 1990, 17:273-279 [DOI] [PubMed] [Google Scholar]
- 29.Delbeke D, Rose DM, Chapman WC, Pinson CW, Wright JK, Beauchamp RD, Shyr Y, Leach SD: Optimal interpretation of FDG PET in the diagnosis, staging and management of pancreatic carcinoma. J Nucl Med 1999, 40:1784-1791 [PubMed] [Google Scholar]
- 30.Makino Y, Cao R, Svensson K, Bertillson G, Asman M, Tanaka H, Cao Y, BerkenstamA, Poellinger L: Inhibitory PAS domain is a negative regulator of hypoxia-induced gene expression. Nature 2001, 414:550-554 [DOI] [PubMed] [Google Scholar]
- 31.Fukumura D, Xavier R, Sugiura T, Chen Y, Park E, Lu N, Selig M, Nielsen G, Taksir T, Jain RK, Seed B: Tumor induction of VEGF promoter in stromal cells. Cell 1998, 94:715-725 [DOI] [PubMed] [Google Scholar]
- 32.Tsuzuki Y, Fukumura D, Oosthuyse B, Koike C, Carmeliet P, Jain RK: Vascular endothelial growth factor (VEGF) modulation by targeting hypoxia-inducible factor-1a→hypoxia response element→VEGF cascade differentially regulates vascular response and growth rate in tumors. Cancer Res 2000, 60:6248-6252 [PubMed] [Google Scholar]
- 33.Nolop KB, Rhodes CG, Brudin LH, Beaney RP, Krausz T, Jones T, Hughes JM: Glucose utilization in vivo by human pulmonary neoplasms. Cancer 1998, 60:2682-2689 [DOI] [PubMed] [Google Scholar]
- 34.Gatenby RA: The potential role of transformation-induced metabolic changes in tumor-host interaction. Cancer Res 1995, 55:4151-4156 [PubMed] [Google Scholar]
- 35.Ak I, Stokkel MP, Pauwels EK: Positron emission tomography with 2-[18F]fluoro-2-deoxy-D-glucose in oncology. Part II. The clinical value in detecting and staging primary tumours. J Cancer Res Clin Oncol 2000, 126:560-574 [DOI] [PubMed] [Google Scholar]
- 36.Higashi T, Tamaki N, Honda T, Torizuka T, Kimura T, Inokuma T, Ohshio G, Hosotani R, Imamura M, Konishi J: Expression of glucose transporters in human pancreatic tumors compared with increased FDG accumulation in PET study. J Nucl Med 1997, 38:1337-1344 [PubMed] [Google Scholar]
- 37.Ebert BL, Firth JD, Ratcliffe PJ: Hypoxia and mitochondrial inhibitors regulate expression of glucose transporter-1 via distinct Cis-acting sequences. J Biol Chem 1995, 270:29083-29090 [DOI] [PubMed] [Google Scholar]
- 38.Seagroves TN, Ryan HE, Lu H, Wouters BG, Knapp M, Thibault P, Laderoute K, Johnson RS: Transcription factor HIF-1 is a necessary mediator of the Pasteur effect in mammalian cells. Mol Cell Biol 2001, 21:3436-3444 [DOI] [PMC free article] [PubMed] [Google Scholar]
- 39.Eguchi Y, Srinivasan A, Tomaselli KJ, Shimizu S, Tsujimoto Y: ATP-dependent steps in apoptotic signal transduction. Cancer Res 1999, 59:2174-2181 [PubMed] [Google Scholar]
- 40.Plas DR, Talapatra S, Edinger AL, Rathmell JC, Thompson CB: Akt and Bcl-xL promote growth factor-independent survival through distinct effects on mitochondrial physiology. J Biol Chem 2001, 276:12041-12048 [DOI] [PubMed] [Google Scholar]
- 41.Gottlob K, Majewski N, Kennedy S, Kandel E, Robey RB, Hay N: Inhibition of early apoptotic events by Akt/PKB is dependent on the first committed step of glycolysis and mitochondrial hexokinase. Genes Dev 2001, 15:1406-1418 [DOI] [PMC free article] [PubMed] [Google Scholar]


