

Abstract
Tumors are often characterized by an imbalance in cytosine methylation as manifested both by hypermethylation of CpG islands and by genome hypomethylation. These epigenetic changes were assessed in colorectal neoplasia to determine whether they arose through a common mechanism or indeed were distinct and unrelated phenomena. Fresh representative samples of adenomas, hyperplastic polyps, colorectal cancers, and normal mucosa were used in this study. Global methylation levels were measured by analyzing the methyl-accepting capacity of DNA. Methylation of p16, hMLH1, and MINT 1, 2, 12, and 31 were assessed by bisulfite polymerase chain reaction. Microsatellite status was determined by polymerase chain reaction using six markers and hMLH1 and proliferating cell nuclear antigen expression was assessed by immunohistochemistry. Normal colonic mucosa had a higher endogenous 5-methyl cytosine content than all proliferative lesions of the colon (P < 0.001). The extent of demethylation in hyperplastic polyps and adenomas was significantly related to its proliferative rate. Right-sided hyperplastic polyps were more likely to be methylated than adenomas (odds ratio, 2.3; confidence interval, 1.1 to 4.6). There was no relationship between the level of global hypomethylation and hypermethylation. Some hyperplastic colorectal polyps have a propensity to develop dense CpG island methylation. Hypermethylation and hypomethylation contribute separately to the process of carcinogenesis.
Changes in cytosine methylation are a well-recognized phenomenon in neoplastic cells, 1 and it is known that both global hypomethylation 2,3 and CpG island hypermethylation 4 are operative in colorectal neoplasia. Hypomethylation has been implicated in the activation of oncogenes such as c-myc, 5 and it may also contribute to karyotype instability. 1 One the other hand, genomic hypomethylation because of DNA methyltransferase deficiency has been shown to suppress the formation of adenomatous polyps in mouse models of intestinal neoplasia. 6,7 Clearly the role of hypomethylation in colorectal neoplasia remains uncertain.
CpG island methylation is the signature of transcriptional silencing of many genes, and in the case of hMLH1 leads to the development of common microsatellite unstable colorectal cancer. 8-10 More recent studies on the role of CpG island methylation in colorectal cancer have identified specific sites within the genome that are preferentially methylated in tumors (MINT loci), and tumors showing dense methylation of these sites have been said to show the CpG island methylator phenotype. 4 It is apparent that these heavily methylated tumors have relatively distinct clinicopathological and genetic features, 11 and a proportion of these tumors may arise through a serrated pathway that involves hyperplastic polyps and serrated adenomas. 12-14
A better understanding of the role of hypomethylation and hypermethylation in colorectal carcinoma may come through an assessment of these events within individual lesions considered to be precursors of cancer. There is little data currently available regarding the role of hypomethylation in the precursor lesions of colorectal cancer. Although several small studies have examined hypomethylation in colorectal adenomas, 3,15,16 its occurrence in hyperplastic polyps is yet to be assessed. Likewise, there is limited data regarding the frequency and significance of hypermethylation in the precursor lesions of colorectal carcinoma. Extensive CpG island hypermethylation has been reported in between 25% and 49% of adenomas, 17,18 depending on whether they were found in association with synchronous cancers. In the case of hyperplastic polyps, the limited data available on hypermethylation has been derived primarily from individuals with hyperplastic polyposis, multiple large polyps, or with synchronous cancers. 13,19 Clearly, the use of such selected cases, often with atypical features, makes it difficult to generalize these results to the broader population.
Finally, given that both hypomethylation and CpG island hypermethylation represent fundamental changes in patterns of methylation in the genome, it is tempting to speculate that the two phenomena may be related. This relationship has not been examined in colorectal neoplasia. In this study, we determined the frequencies and interrelationships of global hypomethylation and CpG island hypermethylation in colorectal carcinomas and their precursor lesions. In doing so, we used representative samples of sporadic hyperplastic polyps, small and large adenomas, and cancers selected at random from large tissue banks. Through the simultaneous analysis of methylation patterns in this representative spectrum of lesions, we hoped to gain insight into the role of global hypomethylation and hypermethylation of CpG islands in the initiation and progression of colorectal neoplasia.
Materials and Methods
Patients and Tissue Samples
This study used fresh representative samples of colonic polyps, colorectal cancers, and normal mucosa from consented individuals undergoing procedures at the St. Vincent’s Campus (Table 1) ▶ . The colorectal cancers, small adenomas, and hyperplastic polyps were randomly selected from two large tissue banks. The colorectal cancers were identified by allocating a random number to all cancer specimens in a databank of 560 tumor samples that has been described previously. 11 The first 24 colorectal carcinomas with the lowest assigned number, together with paired normal mucosal samples from that colectomy specimen (lesional normal mucosa) were then selected for entry into this study. Two of these cancers had paired large adenoma tissue available. The same procedure was used to select 20 hyperplastic polyps and 21 small adenomas (maximum diameter, ≤10 mm) from a prospective collection of 203 polyps. These polyps had been collected from 129 patients who underwent routine colonoscopy at the St. Vincent’s Hospital Campus from January 2001 to July 2002. A further 30 large adenomas from 29 individuals were also used in this study. They had been collected prospectively from 1993 to January 2001 from individuals undergoing colectomies for removal of adenomas not amenable to colonoscopic resection. Additional samples of normal colonic mucosa (19 from the rectum and 1 from the ascending colon) were collected from 20 consecutive healthy individuals with a normal colonoscopic examination (nonlesional normal mucosa). Patients with inflammatory bowel disease or a known history of hereditary nonpolyposis colorectal cancer, familial adenomatous polyposis, hyperplastic polyposis, or multiple large hyperplastic polyps were excluded from entry into this study. However, one patient with an adenoma was found to have hereditary nonpolyposis colorectal cancer after resection of their colonic lesion was performed.
Table 1.
Summary of Study Tissues and Patient Demographics
| Specimen | No. of people, age, sex | Source |
|---|---|---|
| Nonlesional normal mucosa (n = 20) | n = 20, 58 ± 17 years, M:F 1.5:1 | Normal diagnostic colonoscopy |
| Lesional normal mucosa* (n = 25) | n = 25, 68 ± 15 years, M:F 0.9:1 | Paired normal tissues from 22 individuals with CRC and 3 with large adenomas |
| Colorectal cancers (n = 24) | N = 24, 68 ± 15 years, M:F 0.9:1 | Randomly selected from tissue bank of 560 colorectal cancers |
| Large adenomas (n = 32) | n = 31, 64 ± 12 years, M:F 1.7:1 | Consecutive surgical samples† |
| Small adenomas (n = 21) | n = 21, 67 ± 8 years, M:F 0.8:1 | Randomly selected from a tissue bank of 203 polyps |
| Hyperplastic polyps (n = 20) | n = 19, 63 ± 12 years, M:F 1.2:1 | Randomly selected from a tissue bank of 203 polyps |
*For the purpose of analysis, samples of lesional normal mucosa from patients with adenomas and from those with adenocarcinomas were grouped together.
†Includes two adenomas from individuals with a synchronous colorectal cancer.
Histopathological and Immunohistochemical Analysis of Tumors
For all tumors, the histopathological type, stage, grade, and size were determined independently by a histopathologist within the St. Vincent’s Hospital Department of Anatomical Pathology, as previously described. 11 In the case of polyps, the cut surface from which fresh tissue was removed was marked with dye (India ink) and the histopathological features of the immediately adjacent tissue were reported. The colorectal cancers were predominantly left sided (71%) and most were moderately differentiated (92%). Two of the cancers were stage I, 9 were stage II, 11 stage III, and 2 were stage IV. Table 2 ▶ outlines the pathological characteristics of the polyps used in this study.
Table 2.
Pathological Characteristics of Polyps Used in This Study
| Hyperplastic polyps (n = 20) | Small adenomas (n = 21) | Large adenomas (n = 32) | |
|---|---|---|---|
| Size (cm) | 0.6 ± 0.4 | 0.7 ± 0.2 | 3.2 ± 1.3 |
| Histopathology | |||
| Tubular | N/A | 13 (62%) | 14 (44%) |
| Tubulovillous | 8 (38%) | 9 (28%) | |
| Villous | 0 | 9 (28%) | |
| Dysplasia | |||
| Mild | N/A | 2 (10%) | 2 (6%) |
| Moderate | 15 (71%) | 20 (63%) | |
| Severe | 4 (19%) | 10 (31%) | |
| Serration | |||
| 0% | 15 (71%) | 14 (44%) | |
| 1–20% | 6 (29%) | 12 (38%) | |
| >20% | 20 (100%) | 0 | 6 (19%) |
| Site | |||
| Left | 12 (63%) | 13 (62%) | 15 (47%) |
| Right | 8 (37%) | 8 (38%) | 17 (53%) |
Size is expressed as the mean maximum dimension ± standard deviation. Left sided represents those lesions proximal to the splenic flexure. N/A, not applicable.
Immunohistochemical analysis was performed in a DAKO autostainer on dewaxed 4-μm paraffin sections (DAKO Corporation, Carpinteria, CA). Staining for hMLH1 was as previously described, 20 using monoclonal anti-human hMLH1 antibody (1:200;, Becton Dickinson, Lexington, KY). hMLH1 expression was considered to be absent where there was no staining of tumor cells in the presence of nuclear staining in nearby germinal follicle lymphocytes or in epithelial cells in the base of adjacent nonneoplastic crypts.
Detection of proliferating cell nuclear antigen (PCNA) in paraffin sections was performed with mouse anti-PCNA (PC10, 1:100 in 1% bovine serum albumin; DAKO). After incubation with primary antibody for 60 minutes, bound antibody was detected with the LKAB antibody detection system (DAKO) according to manufacturer’s instructions. Color was developed with diaminobenzidine (DAB fast stain kit, DAKO) and sections counterstained with hematoxylin before analysis. For PCNA immunostaining, cells showing distinct nuclear staining with chromagen were considered positive. The degree of proliferative activity in each lesion was determined by one observer (NJH), and expressed as the average number of positive cells (stromal or epithelial) in each of 10 random high-power fields (high-power field = 0.8 mm2).
Effects of Proliferation on Hypomethylation of Normal Lymphocytes
Proliferation of peripheral blood mononuclear cells was achieved by plating the cells at a density of 1 × 10⁶ cells/ml in RPMI containing 20 mmol/L l-glutamine, 10 mmol/L HEPES, 10% human AB serum, phorbol 12-myristate 13-acetate (PMA) (25 ng/ml), and ionomycin (1 μg/ml) for 4 days. Throughout this period, cells were harvested every 24 hours for DNA extraction and for flow cytometric analysis of their proliferative content using the fluorescein isothiocyanate-conjugated antibody Ki-67 (20 μl; Pharmingen, San Diego, CA). Cells for flow cytometry were stored at −80°C in 2 ml of FACSLyse (Becton Dickinson Biosciences, San Jose, CA) until the time course was completed. The number of proliferating cells at each time point was reported as the percentage of Ki-67-positive cells.
Detection of Methylation of p16, hMLH1, and MINT 1, 2, 12, and 31
For methylation analyses, DNA was extracted and treated with sodium bisulfite as previously described. 11 Methylation-specific polymerase chain reaction (MSP) was performed to detect methylation of the p16 promoter region. 9,11 All amplicons generated by the methylation-specific p16 primers were digested with 20 U of BstUI at 60°C overnight (New England Biolabs Inc., Beverly, MA) to confirm methylated DNA because the methylated amplicon has two restriction sites for this enzyme while the unmethylated amplicon has none. The methylation status of MINT 1, 2, 12, and 31 was performed according to the method of Toyota and colleagues, 4 with modifications as previously described. 11 Methylation of hMLH1 was examined by bisulfite-RFLP at two separate regions of the hMLH1 promoter (A and C) reported to be associated with hMLH1 silencing. 9,21 The A-region, encompassing bp 801 to 1050 of the hMLH1 promoter, was examined with the primers MLH-AF, 5′-TTAYGGGTAAGTYGTTTTGAYGTAGA-3′ and MLH-AR, 5′-CCTATACCTAATCTATCRCCRCCTCA-3′. The C-region, encompassing bp 1201 to 1450 was examined with the primers MLH-CF, 5′-GGTTGGATATTTYGTATTTTTYGAG-3′ and MLH-CR, 5′-AATTACTAAATCTCTTCRTCCCTCC-3′. Polymerase chain reaction (PCR) was performed with 100 ng of bisulfite-modified template with 1 μmol/L of each primer, 1.5 mmol/L MgCl2, 250 μmol/L dNTPs, and 1.5 U FastStart TaqDNA polymerase (Roche Diagnostics GmBH, Mannheim, Germany) in the recommended buffer. PCR cycling conditions were as follows: 95°C for 5 minutes, 35 cycles of 95°C for 30 seconds, 55°C for 45 seconds, 72°C for 30 seconds before a final extension at 72°C for 4 minutes. The primers were designed to amplify both methylated and unmethylated template in the same reaction. Amplicons from methylated or unmethylated template were distinguished by restriction enzyme digestion with 20 U of BstUI. Amplicons from unmethylated template are resistant to digestion whereas amplicons from methylated template will be digested.
Methylation was reported for hMLH1, p16, and each MINT locus as either unmethylated, methylated, or not assessable. Positive and negative controls 11 were included for each reaction. PCR at all loci were performed from the same bisulfite-treated reaction in the majority of cases, and interpreted separately by two of the investigators without knowledge of other PCR results or sample details. A final result was determined only where both observers were in agreement. In the case of discordant interpretation, analysis was repeated on two further occasions, and if concordance was not obtained, the result was considered nonassessable at that locus.
There were 19 of 485 reactions in which amplification of one of the MINT loci or p16 was not achievable. In 10 of these cases, there was no methylation detected at the other four sites and these were considered 0% methylated for the purposes of quantitative analysis in this study. There were five cases with one of the remaining four loci methylated, two cases with two of the remaining four loci methylated, and one case with three of the remaining four loci methylated. These were assigned a percentage methylation of 20%, 40%, and 60%, respectively, for the purpose of further analysis in this study. One large adenoma was not assessable at two loci, and this polyp was therefore excluded from any analysis requiring the total percentage methylation.
Microsatellite Status
The microsatellite status of each tumor was determined as previously described using the following primer sets: Bat 25, Bat 26, Bat 40, D5S346, D2S123, and D17S250. 20 Products were run on an ABI 377 sequencer and analyzed using Genescan and Genotyper software (ABI, Foster City, CA). Two observers performed the analysis of microsatellite instability, and the results were reported without knowledge of pathological or immunohistochemical status. A tumor sample was considered to show microsatellite instability if two or more of the markers demonstrated instability. Where one or none of the markers showed instability, the tumor was designated as microsatellite stable.
Hypomethylation Assay
The total methylated CpG content of tissue samples and peripheral blood lymphocytes were determined after the method of De Smet and colleagues. 22 DNA was digested with XbaI (20 U/μg) for 2 hours at 37°C then extracted with phenol-chloroform-isoamyl alcohol (24:1), recovered by alcohol precipitation, and resuspended in water at 50 μg/ml. Global CpG methylation levels were measured by analyzing the methyl-accepting capacity of the XbaI-digested DNA using a radiolabeled methyl donor, S-adenosyl-l-(methyl-3H)methionine (SAM), and M.SssI methylase. M.SssI methylase catalyzes the transfer of methyl groups from SAM to cytosine residues within CpG dinucleotides. DNA (5 μl) was incubated in a reaction volume of 20 μl containing 5 μl of SAM (15.0 Ci/mmol; Amersham Pharmacia Biotech, Bucks, UK), 2 μl of M.SssI methylase (4 U/μl, New England Biolabs, Beverly, MA), 1 μl of Tris-HCl, IM (pH 8), and 2 μl of NEB buffer 2 (10×; New England Biolabs) for 4 hours at 37°C. The reaction was stopped by incubation at 80°C for 20 minutes. The same reaction was performed using dam methylase (1.5 μl of 8 U/μl, New England Biolabs) and 2 μl of NEB buffer for dam methylase (10×, New England Biolabs) to methylate the adenine residues in GATC sequences. Unlike cytosine in CpG dinucleotides, the adenine in GATC sequences is never methylated in mammalian DNA. The incubation mixtures were then precipitated with 5% trichloroacetic acid and the unincorporated (methyl-3H) SAM was removed by washing three times. The dry pellet was then subjected to scintillation counting (LSC-6000, Beckman) to determine the amount of 3H-methyl groups incorporated onto the DNA. The total amount of 3H-methyl incorporation in each reaction reflects the reciprocal of the endogenous level of methylation at the respective sites. The percentage of methylated CpG content of each sample was then calculated using the ratio of M.SssI and dam methylase 3H incorporation (SssI/dam ratio), and the relative estimated frequencies of dam and SssI sites, as follows: % of methylated CpG = [1 − (SssI/dam ratio ÷ 3.2)] × 100, where 3.2 corresponds to the frequency of the dam recognition site (1 of 256), compared to the frequency of the M.SssI recognition site (1 of 80). 22
For each sample, the measurement was performed in triplicate on one day, together with a control DNA sample from the peripheral blood of a healthy individual. The DNA samples for analysis were randomly grouped into batches of 15 as this represented the maximum number that could be analyzed in triplicate per assay. The absolute decrease in global methylation reported for each sample represents the difference between its mean percentage of methylated CpG and that of the normal control peripheral blood DNA measured on the same day of testing.
Statistical Analysis
Categorical variables were compared using the chi-square test or the Fisher’s exact test as appropriate. A one-way analysis of variance with post hoc Bonferroni procedure was used to compare the levels of hypomethylation in polyps, normal mucosa, and colorectal cancers, and a paired Student’s t-test was used to compare the hypomethylation levels in samples collected from the same individual. Spearman correlation coefficients were used to examine associations at the ordinal level, such as between tumor stage and hypomethylation levels, while this test was also used to compare variables such as hypomethylation and age or PCNA counts. Tumor hypermethylation was considered as an interval variable (0 to 5). Because it showed a skewed distribution, nonparametric statistical methods were used to analyze data. Specifically, the Wilcoxon rank sum test was used to compare extent of methylation with categorical variables, whereas the Spearman’s rho test was used to determine the relationship between extent of hypermethylation and age. Logistic regression analysis was used to examine the relationship between the hypermethylation status and binary variables such as polyp characteristics, tumor site, and patient sex. It was also used to analyze the relationship between hMLH1 methylation and hypermethylation of other CpG sites. A probability value of less than 0.05 was considered significant. All data were analyzed using the SPSS statistical software V11.0 (SPSS Inc., Chicago, IL).
Results
Assessment of Hypomethylation in Normal Mucosa and Neoplastic Tissue
Before its use in the various colonic tissues, the global DNA hypomethylation assay was first assessed in terms of its reproducibility. Interassay variation was determined by repeat analysis of the same peripheral blood sample on 11 separate occasions. The mean percentage of methylated CpGs in DNA from this sample was 73 ± 4.2% with a coefficient of variance of 5.7%. Furthermore, DNA from five colonic tissue samples was also assayed on two separate occasions, and the change in methylation content between the first and second assays was found to be between 0.5% and 8.1% (mean, 4.3%). To adjust for this level of interassay variation, it was considered appropriate to report the measured 5-methyl cytosine content of each test sample as the percentage decrease in methylation of the test sample relative to control DNA.
Normal colonic mucosa, regardless of whether it originated from healthy patients (nonlesional normal mucosa; mean percent reduction in methylation, 6.5 ± 9.9) or those harboring neoplastic lesions (lesional normal mucosa; percent reduction in methylation, 5.2 ± 7.7) had a higher endogenous 5-methyl cytosine content than all proliferative lesions of the colon (F = 19.27, P < 0.001; analysis of variance with Bonferroni multiple comparison; Figure 1 ▶ ). Furthermore, there was no difference in the level of hypomethylation across all proliferative lesions of the colon, whether they were benign or malignant (P = 0.78; analysis of variance).
Figure 1.

Comparison of the extent of global DNA hypomethylation in the different tissue types assessed in this study. Mucosa-H, normal colonic mucosa from healthy individuals; mucosa-C, normal mucosa from individuals with neoplastic lesions; HP, hyperplastic polyps; small adenomas, adenomas ≤10-mm maximum diameter; large adenomas, adenomas >10-mm maximum diameter; colorectal cancer, colorectal carcinoma; n, number of samples analyzed in each group. For the purpose of analysis, normal tissues from patients with adenomas (n = 3) were grouped with those from patients with colorectal cancers (n = 22). The absolute demethylation level refers to the percentage of methylated CpG in the colonic sample after subtraction from the control peripheral blood mononuclear cells sample. Each sample was assayed in triplicate and the mean decrease in absolute methylation content and 95% confidence intervals are shown.
Thirty-one lesions (22%) demonstrated a marked decrease in absolute methylation, with reductions of greater than 26% compared with control DNA. Of these samples, three were hyperplastic polyps (3 of 20, 15%), 20 were adenomatous polyps (20 of 52, 38%), and eight were colorectal cancers (8 of 24, 33%). There was no statistically significant difference in the number of samples in each group with severe hypomethylation (P = 0.32, chi-square test), although the number of hyperplastic polyps did appear to be underrepresented.
For a given individual, it was apparent that colorectal cancer tissue was significantly more demethylated than its matched normal mucosa (P < 0.001, paired Student’s t-test). All but one individual had less demethylated DNA in their normal colonic mucosa than in their colorectal cancer (Figure 2) ▶ . This patient was an 85-year-old female with a small microsatellite unstable stage I cecal carcinoma. The three patients with matched adenoma and normal colonic tissue for analysis also demonstrated a significant decrease in the endogenous 5-methyl-cytosine content in neoplastic tissue in comparison to normal mucosa (P < 0.001, paired Student’s t-test).
Figure 2.

Comparison of methylation levels in 22 colorectal carcinomas and matched normal colonic mucosa of individual patients. Each line demonstrates the relationship between the methylation levels in the colorectal tumor and its paired normal mucosa.
Factors that Influence DNA Hypomethylation
The level of demethylation in the normal colonic mucosa (n = 45) correlated with advancing age of the individual (Pearson correlation coefficient, 0.3; P = 0.05). However, gender or tissue site of origin did not influence the genomic methylation level. With regard to adenomatous polyps, we found no association between extent of global genomic demethylation and most of the clinicopathological features, including patient gender and age as well as polyp site and architecture. There may be an association between dysplasia and the global level of methylation, because the four polyps with mild dysplasia were noted to have less demethylation (mean, 12.2 ± 6.8%) than the groups with moderate (n = 35; mean, 21.9 ± 9.1%) or severe dysplasia (n = 14; mean, 25.2 ± 7.4%; analysis of variance, F = 3.6; P = 0.04). No specific pathological features were associated with the extent of demethylation in colorectal cancers. In particular, the tumor site, degree of differentiation, tumor volume, and tumor stage were not significantly associated with demethylation.
To examine the effect of proliferation on DNA methylation, we first stimulated lymphocytes throughout a 4-day period and correlated the percentage of proliferating (Ki67-labeled) cells with the percentage of total methylated CpG content at each time point. The measured percentage of CpG methylation was 77.4% at baseline, 73.2% at 24 hours, 67.6% at 48 hours, 64.6% at 72 hours, and 69.7% at 96 hours. Interestingly the respective proliferation values at these time points were 3%, 0.6%, 33%, 57.4%, and 44.6%, respectively, indicating that there was an inverse relationship between methylation and proliferation.
This relationship between proliferation and methylation was also observed in the small adenomas and hyperplastic polyps examined in this study. Immunostaining for PCNA was assessable in 28 of 49 polyps (16 hyperplastic and 12 small adenomas). Although a small number of lymphocytes and stromal cells stained for PCNA in these lesions, the significant majority (>90%) of proliferative cells were lesional epithelial cells. The mean number of proliferative (PCNA-positive) cells in hyperplastic polyps (110 ± 47 cells per high-power field) was significantly lower than that observed in small adenomas (312 ± 146 cells per high-power field) (Mann Whitney U = 15, P < 0.001). Moreover, the proliferative rate observed in each of the hyperplastic polyps and smaller adenomas was found to correlate with the extent of demethylation in DNA extracted from these lesions (Spearman’s rho = 0.33, P = 0.09).
Assessment of CpG Island Hypermethylation in Colorectal Polyps and Cancer
Methylation was assessable in more than 99% of cases for MINT 1 and p16, 94% for MINT 2, 89% for MINT 12, and 95% for MINT 31. The frequency of methylation at MINT loci, p16, and hMLH1 in different colonic tissues is shown in Table 3 ▶ and Figure 3 ▶ .
Table 3.
Number and Percentage of Lesions within Each Group Showing CpG Island Methylation at Specific Loci
| MINT 1 | MINT 2 | MINT 12 | MINT 31 | p16 | hMLH1-A | hMLH1-C | |
|---|---|---|---|---|---|---|---|
| HP | 4 (20%) | 9 (45%) | 7 (35%) | 5 (25%) | 6 (30%) | 10 (50%) | 2 (10%) |
| Small adenoma | 2 (9.5%) | 10 (48%) | 2 (9.5%) | 2 (9.4%) | 3 (14%) | 3 (16%) | 1 (5.3%) |
| Large adenoma | 4 (12.5%) | 7 (22%) | 12 (38%) | 1 (3%) | 4 (12.5%) | ND | ND |
| CRC | 7 (29.2%) | 11 (46%) | 9 (37.5%) | 3 (12.5%) | 6 (25%) | 5 (21%) | 2 (8.3%) |
HP, hyperplastic polyp; CRC, colorectal carcinoma; ND, not done.
Figure 3.

Representative gel showing the analysis of four tumors (T1 to T3) for methylation at p16 (A) and hMLH1 regions A and C (B). For p16, bisulfite-modified DNA was amplified in separate reactions to identify unmethylated (U) and methylated template (M). All amplicons generated by the methylation-specific p16 primers were digested with BstUI. The methylated amplicon from T2 (UD) has digested (D), confirming that this tumor was truly methylated at p16. There was no amplification with the methylation-specific primers for tumor T1 and therefore this tumor is unmethylated. Methylation of hMLH1 regions A and C (B) was detected by PCR amplification of bisulfite-modified DNA followed by digestion with BstUI, which only cuts the methylated amplicon. Undigested amplicon is shown (UD), and after digestion it is apparent that T1 is unmethylated at both regions, T3 at region C only and T2 is methylated at both regions A and C. Molecular weight marker (MW) is pUC19/MspI.
The most striking finding in this analysis was the high rate of methylation at hMLH1-A in hyperplastic polyps in comparison to adenomas and colorectal cancers (chi-square, P = 0.04 for hMLH1-A). In fact hyperplastic polyps were 5.3 times more likely to have methylation of hMLH1-A than adenomas [odd ratio (OR), 5.3; 95% confidence interval (CI), 1.2 to 24.2, P = 0.03] (Tables 3 and 4) ▶ . On the other hand, there was no significant difference in the frequency of methylation of hyperplastic polyps, adenomas, or colorectal cancers at p16 (chi-square, P = 0.34), MINT 1 (P = 0.3), MINT 2 (P = 0.3), MINT 12 (P = 0.5), MINT 31 (P = 0.16), or hMLH1-C (P = 0.94). A histogram showing the frequency of methylation at p16 and the MINT loci in polyps and cancers is shown in Figure 4 ▶ .
Figure 4.

Distribution of CpG island methylation in hyperplastic polyps, adenomas, and colorectal carcinomas. The histogram shows the percentage of methylated loci according to the histological type of the lesion. The MINT sites and p16 are included in the analysis. It is apparent that both small and large adenomas show a skewed distribution of methylation with 98% (51 of 52) of lesions demonstrating methylation at less than four sites. Hyperplastic polyps and colorectal cancer demonstrate a more continuous distribution of methylation with 6 of 44 lesions (14%) showing methylation at more than three sites.
Considering all lesions, the frequency of methylation seems to follow a continuous rather than strictly bimodal pattern. For this reason, where possible, methylation status was regarded as an interval (0 to 5) rather than categorical variable. Not surprisingly, the methylation status of all lesions correlated positively with methylation of hMLH1 at regions A (OR, 2.8; 95% CI, 1.7 to 4.7; P trend, <0.0001) and C (OR, 3.5; 95% CI, 1.5 to 8.2; P trend, 0.004). When all lesions were included in the analysis, we found no relationship between methylation status and the age or sex of the individual.
Considering polyps alone, univariate analysis showed that hyperplastic polyps were significantly more methylated than adenomatous lesions (OR, 1.6; 95% CI, 1.02 to 2.4; P trend, 0.04). This difference held true for right-sided polyps (OR, 2.3; 95% CI, 1.1 to 4.6: P trend, 0.02) but was not found for the left-sided lesions (OR, 1.2; 95% CI, 0.7 to 2.3; P = 0.53). Methylated hyperplastic polyps were equally common in males and females (OR, 0.73; 95% CI, 0.4 to 1.3) and were relatively equally distributed throughout the colon although there was a trend to right-sided location (OR, 1.7; 95% CI, 0.9 to 3.1; P = 0.09) (Table 4) ▶ . With regard to adenomatous polyps, there was no association between methylation and the sex or age of the individual or to polyp size, dysplasia, or villous content. There was however a trend linking the methylation status and degree of serration (OR, 2.0; 95% CI, 0.9 to 4.7; P = 0.09), as assessed histologically as the percentage of lesional crypts showing typical serrated architecture.
Table 4.
Characteristics of Hyperplastic Polyps According to the Methylation Status at hMLH1-A
| Side | Sex | Age (years) | Size (mm) | hMLH1-C methylation | Sites methylated* | MSI | |
|---|---|---|---|---|---|---|---|
| hMLH1-A methylated | Right (n = 4) | M | 47 | 4 | Yes | 3 | MSI |
| M | 65 | 3 | No | 5 | MSS | ||
| M | 53 | 8 | No | 3 | MSS | ||
| F | 80 | 8 | Yes | 4 | MSS | ||
| Left (n = 6) | F | 66 | 2 | No | 0 | MSS | |
| F | 50 | 3 | No | 0 | MSS | ||
| M | 72 | 2 | No | 2 | MSS | ||
| M | 75 | 6 | No | 3† | MSS | ||
| M | 57 | 4 | No | 3 | MSS | ||
| F | 77 | 4 | No | 4 | MSS | ||
| hMLH1-A unmethylated | Right (n = 3) | M | 68 | 4 | No | 0 | MSS |
| M | 63 | 5 | No | 1 | MSS | ||
| F | 76 | 15 | No | 1 | MSS | ||
| Left (n = 7) | F | 63 | 5 | No | 0 | MSS | |
| F | 58 | 3 | No | 0 | MSS | ||
| F | 60 | 5 | No | 0 | MSS | ||
| M | 73 | 12 | No | 0 | MSS | ||
| M | 40 | 4 | No | 0 | MSS | ||
| M | 75 | 7 | No | 1 | MSS | ||
| F | 46 | 15 | No | 1 | MSS |
*Sites methylated includes MINT 1, 2, 12, 31, and 16. M, male; F, female; MSS, microsatellite stable; MSI, microsatellite unstable.
†This polyp was a serrated adenoma with focal loss of hMLH1 expression.
Four of 96 lesions (one hyperplastic polyp, one large adenoma, and two cancers) demonstrated microsatellite instability. The large unstable adenoma had arisen in an individual who was subsequently found to harbor a germline mutation in hMSH2. This tumor did not demonstrate methylation at hMLH1, the MINT sites, or p16. The unstable colorectal cancers had arisen in the cecum or descending colon of two elderly women (mean age, 86 years). Both cancers demonstrated methylation of hMLH1 and of the MINT and p16 markers (five of five and three of five, respectively) and had lost expression of hMLH1. The unstable hyperplastic polyp arose in the ascending colon of a 47-year-old male (Table 4) ▶ . The expression of hMLH1 was examined in all small adenomas and hyperplastic polyps. Although all of the small adenomas showed normal expression, one microsatellite stable hyperplastic polyp showed focal loss of hMLH1 (Table 4) ▶ .
We were able to correlate the level of global hypomethylation with the hypermethylation status in a total of 96 samples, including 20 hyperplastic polyps, 52 adenomatous polyps, and 24 colorectal carcinomas. There was no relationship between these two variables when all samples were considered (Spearman rho correlation coefficient, −0.04; P = 0.7) or when each group of lesions was analyzed separately (Figure 5) ▶ .
Figure 5.
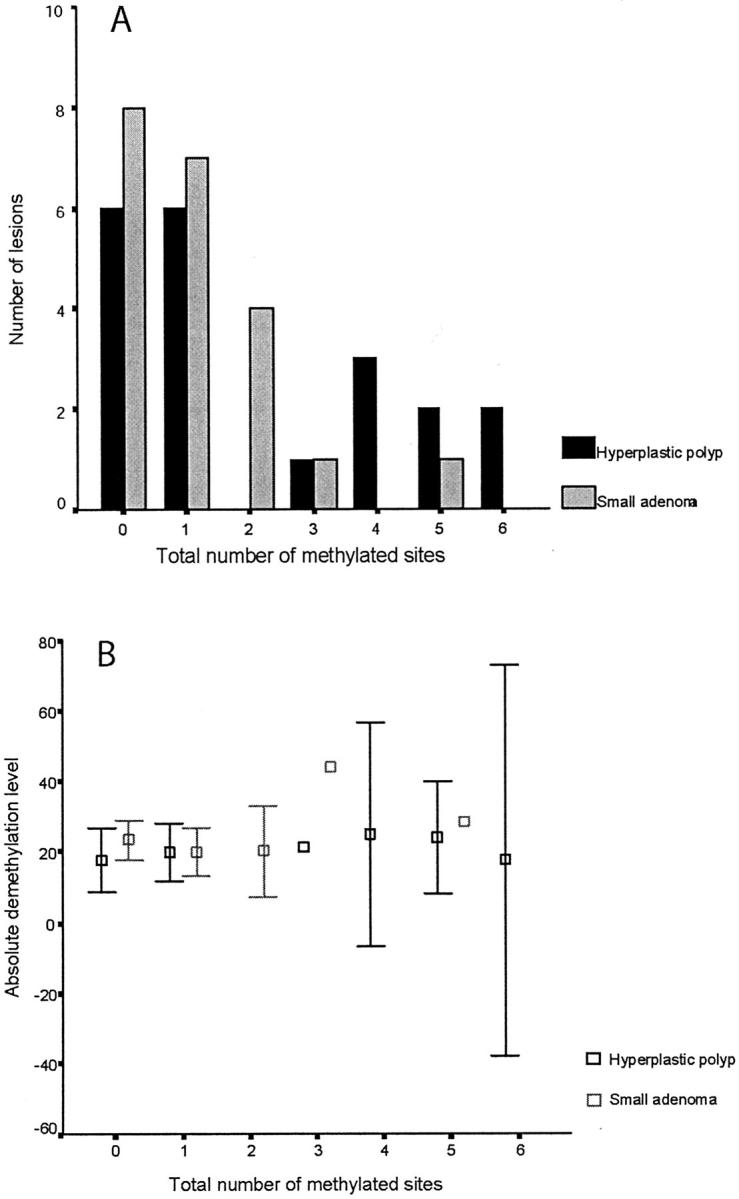
Comparison of CpG island methylation (A) and corresponding levels of hypomethylation (B) in hyperplastic polyps (n = 20) and small adenomas (n = 21). The histogram shows the number of methylated loci according to the histological type of the lesion. The MINT sites, p16, hMLH1-A, and hMLH1-C are included in the analysis, so the maximum total number of methylated sites for each lesion is seven. The absolute demethylation level refers to the percentage of methylated CpG in the sample after subtraction from the control peripheral blood mononuclear cell sample. Each sample was assayed in triplicate, and the mean decrease in absolute methylation content and 95% confidence intervals are shown. There was no relationship between the number of methylated sites and the extent of demethylation for hyperplastic polyps (Spearman’s rho, 0.32; P = 0.2) or small adenomas (Spearman’s rho, 0.08; P = 0.74).
Discussion
Tumor DNA is often characterized by perturbations in cytosine methylation as manifest both by hypermethylation of CpG islands and by global and regional hypomethylation. 1 A number of studies have sought to reconcile this apparent paradox, yet it has remained unclear as to whether these epigenetic changes are causally linked, or are distinct and biologically unrelated phenomena. In the current study we provide evidence that supports the latter hypothesis, and suggest that hypermethylation rather than hypomethylation is directly linked to the development of some colorectal tumors.
Intuitively, one may expect a negative association between hyper- and hypomethylation, such that tumors with high levels of CpG island hypermethylation would be less likely to display global or regional hypomethylation. On the other hand, it has been suggested that global genomic hypomethylation may serve to promote CpG island hypermethylation. If either scenario were true, then it would seem reasonable to expect a clear correlation between the two phenomena as they occur within individual lesions. Furthermore, if one of these phenomena drives development of the other, then they may show consistent temporal relationships across lesions at different stages of tumor progression.
Using DNA from both premalignant polyps and colorectal cancers, we were unable to demonstrate a relationship between global demethylation and hypermethylation at seven CpG islands. This finding is consistent with recent studies in both breast cancer and Wilms’ tumor in which hypermethylation at a number of CpG sites was found to be unrelated to the extent of global hypomethylation, or to the presence of hypomethylation of Chr1 and Sat 2. 23,24 Taken together, these studies suggest that the contribution of DNA hypomethylation to tumorigenesis is separate from that of transcriptional silencing induced by CpG island hypermethylation.
Genomic Hypomethylation in Colorectal Neoplasia
A number of studies, including the current investigation, have clearly demonstrated that the genomic 5-methyl cytosine content of colorectal cancers is reduced when compared with the paired normal mucosa. 3,16,25,26 Although the absolute changes in methyl content vary between studies, it is likely that this primarily reflects variations in methodology. 26-28 For example, some workers prefer high performance liquid chromatography for the measurement of genomic 5-methylcytosine content, 3 yet this method requires more DNA than the method of De Smet and colleagues 22 and does not specifically distinguish between methylation at any cytosine and that occurring specifically at the CG doublet. The method applied in the current study also has the advantage of controlling for small variations in the amount of DNA per sample, because the M.SssI counts are compared to dam counts, rather than to the amount of DNA. Additionally, because the frequency of M.SssI and dam sites in the human genome are known, the percentage of methyl CpG can be determined. Furthermore, it is possible that the measured levels of methylation vary in different populations because of common variants in genes that influence the metabolism of methyl groups. This hypothesis is supported by recent work that showed a link between polymorphisms in methylene-tetrahydrofolate reductase and methionine synthase and methylation in tumor and normal tissues. 29
With regard to the role of global hypomethylation in the development of colorectal cancer, our study has shown this event occurs early in the course of tumor development and appears specific for neoplastic cells. Interestingly, there have been very few studies that have addressed the levels of global demethylation in adenomatous polyps, and none that have examined these levels in hyperplastic polyps. Feinberg and colleagues 3 analyzed eight adenomas, whereas the study of Goelz and colleagues 16 included 10 adenomatous polyps, four of which were derived from patients with familial adenomatous polyposis. In both studies, adenomas showed a reduction in methylation content that was comparable with that seen in the colorectal cancers. The small numbers of samples included in these investigations may have precluded the detection of changes in methylation content associated with tumor progression. Our findings of demethylation in sporadic adenomas clearly support these earlier studies, and also suggest that demethylation may have a role in tumor initiation.
However, we also found that the frequency or extent of hypomethylation did not change with tumor type. We found no significant difference in the 5-methylcytosine content of polyps according to well-accepted markers of progression, including size, degree of dysplasia, or percentage villous architecture. Importantly, this analysis included a group of very large adenomas, lesions that were clearly likely to progress to invasive cancer within a short period of time. Likewise, the colorectal cancers in our series included tumors associated with regional and distant metastases, yet these lesions showed no differences in methylation when compared with their less advanced counterparts. The finding that hypomethylation does not increase with tumor progression argues against the possibility that progressive loss of methylation within the genome provides incremental survival advantages for tumor subclones. However, it does not exclude the possibility that demethylation of some specific sequences may facilitate subsequent events important for tumor development, especially where such changes are associated with a functional advantage to the cell, such as demethylation of c-myc. 5
A surprising finding in our study was the extent of demethylation in hyperplastic polyps, lesions often considered to have negligible malignant potential. Increased cell proliferative activity and an upward shift in the proliferative zone is one of the characteristic features of colorectal carcinogenesis. These changes occur in both hyperplastic and adenomatous polyps yet are not present in the normal mucosa of patients with neoplasms. 30,31 For this reason, we postulated that the decreased genomic methylation seen in both polyps and carcinomas relative to normal mucosa may reflect the increased proliferation of these lesions. This hypothesis is supported by our finding in polyps of an inverse relationship between methylation and proliferative rates, as measured by PCNA immunostaining. It is also supported by our finding that the extent of genomic methylation seen in lymphocytes in vitro is inversely related to their rate of proliferation. To date, there are very few studies that have examined the influence of physiological processes such as proliferation, differentiation, and apoptosis on the measured content of methylated DNA. One study has shown that the DNA 5-methylcytosine content is directly related to proliferation of rat hepatocytes, irrespective of whether the proliferation is induced by partial hepatectomy, carcinogen, or mitogen treatment. 32 In patients with ulcerative colitis, Gloria and colleagues 33 proposed that the increased proliferative activity in the rectal mucosa as a result of the active inflammation might be responsible for the observed decrease in DNA hypomethylation.
CpG Island Methylation in Colorectal Neoplasia
It is generally accepted that colorectal cancers with CpG island methylation have a distinct clinicopathological phenotype that in some cases includes microsatellite instability. 11,17 The frequency and patterns of hypermethylation in cancers seen in the current study is consistent with previous reports, and suggests that the randomly selected cancers were representative of the large sporadic tissue bank. Only limited information is available in the literature regarding the methylation status of adenomas and hyperplastic polyps. 17-19 With regard to adenomas, a single study has examined the methylation of MINT 2, 31, and 16 in a series of 108 sporadic polyps collected from 50 patients undergoing endoscopy. 18 The polyps collected in this study were comparable in size and method of collection to the small adenomas in our series. The points of difference between the two studies include the analysis of multiple polyps from an individual patient and the higher proportion of microsatellite instability polyps in the study of Rashid and colleagues 18 (7.5% versus 0% in the current study). The frequency of methylation at MINT 2 was similar between the studies at around 45%; however, the rates of methylation at MINT 31 (9.4%) and p16 (14%) in the current study were lower than reported by Rashid and colleagues 18 (34% and 27%, respectively). In light of these discrepancies the following observations are worthy of comment. Our study has analyzed seven CpG sites and with the exception of MINT 2 we note that the frequency of methylation at a single CpG site in small adenomas is consistently low (5.3 to 14%). Furthermore, methylation at none or one locus is a far more frequent occurrence (75% of lesions) than methylation at many sites. In fact only one small adenoma displayed methylation at five sites, and none demonstrated methylation at six or seven sites. If the process of methylation were important to the progression of adenomatous polyps, we would predict that the large adenomas in our series would display greater methylation than their small counterparts. These adenomas were considerably larger than that studied by Rashid and colleagues, 18 in that they were by definition too large for removal at colonoscopy. Although there was some variation in the frequency of methylation at individual loci we found no evidence to suggest that the propensity for methylation was increased in these large adenomas. Our conclusions from this data are that widespread CpG island methylation is an infrequent occurrence in adenomatous polyps and that methylation at a single locus may simply reflect a random event that does not alter tumor behavior.
This study represents the first examination of methylation in an unselected series of sporadic hyperplastic polyps. Previously, CpG island hypermethylation has been demonstrated in the lesions of hyperplastic polyposis, and in the polyps of individuals with multiple or large hyperplastic polyps. 19 However, it is important to note that these conditions represent a relatively infrequent clinicopathological subset of hyperplastic polyps, possibly with distinctive genetic or epigenetic features. 34-36 It was therefore surprising to find that sporadic hyperplastic polyps, both overall and more particularly those from the right colon, have a higher propensity for CpG island methylation than adenomas of the same size and location. The hyperplastic polyps analyzed in this series were typical of those seen in routine clinical practice in that they were predominantly small, left-sided lesions, mostly from males, and none were associated with a synchronous carcinoma. Given that CpG island methylation is known to occur more commonly in lesions of the right colon and in females, our finding of significantly higher rates of methylation in this unselected population of hyperplastic polyps is all of the more surprising.
The hyperplastic polyps in this study demonstrated a remarkably high rate of methylation of the hMLH1 promoter in the region encompassing bp 801 to 1050 (hMLH1-A, 50%), yet in contrast methylation of region C (1201 to 1450 bp) was only seen in 10% of lesions. One of the two hyperplastic polyps in this study that showed methylation at both regions was also microsatellite unstable, supporting the observations of Furukawa and colleagues 37 that dense methylation of hMLH1 favors the development of microsatellite instability. It is possible that hyperplastic polyps are predisposed to develop at least hemimethylation of hMLH1-A, and that a smaller subset of these polyps develop progressive methylation of this promoter, usually in concert with methylation at other CpG sites. It is also possible that this small subset of hyperplastic polyps with dense and frequent CpG island methylation represents the precursor lesions for hypermethylated colorectal cancers. Importantly, the findings regarding CpG island methylation in hyperplastic polyps supports the concept of a biological continuum between these lesions and a distinctive subset of colorectal carcinomas. 13
In summary our results show that DNA hypomethylation and hypermethylation appear to contribute separately to the process of colorectal carcinogenesis. They also show that both changes precede the development of malignancy and are thus unlikely to be a consequence of the malignant state.
Acknowledgments
We thank Ms. Elisa Mokany and Ms. Emma Quinn for assistance in performing methylation assays and microsatellite testing and the gastroenterologists of the St. Vincent’s Campus for assistance in the collection of polyps.
Footnotes
Address reprint requests to Professor Robyn Ward, Department of Medical Oncology, St. Vincent’s Hospital, Victoria St., Darlinghurst, 2010, Australia. E-mail: r.ward@garvan.unsw.edu.au.
Supported by the St. Vincent’s Clinic Foundation.
C. B. and C. S. contributed equally to this work.
References
- 1.Ehrlich M: DNA methylation in cancer: too much, but also too little. Oncogene 2002, 21:5400-5413 [DOI] [PubMed] [Google Scholar]
- 2.Gama-Sosa MA, Slagel VA, Trewyn RW, Oxenhandler R, Kuo KC, Gehrke CW, Ehrlich M: The 5-methylcytosine content of DNA from human tumors. Nucleic Acids Res 1983, 11:6883-6894 [DOI] [PMC free article] [PubMed] [Google Scholar]
- 3.Feinberg AP, Gehrke CW, Kuo KC, Ehrlich M: Reduced genomic 5-methylcytosine content in human colonic neoplasia. Cancer Res 1988, 48:1159-1161 [PubMed] [Google Scholar]
- 4.Toyota M, Ahuja N, Ohe-Toyota M, Herman JG, Baylin SB, Issa JP: CpG island methylator phenotype in colorectal cancer. Proc Natl Acad Sci USA 1999, 96:8681-8686 [DOI] [PMC free article] [PubMed] [Google Scholar]
- 5.Sharrard RM, Royds JA, Rogers S, Shorthouse AJ: Patterns of methylation of the c-myc gene in human colorectal cancer progression. Br J Cancer 1992, 65:667-672 [DOI] [PMC free article] [PubMed] [Google Scholar]
- 6.Trinh BN, Long TI, Nickel AE, Shibata D, Laird PW: DNA methyltransferase deficiency modifies cancer susceptibility in mice lacking DNA mismatch repair. Mol Cell Biol 2002, 22:2906-2917 [DOI] [PMC free article] [PubMed] [Google Scholar]
- 7.Laird PW, Jackson-Grusby L, Fazeli A, Dickinson SL, Jung WE, Li E, Weinberg RA, Jaenisch R: Suppression of intestinal neoplasia by DNA hypomethylation. Cell 1995, 81:197-205 [DOI] [PubMed] [Google Scholar]
- 8.Veigl ML, Kasturi L, Olechnowicz J, Ma AH, Lutterbaugh JD, Periyasamy S, Li GM, Drummond J, Modrich PL, Sedwick WD, Markowitz SD: Biallelic inactivation of hMLH1 by epigenetic gene silencing, a novel mechanism causing human MSI cancers. Proc Natl Acad Sci USA 1998, 95:8698-8702 [DOI] [PMC free article] [PubMed] [Google Scholar]
- 9.Herman JG, Umar A, Polyak K, Graff JR, Ahuja N, Issa JP, Markowitz S, Willson JK, Hamilton SR, Kinzler KW, Kane MF, Kolodner RD, Vogelstein B, Kunkel TA, Baylin SB: Incidence and functional consequences of hMLH1 promoter hypermethylation in colorectal carcinoma. Proc Natl Acad Sci USA 1998, 95:6870-6875 [DOI] [PMC free article] [PubMed] [Google Scholar]
- 10.Cunningham JM, Christensen ER, Tester DJ, Kim CY, Roche PC, Burgart LJ, Thibodeau SN: Hypermethylation of the hMLH1 promoter in colon cancer with microsatellite instability. Cancer Res 1998, 58:3455-3460 [PubMed] [Google Scholar]
- 11.Hawkins N, Norrie M, Cheong K, Mokany E, Ku SL, Meagher A, O’Connor T, Ward R: CpG island methylation in sporadic colorectal cancers and its relationship to microsatellite instability. Gastroenterology 2002, 122:1376-1387 [DOI] [PubMed] [Google Scholar]
- 12.Jass JR: Serrated route to colorectal cancer: back street or super highway? J Pathol 2001, 193:283-285 [DOI] [PubMed] [Google Scholar]
- 13.Hawkins NJ, Ward RL: Sporadic colorectal cancers with microsatellite instability and their possible origin in hyperplastic polyps and serrated adenomas. J Natl Cancer Inst 2001, 93:1307-1313 [DOI] [PubMed] [Google Scholar]
- 14.Jass JR, Whitehall VL, Young J, Leggett BA: Emerging concepts in colorectal neoplasia. Gastroenterology 2002, 123:862-876 [DOI] [PubMed] [Google Scholar]
- 15.Silverman AL, Park JG, Hamilton SR, Gazdar AF, Luk GD, Baylin SB: Abnormal methylation of the calcitonin gene in human colonic neoplasms. Cancer Res 1989, 49:3468-3473 [PubMed] [Google Scholar]
- 16.Goelz SE, Vogelstein B, Hamilton SR, Feinberg AP: Hypomethylation of DNA from benign and malignant human colon neoplasms. Science 1985, 228:187-190 [DOI] [PubMed] [Google Scholar]
- 17.Toyota M, Ohe-Toyota M, Ahuja N, Issa JP: Distinct genetic profiles in colorectal tumors with or without the CpG island methylator phenotype. Proc Natl Acad Sci USA 2000, 97:710-715 [DOI] [PMC free article] [PubMed] [Google Scholar]
- 18.Rashid A, Shen L, Morris JS, Issa JP, Hamilton SR: CpG island methylation in colorectal adenomas. Am J Pathol 2001, 159:1129-1135 [DOI] [PMC free article] [PubMed] [Google Scholar]
- 19.Chan AO, Issa JP, Morris JS, Hamilton SR, Rashid A: Concordant CpG island methylation in hyperplastic polyposis. Am J Pathol 2002, 160:529-536 [DOI] [PMC free article] [PubMed] [Google Scholar]
- 20.Ward R, Meagher A, Tomlinson I, O’Connor T, Norrie M, Wu R, Hawkins N: Microsatellite instability and the clinicopathological features of sporadic colorectal cancer. Gut 2001, 48:821-829 [DOI] [PMC free article] [PubMed] [Google Scholar]
- 21.Deng G, Chen A, Hong J, Chae HS, Kim YS: Methylation of CpG in a small region of the hMLH1 promoter invariably correlates with the absence of gene expression. Cancer Res 1999, 59:2029-2033 [PubMed] [Google Scholar]
- 22.De Smet C, De Backer O, Faraoni I, Lurquin C, Brasseur F, Boon T: The activation of human gene MAGE-1 in tumor cells is correlated with genome-wide demethylation. Proc Natl Acad Sci USA 1996, 93:7149-7153 [DOI] [PMC free article] [PubMed] [Google Scholar]
- 23.Narayan A, Ji W, Zhang XY, Marrogi A, Graff JR, Baylin SB, Ehrlich M: Hypomethylation of pericentromeric DNA in breast adenocarcinomas. Int J Cancer 1998, 77:833-838 [DOI] [PubMed] [Google Scholar]
- 24.Ehrlich M, Jiang G, Fiala E, Dome JS, Yu MC, Long TI, Youn B, Sohn OS, Widschwendter M, Tomlinson GE, Chintagumpala M, Champagne M, Parham D, Liang G, Malik K, Laird PW: Hypomethylation and hypermethylation of DNA in Wilms tumors. Oncogene 2002, 21:6694-6702 [DOI] [PubMed] [Google Scholar]
- 25.Tran R, Kashmiri SV, Kantor J, Greiner JW, Pestka S, Shively JE, Schlom J: Correlation of DNA hypomethylation with expression of carcinoembryonic antigen in human colon carcinoma cells. Cancer Res 1988, 48:5674-5679 [PubMed] [Google Scholar]
- 26.Hernandez-Blazquez FJ, Habib M, Dumollard JM, Barthelemy C, Benchaib M, de Capoa A, Niveleau A: Evaluation of global DNA hypomethylation in human colon cancer tissues by immunohistochemistry and image analysis. Gut 2000, 47:689-693 [DOI] [PMC free article] [PubMed] [Google Scholar]
- 27.Wigler M, Levy D, Perucho M: The somatic replication of DNA methylation. Cell 1981, 24:33-40 [DOI] [PubMed] [Google Scholar]
- 28.Pogribny I, Yi P, James SJ: A sensitive new method for rapid detection of abnormal methylation patterns in global DNA and within CpG islands. Biochem Biophys Res Commun 1999, 262:624-628 [DOI] [PubMed] [Google Scholar]
- 29.Paz MF, Avila S, Fraga MF, Pollan M, Capella G, Peinado MA, Sanchez-Cespedes M, Herman JG, Esteller M: Germ-line variants in methyl-group metabolism genes and susceptibility to DNA methylation in normal tissues and human primary tumors. Cancer Res 2002, 62:4519-4524 [PubMed] [Google Scholar]
- 30.Shpitz B, Bomstein Y, Mekori Y, Cohen R, Kaufman Z, Grankin M, Bernheim J: Proliferating cell nuclear antigen as a marker of cell kinetics in aberrant crypt foci, hyperplastic polyps, adenomas, and adenocarcinomas of the human colon. Am J Surg 1997, 174:425-430 [DOI] [PubMed] [Google Scholar]
- 31.Wong WM, Mandir N, Goodlad RA, Wong BC, Garcia SB, Lam SK, Wright NA: Histogenesis of human colorectal adenomas and hyperplastic polyps: the role of cell proliferation and crypt fission. Gut 2002, 50:212-217 [DOI] [PMC free article] [PubMed] [Google Scholar]
- 32.Kanduc D, Rossiello MR, Aresta A, Cavazza C, Quagliariello E, Farber E: Transitory DNA hypomethylation during liver cell proliferation induced by a single dose of lead nitrate. Arch Biochem Biophys 1991, 286:212-216 [DOI] [PubMed] [Google Scholar]
- 33.Gloria L, Cravo M, Pinto A, de Sousa LS, Chaves P, Leitao CN, Quina M, Mira FC, Soares J: DNA hypomethylation and proliferative activity are increased in the rectal mucosa of patients with long-standing ulcerative colitis. Cancer 1996, 78:2300-2306 [DOI] [PubMed] [Google Scholar]
- 34.Williams GT, Arthur JF, Bussey HJ, Morson BC: Metaplastic polyps and polyposis of the colorectum. Histopathology 1980, 4:155-170 [DOI] [PubMed] [Google Scholar]
- 35.Jeevaratnam P, Cottier DS, Browett PJ, Van De Water NS, Pokos V, Jass JR: Familial giant hyperplastic polyposis predisposing to colorectal cancer: a new hereditary bowel cancer syndrome. J Pathol 1996, 179:20-25 [DOI] [PubMed] [Google Scholar]
- 36.Jorgensen H, Mogensen AM, Svendsen LB: Hyperplastic polyposis of the large bowel. Three cases and a review of the literature. Scand J Gastroenterol 1996, 31:825-830 [DOI] [PubMed] [Google Scholar]
- 37.Furukawa T, Konishi F, Masubuchi S, Shitoh K, Nagai H, Tsukamoto T: Densely methylated MLH1 promoter correlates with decreased mRNA expression in sporadic colorectal cancers. Genes Chromosom Cancer 2002, 35:1-10 [DOI] [PubMed] [Google Scholar]