

Abstract
We have used intramolecular cross-linking, MS, and sequence threading to rapidly identify the fold of a model protein, bovine basic fibroblast growth factor (FGF)-2. Its tertiary structure was probed with a lysine-specific cross-linking agent, bis(sulfosuccinimidyl) suberate (BS3). Sites of cross-linking were determined by tryptic peptide mapping by using time-of-flight MS. Eighteen unique intramolecular lysine (Lys-Lys) cross-links were identified. The assignments for eight cross-linked peptides were confirmed by using post source decay MS. The interatomic distance constraints were all consistent with the tertiary structure of FGF-2. These relatively few constraints, in conjunction with threading, correctly identified FGF-2 as a member of the β-trefoil fold family. To further demonstrate utility, we used the top-scoring homolog, IL-1β, to build an FGF-2 homology model with a backbone error of 4.8 Å (rms deviation). This method is fast, is general, uses small amounts of material, and is amenable to automation.
In recent years, the number of novel proteins identified by genomic (1, 2) and proteomic projects has dramatically increased, with a concomitant need for more rapid determination of their tertiary structures.
Visualization of the three-dimensional structures of proteins has traditionally been realized by x-ray crystallography and NMR. These techniques produce high resolution atomic data but require relatively large amounts (10 to 100 mg) of pure analyte in a particular solution or crystalline state. Even if these conditions are met, it can take months or even years to generate a molecular structure by following these methodologies.
To develop an alternative approach to structure determination that could keep pace with the rate of novel protein identification, we have re-examined cross-linking technology in the light of newer analytical protocols for the separation and identification of complex peptide mixtures. Previous investigators have shown that cross-linking experiments can provide low resolution interatomic distance information (3). In theory, given enough distance information, it is possible to solve the tertiary structure of a macromolecule (4, 5).
The challenge we faced in trying to generate such information in a short time using cross-linking technology was to devise a rapid method for identifying cross-linked residues. MS affords high throughput but has rarely been used for the identification of cross-links. One study has been published where disuccinimidyl ester cross-linking, Edman sequencing, and MS were used to validate a model of human erythropoietin (6). Recent advances in MS (7, 8) gave us the means whereby we could determine the masses and sequences of large peptides with high accuracy and sensitivity (9, 10). These improvements make it feasible to analyze complex peptide mixtures from proteolytically digested, cross-linked proteins (11) very quickly. Specifically, we describe the use of chemical cross-linking and time-of-flight (TOF) MS to identify Lys-Lys cross-links. We also show how these cross-links can be used to identify the fold of a protein and to aid in the construction of a homology model. As a model protein, we used basic fibroblast growth factor (FGF)-2, a molecule for which both NMR (Protein Data Bank ID 1BLA) and crystallographic structures (Protein Data Bank ID 4FGF) are available (12–14).
Materials and Methods
Cross-Linking of FGF-2.
The amine-specific homobifunctional cross-linker bis(sulfosuccinimidyl) suberate (BS3; Pierce) was used to cross-link Lys residues in FGF-2 according to the following protocol. FGF-2 was dialyzed overnight into reaction buffer (100 mM Hepes, pH 7.5/1 M NaCl/1 mM EDTA), diluted to 5 μM in reaction buffer containing 10 mM DTT, and reacted with a 20-molar excess of freshly prepared BS3 solution (5 mM citrate, pH 5.0/10 mM BS3). Each reaction mixture was incubated up to 24 h at room temperature and quenched with 1 M Tris⋅HCl at pH 8.0 to a final concentration of 10 mM. Free cysteines were then modified with 50 mM iodoacetamide.
Purification of Monomeric FGF-2.
Monomeric, cross-linked FGF-2 was separated from cross-linked dimers by size-exclusion chromatography (SEC) by using a Gilson HPLC system equipped with a TosoHass (Montgomeryville, PA) G2000 (2.0 × 60 cm) or two Bio-Sil SEC 125-5 (0.78 × 30 cm) columns (Bio-Rad) equilibrated with 100 mM ammonium bicarbonate (pH 7.0) and eluted at 1 ml/min. Fractions were concentrated 20-fold with Centricon 10 filtration (Amicon).
Proteolytic Digestion, HPLC Separation, and MS.
Trypsin digestion of FGF-2 proceeded at 37°C with a trypsin/protein ratio of 1:20 (wt/wt). After 16 h, another aliquot of trypsin was added, and digestion continued for 2 h. The enzymatic digestion was quenched with PMSF. The tryptic hydrolysate, consisting of both unmodified and modified peptides, was separated by reversed-phase HPLC. For off-line analysis, a MicroPro HPLC system (Eldex, Napa, CA) equipped with a MAGIC MS C18 column (0.2 × 50 mm) (Michrom BioResources, Auburn, CA) or a Fusica II C18 reversed-phase column (0.3 × 150 mm) (LC Packing, San Francisco, CA) was used. Peptides were eluted at a flow rate of 1–5 μl/min by using a gradient of 10–90% B in 60 min, where solvent A consisted of 0.1% trifluoroacetic acid (TFA) in water and solvent B consisted of 0.08% TFA in 70% acetonitrile. Eluate was monitored at 210 nm (0.2 absorbance unit full scale) with an ABI 785A absorbance detector (Applied Biosystems), and fractions were collected. A 1-μl aliquot of each HPLC fraction was mixed with 33 mM α-cyano-4-hydroxycinnamic acid in acetonitrile/methanol (1/1; vol/vol) and air-dried on a gold-plated matrix-assisted laser desorption (MALDI) target. Mass spectra were acquired on a Voyager DE-STR MALDI TOF instrument in positive ion mode (PerSeptive Biosystems, Framingham, MA). For on-line HPLC analysis using an electrospray ionization (ESI)-TOF, the tryptic digest was separated on an ABI 140B solvent delivery system (Applied Biosystems) equipped with a Vydac (Hesperia, CA) C18 (1 × 150 mm). The column was eluted at 50 μl/min by using a gradient of 10–60% B in 70 min, where solvent A consisted of 0.1% formic acid in H2O and solvent B consisted of 0.05% formic acid in ethanol/l-propanol (5/2; vol/vol). Mass spectra were acquired after 10:1 flow-splitting on a Mariner ESI-TOF mass spectrometer (PerSeptive Biosystems). Mass accuracies of ≤100 ppm were obtained with external calibration and of ≤50 ppm for MALDI-TOF with internal calibration.
MALDI-Post-Source Decay (PSD).
The identities of the cross-links were confirmed by using MALDI-PSD. Ions arising from putative cross-links were selectively gated into the drift region of the mass spectrometer. The decay products of these ions were then focused through a set of reflectron lenses whose voltages were reduced in 9–11 steps, each one 75% of the previous step. Mass calibration was performed by using fragment ions from adrenocorticotropic hormone (ACTH) residues 18–39.
Mass Spectrum Assignment.
The Automated Spectrum Assignment Program (asap), developed at the University of California at San Francisco, requires a SwissProt sequence file, an MS peak list, cross-linker molecular weight and chemical information, a mass error limit, proteolytic enzyme, maximum charge state, and a peak abundance threshold. asap constructs a proteolytic peptide virtual library that is indexed by both isotopic and average mass. For each m/z value, asap searches the library for masses within the error limit, which in this case is ±50 or ±100 ppm. If no match is found, asap searches combinatorially for cross-linkable peptide pairs with masses within the error limit. asap lists all plausible assignments for each mass peak. Only uniquely assignable mass peaks were reported.
Results
A summary of the experimental design is shown in Fig. 1. The amine groups of Lys and the N terminus react with the homobifunctional cross-linker BS3, producing either single residue modifications (+C8H12O3) or interresidue cross-links (+C8H10O2). Under the cross-linking conditions used, approximately one Lys-Lys cross-link per protein molecule was observed (data not shown), a level that is unlikely to distort tertiary structure (6). Masses of tryptic peptides derived from FGF-2, including unmodified, modified, and cross-linked, were assigned from the mass spectra by using asap. Trypsin, which normally cleaves at lysines and arginines, will not cleave at BS3-modified lysines, aiding in the identification of cross-linked peptides.
Figure 1.
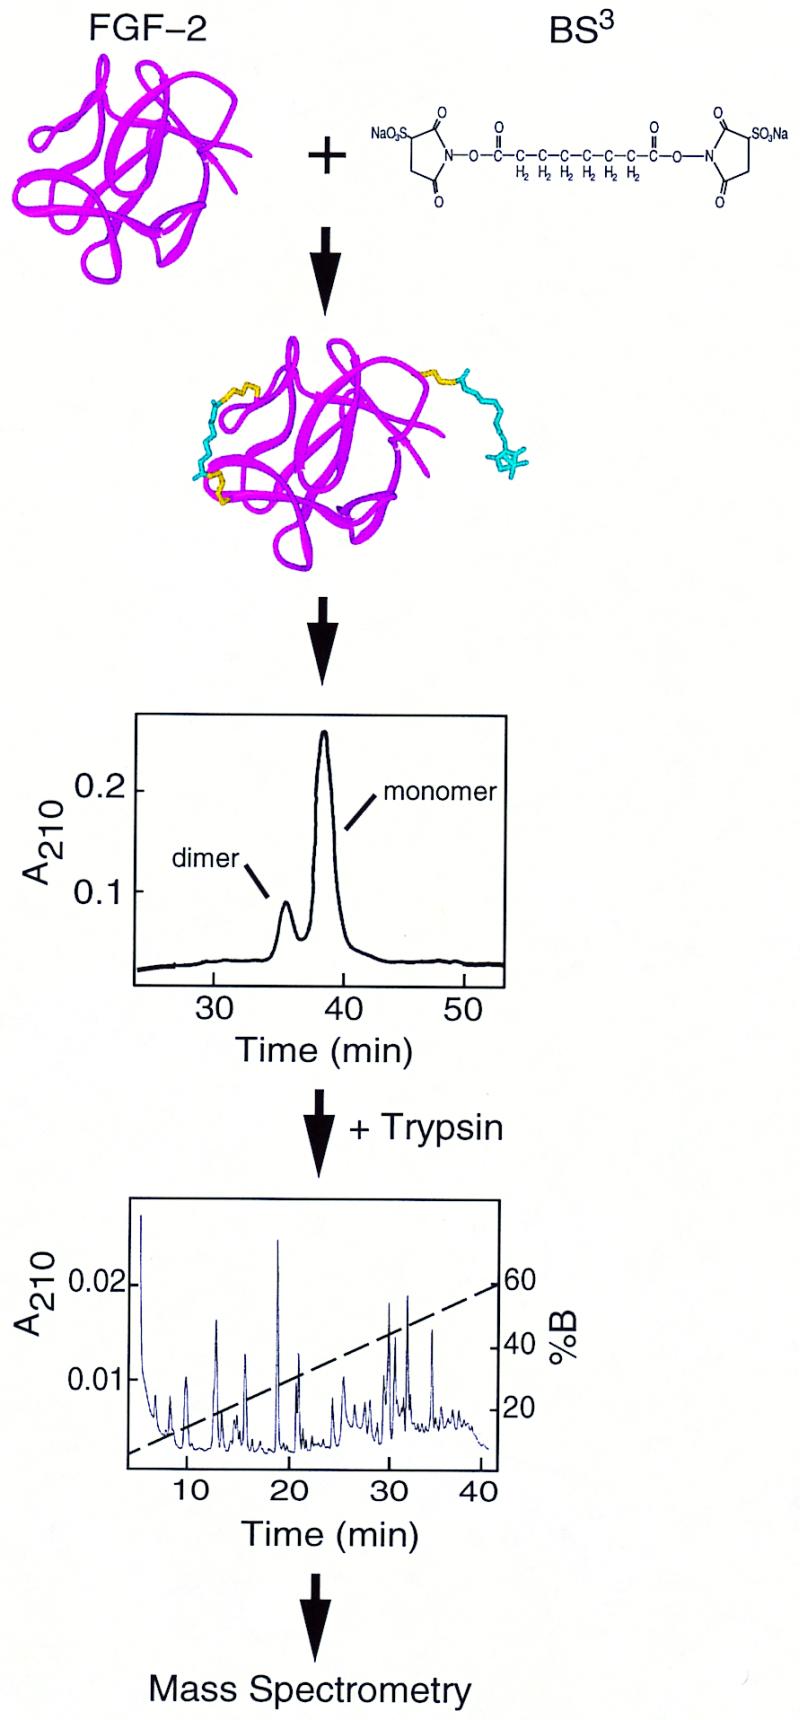
Experimental Design. (Top) Cross-linking of FGF-2. (Middle) Purification of monomeric FGF-2. (Bottom) Proteolytic digestion, HPLC separation, and mass spectrometry.
Eighteen masses corresponding to cross-linked peptides are listed in Table 1. For example (Fig. 2A), the peak at m/z 2059 was assigned as the single peptide E45-R60, cross-linked through internal lysines 46 and 52. The peak at m/z 2465 was assigned as a cross-link between lysines 26 and 46 in peptides L23–R33 and E45–K52. These two assignments, along with those made for six additional cross-linked peptides, were confirmed by MALDI-PSD of the parent ions (Fig. 2 B and C), which contained immonium ions (+NH2⩵CHR) and sequence information consistent with the expected peptides and cross-link position (Table 1).
Table 1.
BS3 Cross-linked tryptic peptides from FGF-2
| Lys-Lys cross-link | Cross-linked peptide(s) | Observed M + H+ | Error, ppm |
|---|---|---|---|
| 21–26 | 19–33 | 1952.09 | 39 |
| 21–125 | 19–26, 121–129 | 2151.27 | 45 |
| 21–135 | 19–22, 130–145 | 2327.30* | 3 |
| 26–46 | 23–33, 45–52 | 2465.25* | 2 |
| 46–52 | 45–60 | 2059.08* | 1 |
| 46–119 | 40–52, 111–120 | 2889.41 | 12 |
| 46–125 | 40–52, 120–129 | 2764.48 | 13 |
| 46–145 | 45–52, 136–146 | 2267.24 | 0 |
| 77–86 | 67–97 | 3839.79 | 5 |
| 77–110 | 73–81, 110–119 | 2463.32 | 22 |
| 77–119 | 73–81, 111–120 | 2508.24 | 1 |
| 77–125 | 73–86, 121–129 | 2739.47* | 2 |
| 77–135 | 73–81, 130–145 | 2894.41 | 41 |
| 110–119 | 110–125 | 2116.08* | 20 |
| 110–135 | 110–119, 130–145 | 3056.61 | 17 |
| 119–125 | 111–120, 121–129 | 2401.26*† | 18 |
| 119–129 | 111–120, 126–135 | 2392.37*† | 25 |
| 125–129 | 121–135 | 1697.92* | 0 |
MALDI-PSD spectra were obtained for these peaks.
† Mass calibrations were made with internal calibrations using previously identified unmodified tryptic peptides.
Figure 2.

Mass spectrometry. (A) MALDI-TOF spectrum from tryptic digest of BS3 cross-linked FGF-2. Cross-linked peptides are identified by using the program asap and are denoted with an asterisk (9). (B) MALDI-PSD spectrum of cross-linked peptide E45–R60 (M + H+ = m/z 2059.08). (C) MALDI-PSD spectrum of cross-linked peptides L23–R33 and E45–K52 (M + H+ = m/z 2465.25). Fragments from peptide L23–R33 are labeled with an α subscript; those from peptide E45–K52 with a β subscript. Fragments due to amide bond cleavages (b-ions, y-ions, and immonium ions) are labeled according to their single letter abbreviations. The most abundant fragments arose from cleavages at cross-linked lysines and aspartic acid. Peaks at m/z 696 and 1771 correspond to fragmentation at y6β and/or y6α, and b2β and/or b5α, respectively.
Of the total of 18 cross-links identified, 3 (cross-linked peptides 46–52, 119–125, and 125–129) were within 7 amino acids of each other in the FGF sequence. Because BS3 conjugated to two lysines can span up to 7 amino acids (the total span is ≈24 Å), these 3 cross-links provided little or no three-dimensional structure information. The remaining 15 cross-links provided new and very valuable throughspace distance information (Fig. 3). It is this type of throughspace distance constraint that is the key to determining the fold of a protein.
Figure 3.

The 15 nonlocal throughspace distance constraints generated by the chemical cross-links (yellow dashed lines) superimposed on the average NMR structure of FGF-2 (1BLA). The 14 lysines of FGF-2 are shown in red.
Protein fold identification was carried out in a two step process. First, we used sequence threading (program 123D, ref. 15) of FGF-2 (FGF2_BOVIN) to find the best 20 structural models out of a database of 635 proteins sharing <30% sequence identity (16). Three β-trefoil proteins are ranked 1st (FGF-2: 4FGF), 5th (IL-1β: 1I1B), and 12th (hisactophilin: 1HCE). Second, we reranked the models by their agreement with the 18 cross-link-derived distance constraints (Table 2). The threading models were scored by using the equation:
 |
where n is the number of constraints; di is the Cα–Cα distance in the model for the two residues in constraint i; and d0 is 24 Å, the maximum Cα–Cα throughspace distance between BS3-cross-linked lysines. Two models were discarded that had >50% of the constraints undefined because of unresolved structural regions or gaps in the sequence alignment (2PHY, 2PLDA). The three β-trefoil proteins are now ranked 1st, 2nd, and 4th.
Table 2.
Top 20 threading models ranked by constraint error
| Name | Fold family | % Sequence identity | Threading rank | Constraint error, Å* | Number of violations† |
|---|---|---|---|---|---|
| FGF-2 | β-Trefoil | 98.6 | 1 | 0.0 | 0 |
| IL-1β | β-Trefoil | 12.7 | 5 | 0.0 | 0 |
| Gastrotropin | Lipocalin | 7.1 | 8 | 2.9 | 1 |
| Hisactophilin | β-Trefoil | 8.6 | 12 | 5.5 | 2 |
| Guanylate kinase | P-loop | 12.4 | 9 | 7.4 | 4 |
| NTP pyrophosphohydrolase | NTP pyrophosphohydrolase | 9.3 | 6 | 14.5 | 3 |
| Glutathione peroxidase | Thioredoxin | 11.1 | 14 | 16.6 | 5 |
| Retinol-binding protein | Lipocalin | 9.1 | 18 | 17.1 | 3 |
| Nucleoside diphosphokinase | Ferridoxin-like | 8.8 | 20 | 18.6 | 2 |
| Cytochrome c4 | Cytochrome c | 12.6 | 11 | 21.4 | 5 |
| Aspartate carbamoyltransferase | Ferridoxin-like | 9.8 | 13 | 22.6 | 4 |
| D-UTPase | β-Clip | 7.8 | 2 | 27.5 | 7 |
| Disulfide bond formation protein | Thioredoxin | 8.4 | 15 | 28.1 | 8 |
| ASV integrase | Ribonuclease H-like | 7.8 | 19 | 28.6 | 5 |
| Endoglucanase C | Galactose binding | 11.6 | 4 | 33.8 | 6 |
| TATA-box-binding protein | TATA-box-binding protein-like | 10.3 | 7 | 40.0 | 8 |
| Phospholipase A2 | Phospholipase A2 | 9.5 | 16 | 55.4 | 7 |
| PRD paired domain | 3-Helix bundle | 12.7 | 17 | 143.4 | 8 |
Two models, 2PLDA (3) and 2PHY (10), had <50% of the distance constraints defined and were subsequently removed from the analysis. Undefined constraints resulted from lysines paired to gaps or unresolved regions in the model structure.
Constraint error is the extent of model violation of the cross-link-derived distance constraints, as defined by Eq. 1.
† Number of violations is the number of experimentally derived constraints violated by the model (i.e., the number of cross-linked Lys-Lys Cα distances > 24 Å).
FGF-2 is clearly identified as a member of the β-trefoil family and is correctly predicted to share the same fold as IL-1β even though their sequence identity is <13%. Like the β-trefoils, gastrotropin (1EAL), ranking third, has a β-barrel fold with a meander motif (17) and is partially alignable to FGF-2 by using the program dali (18). Without the distance constraints, the threading algorithm would suggest that FGF-2 belongs to the unrelated β-clip fold family (D-UTPase).
Given the robust identification of FGF-2 as a β-trefoil, we built a homology model based on IL-1β and the threading alignment (Fig. 4). In the model, the core β-strands are positioned correctly. Sequence alignment and modeling errors occur mainly in the loop regions (19) and the 20 N-terminal amino acids. The backbone rms deviation of the model to the FGF-2 average NMR structure (1BLA) is 4.8 Å over 101 residues (14).
Figure 4.

FGF-2 homology model based on IL-1β (cyan) aligned to the NMR structure (white) of FGF-2. Insertions of FGF-2 relative to IL-1β were not modeled. Structural gaps were closed with 100 steps of energy minimization by using Tripos (St. Louis) sybyl 6.4. The backbone rms deviation is 4.8 Å over 101 residues.
Discussion
The determination of the three-dimensional structure of a molecule can be represented as a problem in obtaining sufficient information, in the form of distance constraints, to fix the positions of the atoms or residues to a certain accuracy, or resolution (4). The number and precision of the constraints define the types of structural questions that can be answered. At one extreme, the placement of a pair of rigid domains with respect to each other (6 degrees of freedom) can be carried out with as few as three constraints per domain (20, 21). At the other, the determination of a macromolecular structure to residue resolution, using strictly distance constraints, would require ca. 3N constraints, where N is the number of residues. The work reported here shows that assigning the tertiary fold of a protein domain can be accomplished with few constraints (approximately N/10) if the fold of interest has been previously observed.
FGF-2 proved a good choice for the initial study because it contains a high concentration of dispersed lysine residues and is a member of a well-catalogued fold family. For proteins with lower lysine content, or in cases where more distance information is needed, additional cross-linkers could be used. Because the number of easily modified (i.e., polar) surface-exposed residues in a typical protein greatly exceeds N/10 (22), this number of identifiable cross-links should be readily achievable. There are commercially available cross-linkers that react specifically with other polar groups besides lysine, have different spacer arm lengths, or have different flexibility. Alternatively, nonspecific homo- or heterobifunctional photocross-linkers can be used. This methodology as implemented has another dependency besides the requirement that ≈N/10 constraints be generated; the scoring function of the threading algorithm must be able to select a set of plausible models where one has the correct fold. A threading-based approach, in turn, requires that the correct fold has at least one representative in the sequence-unique structural database. For sequences for which cross-linking data are inconsistent with all threading models in the sequence-unique structural database, one might explore de novo structure prediction methods to construct models consistent with distance constraint information (23–28). By using simulated data sets, such methods have been shown to generate low resolution structures with, again, N/10 distance constraints (29).
Once the general methodologies were developed, the distance constraints used in this study were derived from three experiments, each taking a week and using approximately 100 μg of protein. Given that commercial purification/protease mapping HPLC workstations are available, the time needed to perform an experiment could be reduced to 2 days, and the amount of protein required to less than 10 μg. Throughput can be significantly increased by performing experiments in parallel by using automated systems to perform multiple experiments simultaneously. The purity of the protein analyte is not critical, because the only peaks of interest are those consistent with cross-linked peptides of known sequence. Therefore, by using a standard baculovirus expression system for a His-tagged protein, the necessary amount of protein at the required purity could be prepared in 2 days. By using the methodology we have described here, and with high throughput systems in place, we estimate the time to determine the fold family of a protein to be on the order of 1 week.
Our studies show that it is feasible to obtain multiple cross-links per experiment and that even a small number of distance constraints can assist in the determination of a protein structure. Protein models constructed by using this technique may provide sufficient resolution to assist in elucidating function, macromolecular interactions, and multiple conformational states, as well as in the design of protein mimetics. This method should be broadly applicable to the field of structure determination. It is many times faster than the current standard techniques, it can be performed on much less material, automation is eminently possible, and the means already exist to apply it more generally in the field of protein structure analysis.
Acknowledgments
We thank C. Brown, C. Berman, and J. Yang, who helped develop the cross-linking methodologies. We also thank the University of California, San Francisco, Mass Spectrometry Facility (RR01614) for providing us with MS resources, and K. Brameld, K. A. Dill, C. Craik, and D. Agard for critical reading of the manuscript. M.M.Y. was supported by National Institutes of Health (NIH) Biotechnology Training Grant GM08388. Work in the B.W.G. laboratory was supported by NIH Grant AI31254. Work in the I.D.K. laboratory was supported by NIH Grant GM31497.
Abbreviations
- TOF
time-of-flight
- FGF
fibroblast growth factor
- BS3
bis(sulfosuccinimidyl) suberate
- MALDI
matrix-assisted laser desorption
- PSD
post-source decay
Footnotes
Article published online before print: Proc. Natl. Acad. Sci. USA, 10.1073/pnas.090099097.
Article and publication date are at www.pnas.org/cgi/doi/10.1073/pnas.090099097
References
- 1.Benson D A, Boguski M S, Lipman D J, Ostell J, Ouellette B F, Rapp B A, Wheeler D L. Nucleic Acids Res. 1999;27:7–12. doi: 10.1093/nar/27.1.12. [DOI] [PMC free article] [PubMed] [Google Scholar]
- 2.Stoesser G, Tuli M A, Lopez R, Sterk P. Nucleic Acids Res. 1999;27:18–24. doi: 10.1093/nar/27.1.18. [DOI] [PMC free article] [PubMed] [Google Scholar]
- 3.Lutter L C, Kurland C G. Mol Cell Biochem. 1975;30:105–116. doi: 10.1007/BF01792077. [DOI] [PubMed] [Google Scholar]
- 4.Havel T F, Crippen G M, Kuntz I D. Biopolymers. 1979;18:73–81. [Google Scholar]
- 5.Cohen F E, Sternberg M J. J Mol Biol. 1980;137:9–22. doi: 10.1016/0022-2836(80)90154-0. [DOI] [PubMed] [Google Scholar]
- 6.Haniu M, Narhi L O, Arakawa T, Elliott S, Rohde M F. Protein Sci. 1993;2:1441–1451. doi: 10.1002/pro.5560020908. [DOI] [PMC free article] [PubMed] [Google Scholar]
- 7.Fenn J B, Mann M, Meng C K, Wong S F, Whitehouse C M. Science. 1989;46:64–71. doi: 10.1126/science.2675315. [DOI] [PubMed] [Google Scholar]
- 8.Wang R, Chait B T. Curr Opin Biotechnol. 1994;5:77–84. doi: 10.1016/s0958-1669(05)80074-6. [DOI] [PubMed] [Google Scholar]
- 9.Kaufmann R, Spengler B, Lutzenkirchen F. Rapid Commun Mass Spectrom. 1993;7:902–910. doi: 10.1002/rcm.1290071010. [DOI] [PubMed] [Google Scholar]
- 10.Qin J, Chait B T. Anal Chem. 1996;68:2108–2112. doi: 10.1021/ac951163m. [DOI] [PubMed] [Google Scholar]
- 11.McLafferty F W, Fridriksson E K, Horn D M, Lewis M A, Zubarev R A. Science. 1999;284:1289–1290. doi: 10.1126/science.284.5418.1289. [DOI] [PubMed] [Google Scholar]
- 12.Eriksson A E, Cousins L S, Weaver L H, Matthews B W. Proc Natl Acad Sci USA. 1991;88:3441–3445. doi: 10.1073/pnas.88.8.3441. [DOI] [PMC free article] [PubMed] [Google Scholar]
- 13.Eriksson A E, Cousins L S, Matthews B W. Protein Sci. 1993;2:1274–1284. doi: 10.1002/pro.5560020810. [DOI] [PMC free article] [PubMed] [Google Scholar]
- 14.Moy F J, Seddon A P, Campbell E B, Bohlen P, Powers R. Biochemistry. 1996;35:13552–13561. doi: 10.1021/bi961260p. [DOI] [PubMed] [Google Scholar]
- 15.Alexandrov N N, Nussinov R, Zimmer R M. Pac. Symp. Biocomput. 1996. 53–72. [PubMed] [Google Scholar]
- 16.Hobohm U, Sander C. Protein Sci. 1994;3:522–524. doi: 10.1002/pro.5560030317. [DOI] [PMC free article] [PubMed] [Google Scholar]
- 17.Murzin A G, Brenner S E, Hubbard T, Chothia C. J Mol Biol. 1995;247:536–540. doi: 10.1006/jmbi.1995.0159. [DOI] [PubMed] [Google Scholar]
- 18.Holm L, Sander C. J Mol Biol. 1993;233:123–138. doi: 10.1006/jmbi.1993.1489. [DOI] [PubMed] [Google Scholar]
- 19.Hilbert M, Bohm G, Jaenicke R. Proteins. 1993;17:138–151. doi: 10.1002/prot.340170204. [DOI] [PubMed] [Google Scholar]
- 20.Rossi V, Gaboriaud C, Lacroix M, Ulrich J, Fontecilla-Camps J C, Gagnon J, Arlaud G J. Biochemistry. 1995;34:7311–7321. doi: 10.1021/bi00022a004. [DOI] [PubMed] [Google Scholar]
- 21.Lacroix M, Rossi V, Gaboriaud C, Chevallier S, Jaquinod M, Thielens N M, Gagnon J, Arlaud G J. Biochemistry. 1997;36:6270–6282. doi: 10.1021/bi962719i. [DOI] [PubMed] [Google Scholar]
- 22.Baud F, Karlin S. Proc Natl Acad Sci USA. 1999;96:12494–12499. doi: 10.1073/pnas.96.22.12494. [DOI] [PMC free article] [PubMed] [Google Scholar]
- 23.Smith-Brown M J, Kominos D, Levy R M. Protein Eng. 1993;6:605–614. doi: 10.1093/protein/6.6.605. [DOI] [PubMed] [Google Scholar]
- 24.Aszodi A, Gradwell M J, Taylor W R. J Mol Biol. 1995;251:308–326. doi: 10.1006/jmbi.1995.0436. [DOI] [PubMed] [Google Scholar]
- 25.Skolnick J, Kolinski A, Ortiz A R. J Mol Biol. 1997;265:217–241. doi: 10.1006/jmbi.1996.0720. [DOI] [PubMed] [Google Scholar]
- 26.Havel T F, Wuthrich K. J Mol Biol. 1985;182:281–294. doi: 10.1016/0022-2836(85)90346-8. [DOI] [PubMed] [Google Scholar]
- 27.Guntert P, Braun W, Wuthrich K. J Mol Biol. 1991;217:517–530. doi: 10.1016/0022-2836(91)90754-t. [DOI] [PubMed] [Google Scholar]
- 28.Simons K T, Ruczinski I, Kooperberg C, Fox B A, Bystroff C, Baker D. Proteins. 1999;34:82–95. doi: 10.1002/(sici)1097-0134(19990101)34:1<82::aid-prot7>3.0.co;2-a. [DOI] [PubMed] [Google Scholar]
- 29.Debe D A, Carlson M J, Sadanobu J, Chan S I, Goddard W A. J Phys Chem. 1999;103:3001–3008. [Google Scholar]