Abstract
We propose a mechanism, based on a ≥10-μs molecular dynamics simulation, for the surprising misfolding of hen egg-white lysozyme caused by a single mutation (W62G). Our simulations of the wild-type and mutant lysozymes in 8 M urea solution at biological temperature (with both pH 2 and 7) reveal that the mutant structure is much less stable than that of the wild type, with the mutant showing larger fluctuations and less native-like contacts. Analysis of local contacts reveals that the Trp-62 residue is the key to a cooperative long-range interaction within the wild type, where it acts like a bridge between two neighboring basic residues. Thus, a native-like cluster or nucleation site can form near these residues in the wild type but not in the mutant. The time evolution of the secondary structure also exhibits a quicker loss of the β-sheets in the mutant than in the wild type, whereas some of the α-helices persist during the entire simulation in both the wild type and the mutant in 8 M urea (even though the tertiary structures are basically all gone). These findings, while supporting the general conclusions of a recent experimental study by Dobson and coworkers [Klein-Seetharam J, Oikama M, Grimshaw SB, Wirmer J, Duchardt E, Ueda T, Imoto T, Smith LJ, Dobson CM, Schwalbe H (2002) Science 295:1719–1722], provide a detailed but different molecular picture of the misfolding mechanism.
Keywords: misfolding, mutation effect, chemical denaturing, high-performance computing
When a single hydrophobic residue in a native protein is mutated to a less hydrophobic residue and the protein misfolds, it is clear that the residue is located at a critical position in the sequence. Such is the case for the hen egg-white lysozyme as recently investigated by Dobson and coworkers (1–3), who showed that a single mutation, W62G, can cause the protein to misfold and subsequently aggregate into amyloid plaques. The most striking finding is that this mutation-site Trp-62 is on the surface of the native protein, not in the hydrophobic core. It has been conjectured that this behavior is due to the loss of key “long-range hydrophobic interactions” (2). How can this Trp-62 residue play a key role in a long-range hydrophobic interaction during the folding process and then shift to the surface for functional reasons? Given the importance of this phenomenon, it is of great interest to investigate this further, with the goal of arriving at a clear molecular picture of the mechanism. We show it is not caused by hydrophobicity alone.
We have performed molecular dynamics (MD) simulations to elucidate the mechanism by which this mutation induces misfolding and to explain why this mutation has such a surprising destabilizing effect on the tertiary structure of the protein. Our basic approach, as suggested by the experiments of Dobson and coworkers (1–3), is to simulate unfolding in wild and mutated lysozymes in an 8 M aqueous solution of the denaturant urea. The lysozyme system studied here proves to be an excellent example of how a single mutation can destabilize a native structure.
Aside from being a fundamentally interesting problem, misfolding and aggregation of proteins have been implicated in many fatal diseases such as Alzheimer's disease and mad cow disease and, as such, are the subject of great interest in molecular biology (1–13). Many researchers have suggested that misfolded β-amyloid peptides play a crucial role in such diseases (1–3). When β-amyloid peptides misfold, they may accumulate into fibrils and plaques. However, recent experiments pioneered by Dobson and coworkers (1–4) have shown that amyloids and fibrils can be formed from almost any protein given the appropriate conditions, and lysozyme is a good example. This finding indicates that there are many other examples of mutation-induced misfolding, the exploration of which could yield insights into the mechanism of diseases caused by protein misfolding.
Results and Discussion
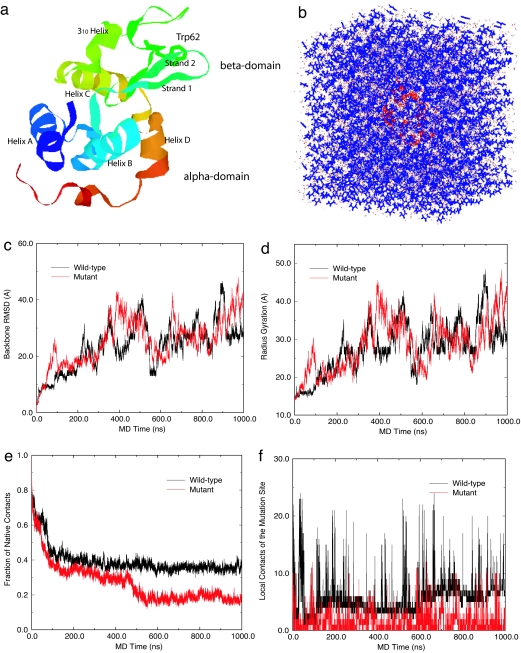
The starting structure of the wild-type protein in our simulations is taken from the crystal structure deposited in the Protein Data Bank (PDB ID code 193L), as shown in Fig. 1a. It consists of four α-helices [helix A (5–14), helix B (25–36), helix C (90–100), and helix D (110–115)], two β-strands [strand 1 (43–46) and strand 2 (51–54)], a loop (60–78) region, and a 310-helix (81–85) and is classified as a two-domain protein, with an α-domain (residues 1–35 and 85–129) and a β-domain (residues 36–84). The mutation-site Trp-62 is in the loop region, and the starting structure for the mutant was generated by a single-residue replacement, W62G, from the wild-type crystal structure. The chemical denaturing simulations are performed in 8 M urea solution (see System and Methods for details on the 8 M urea solution preparation and MD simulations). For each starting configuration (total of 10: 5 for the wild type and 5 for the mutant), two different simulations are run at pH 2, one at a temperature of 310 K for up to 1 μs and the other at 350 K for 100 ns. We also run simulations at pH 7 (with T = 350 K) for further validation [100 ns each for every starting configuration; results are shown in supporting information (SI)]. All results shown in this article, however, are for pH 2 unless explicitly stated. The total MD simulation time exceeded 10 μs. We and others had previously run short MD simulations on hen lysozyme with thermal denaturing [15 ns at 400–500 K (14)] or biased MD [3.6 ns, with a bias potential forcing radius gyration to increase (15)]. However, the high temperature or the biasing force might distort the (un)-folding free-energy landscape. The current simulation mimics the experimental conditions.
Fig. 1.
System and simulation results. (a) Ribbon view of the native lysozyme protein, with residue Trp-62 represented in sticks and both α- and β-domains marked. (b) Solvated lysozyme in 8 M urea solution, with protein lysozyme represented as red ribbons, urea as blue sticks, and water as white sticks. (c) Comparison of the backbone rmsd for the wild-type and mutant lysozymes. (d) Comparison of the radius gyration. (e) Comparison of fraction of native contacts. (f) Comparison of local contact of the mutation site (residue 62).
The time dependence of both backbone rmsd and the radius of gyration from the native protein crystal structure provides measures of misfolding dynamics, as shown in Fig. 1 c and d. Both quantities are seen to steadily increase up to 1,000 ns, with the mutant displaying a higher radius of gyration and larger rmsd in the first 100 ns. Separately, in a previous 15-ns simulation in water with no added denaturant, using either the CHARMM (16) or OPLSAA (17) force fields, the wild-type lysozyme does not unfold but instead exhibits a fluctuating rmsd of ≈2–3 Å (14), indicating a stable structure in pure water. Another measure of unfolding is given in Fig. 1e, which displays the fraction of native contacts versus time for both the wild-type and mutant, in which two residues, i and i + n (n ≥ 3, nonnearest and non-second-nearest), are said to be in contact if the distance between their backbone Cα carbons are <6.5 Å. The wild type maintains significantly more native contacts than the mutant as time passes, which is consistent with experimental findings (2) (see SI for more trajectories). We can also compare the rms fluctuations of each residue (represented by Cα) for the wild-type and mutant lysozymes. The rms fluctuation results show that the mutant lysozyme undergoes much larger fluctuations than the wild type, notably in the β-domain region and in the loop region where the mutation-site Trp-62 resides (see SI for more detail). The loop region was also found to be labile in thermal denaturing simulations (14). Because the local contact network (more below) connecting this loop region with β-strand 1 (residues 43–46) and β-strand 2 (residues 51–54) in the wild type is disrupted in the mutant, it should be expected that motions of the loop should be more labile. Site 62, the mutation site, is found to be significantly more flexible in the mutant than in the wild type during the simulations.
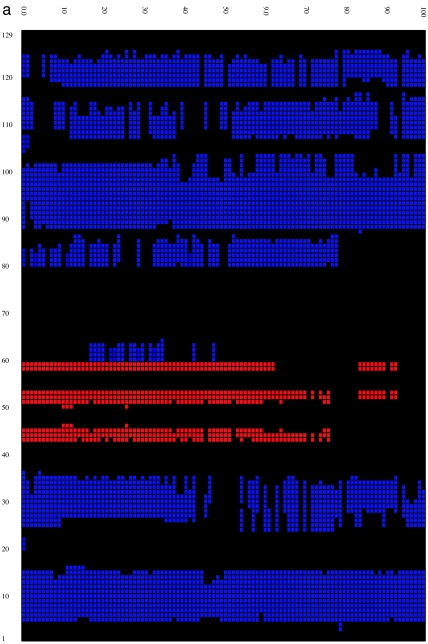
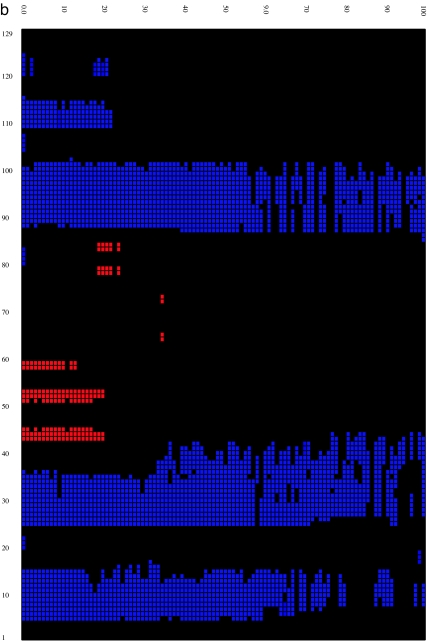
We then calculated the time evolution of the secondary structure (18) for both the wild-type and mutant lysozymes at 310 K by using the program STRIDE (19) to better understand structural features of the misfolding process. Fig. 2 shows that, overall, the secondary structural components for the wild type are fairly stable up to 100 ns despite the fact that the rmsd of the protein grows to >13–14 Å and its fraction of native contacts decreases to <40%. On the other hand, the secondary structure of the mutant is more quickly and more drastically disrupted. The disruption starts from the β-domain region, with the two β-strands disappearing after 20–30 ns, and spreads into helix D (residues 110–115) of the α-domain region. This behavior agrees with insights gained from our previous analysis of flexibility and fluctuations. By 100 ns, part of helices A and C are also destroyed. Interestingly, part of the helical content is still preserved for times as long as 1,000 ns in both the wild type and the mutant (see SI for the time-evolution data at 900–1,000 ns), even though the tertiary structures are basically all gone. Although each trajectory displays slightly different behavior, the collection of trajectories displays a reasonably good consensus on the evolution of secondary structure.
Fig. 2.
Time evolution of the secondary structure at 0- to 100-ns MD simulation for the wild type (a) and W62G mutant (b). The secondary structure is assigned by the program STRIDE (19), with the α-helix colored blue, the 310-helix light blue, the β-strand red, and the coils and turns black. The secondary structure of the starting crystal structure is displayed at t = 0 ns [helix A (5–14), helix B (25–36), helix C (90–100), helix D (110–115), strand 1 (43–46), strand 2 (51–54), and a 310-helix (81–85)].
The higher radius of gyration, larger rmsd (particularly in the early stage of simulation), fewer native-like contacts, higher flexibility, and more disruptive secondary structures in the mutant imply that it is much less stable than the wild type. Dobson and coworkers (2) found that the single mutation W62G caused the native-like contacts, some of long range, in the wild type to disappear in the highly denaturing 8 M urea solution but did not identify the origin and/or the order of the disruptions, probably because of limits on experimental resolution. Our computer simulations show that the disruptions start from the β-domain and then spread into the helices near the interface of the two domains (helices D and C). Interestingly, an experiment by Canet et al. (20) on the mutation D67H of human lysozyme (PDB ID code 1REX) indicates that the mutation significantly reduces the stability of the β-domain and the adjacent C-helix in the native structures. Our findings for the W62G mutation of hen lysozyme is strikingly similar to their findings despite the differences in the systems discussed. Given that there is a high sequence identity (60%) between these two lysozyme proteins, the current finding that the misfolding process is initiated in the β-domain region seems reasonable.
Let us now look at the structures through which the wild type and mutant pass as they unfold, because this will be helpful in allowing us to clarify their differences in behavior. We determine representative structures for both wild type and mutant through a clustering analyses by using two sets of data, one from a 10- to 100-ns segment of the MD trajectory (where two domains fall apart) and another from a 100- to 1,000-ns segment of the trajectory (where tertiary structures disappear) (21, 22). As expected, the mutant from the 10- to 100-ns segment exhibits more disrupted β-strands and helix D in the representative structure than that of the wild type, indicating that the mutant loses more native contacts than the wild type. In the 100- to 1,000-ns segment the mutant and wild type do not display many differences in some helical secondary structures but do display significant differences in tertiary structures, with the mutant losing much more tertiary structure or native-like contacts (more below).
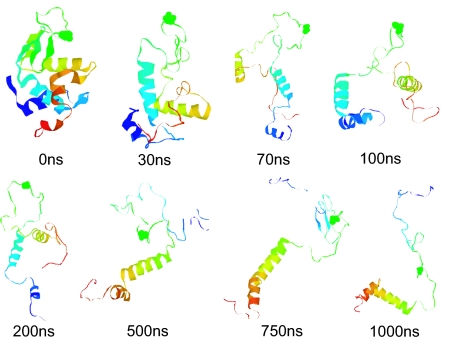
It is remarkable that even after 1,000 ns both wild-type and mutant lysozymes maintain part of their secondary structure in urea, which could also indicate that 1,000-ns simulation is still not long enough. Despite this stability of secondary structure, the mutant loses most of its tertiary structure after 100 ns. Detailed examinations of the unfolding trajectories show how the mutant loses tertiary structure and native-like contacts during the chemical denaturing process (i.e., misfolding kinetics). Fig. 3 shows snapshots of the mutant during one of the 1-μs trajectories at 310 K. The first major unfolding event occurs at ≈20–30 ns, when β-strands 1 and 2 start to disappear in the mutant. Interestingly, helix D near the two-domain interface (residues 110–115) is also partially destroyed during this time period. At this point, the native-like local contacts (and secondary structures) in the β-domain are largely destroyed. This behavior can also be seen from the evolution of the secondary structure shown in Fig. 2. As time progresses, the tertiary contacts between helices A and B and their contacts with the rest of the protein are disrupted. After ≈100 ns, many of the tertiary structures start to disappear, even though the helical secondary structures, such as part of helices C and D, are still preserved. The protein is essentially now in a molten-globule state with a much larger radius of gyration, as shown in Fig. 1c. By ≈200–300 ns, the α-domain tertiary structures are also largely destroyed, with not many native contacts left. Essentially, the mutant protein denatures fully even though part of the helical secondary structures is still preserved. Again, these results indicate that the misfolding process starts in the β-domain region, with β-strands 1 and 2 destroyed first and then the helices near the two-domain interface starting to unfold. At the end of the 1-μs simulation, the tertiary structures in the mutant are basically all destroyed even though some of the helical secondary structures remain. Other trajectories show similar behavior, although the exact time for each event could be slightly different.
Fig. 3.
Snapshots of the mutant lysozyme during one representative microsecond of the chemical denaturing trajectories. These snapshots clearly indicate the gradual loss of the native contacts, with most of the loss in the β-domain first. Interestingly, even at the end of the 1-μs simulation, some helical content still persists.
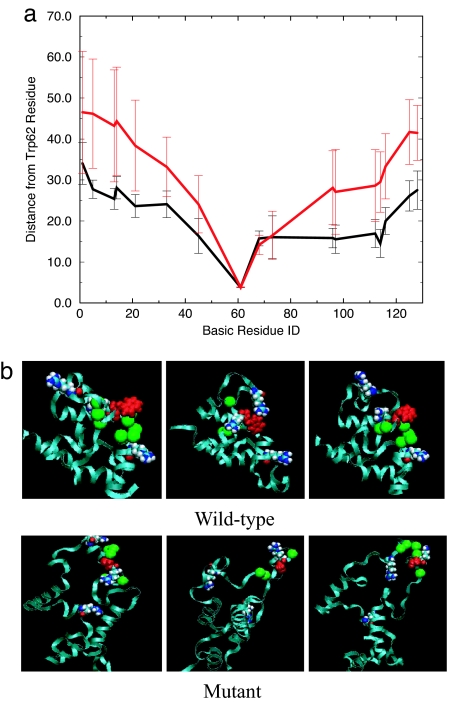
The MD trajectories provide an answer to the central question: why would the single mutation W62G cause the above-described disruption in the tertiary structure? To answer this question, we study the “local contacts” of the Trp-62 or Gly-62 residue in detail. Here, a local contact (native or not) is defined the same way as a native contact except that the distance between Cα carbons is chosen to be <10 Å, rather than 6.5 Å, for a native contact. This larger distance of 10 Å will give us a broader view of residues that are proximate to the mutation site. As shown in Fig. 1f, there are indeed a lot more local contacts of Trp-62 in the wild type than that of Gly-62 in the mutant. Fig. 4a shows a comparison of the average distance of any basic residue in lysozyme from Trp-62 (Cα–Cα distance) for the wild type and mutant in the first 100-ns simulation. Overall, in the mutant the basic residues are, on average, more distant from the mutation site (residue 62) than in the wild type, with significantly higher SDs as well. This result indicates that in the mutant the basic residues are more distant from the possible “nucleation site” Trp-62 (if there is one) than in the wild type, where these basic residues, particularly Arg-73, Lys-97, and Arg-112, can form some kind of local cluster (or a nucleation site) along with Trp-62. Fig. 4b also shows representative structures of the wild type and mutant after 100-ns MD simulations. These detailed local structures reveal that the Trp-62 residue acts as a bridge between two neighboring basic residues, such as Arg-73 and Arg-112; the π electrons on its aromatic indole ring can attract the two positively charged residues to form a kind of “sandwich” structure through the so-called π-type H bond (see Fig. 4b). This Arg-Trp-Arg bridge structure is not seen in the wild-type x-ray crystal structure. In fact, the Arg-112 residue is >10 Å away from Trp-62 (Cα–Cα distance of 19.1 Å and a Cζ-indole ring closest distance of 12.5 Å), which makes this bridging effect during the early stage of folding even more interesting. It should be noted that modern force fields, such as CHARMM22 (16), do not have polarizability built in, so the π-type H bond might be underestimated. Nevertheless, with this bridge or attractant, the two positively charged residues are held more closely together. These basic residues can then attract other local residues through long-range electrostatic interactions, as indicated by the much higher number of local contacts seen in the wild type. Therefore, a native-like cluster or nucleation site can be formed near these residues in the wild type, and Trp-62 plays a key role in a cooperative long-range interaction. On the other hand, the Gly-62 residue in the mutant does not have π-electron-equipped aromatic rings and, thus, does not have the capability to be a nucleation site. This finding resolves the mystery of why Trp located on the surface can give rise to the long-range interactions and have such a profound effect on the stability of the protein. Interestingly, Scheraga and coworkers (23) have also found a similar effect previously, where two positively charged arginines are brought together on the surface of a protein by polarizing the intervening water molecules. In that case, it is the bridging water (instead of the negatively charged indole ring) that contributes to the stability of these unusual Arg–Arg short-range pairs.
Fig. 4.
Trp-62 interactions with basic residues. (a) Comparison of the average distance and SD of basic residues from Trp-62 (Cα–Cα distance) for the wild type and mutant in the first 100-ns simulation. (b) Representative structures of the wild type and mutant during the 100- to 1,000-ns MD simulations. The Trp-62 is represented as red van der Waals space-fills, and three nearby basic residues (Arg-73, Lys-97, Arg-112) are represented as van der Waals space-fills. The green balls represent the residues making local contacts with Trp-62.
Conclusion
In this article, we have used MD simulations to study how a single-point mutation (W62G) affects the stability and misfolding of the protein hen egg-white lysozyme. Both the wild-type and mutant lysozymes were simulated on a BlueGene/L supercomputer. Our results show that the mutant structure is indeed much less stable than the wild-type one, which is consistent with the recent urea denaturing experiment (2). The time evolution of the secondary structure and rms fluctuations reveal that the single mutation W62G first induces the loss of native contacts in the β-domain region of the lysozyme protein, and then the disruption spreads into the α-domain region. Local contact analysis shows that the Trp-62 residue is the key to a cooperative long-range interaction within the wild type: it plays a role as a bridge or attractant between several neighboring basic residues such as Arg-73 and Arg-112. Therefore, a native-like cluster or nucleation site can be formed near these residues in the wild type, whereas the mutant does not have this nucleation mechanism. The results from our large-scale simulations complement recent experimental results and offer useful insights into the mechanism behind lysozyme protein misfolding and subsequent aggregation.
System and Methods
For the preparation of the 8 M aqueous urea, we followed a similar approach to that used by Caflisch and Karplus (24). A total of 30 urea molecules were first randomly immersed into a previously equilibrated 18.6 × 18.6 × 18.6-Å water box with 216 single-point charge water molecules (if any urea molecule overlaps with other urea molecules, it will be replaced by another randomly distributed one). Then, all water molecules overlapping with the urea molecules (if distance between the water O atom and urea-heavy atoms is <2.7 Å) were deleted. After removal we have a box of 30 urea and 128 water molecules, which then was minimized and equilibrated for 100 ps of constant number/volume/temperature simulation at 310 K. The resulting small water/urea box was then expanded periodically in space to generate a much larger box of 74.4 × 74.4 × 74.4 Å with 1,920 urea and 8,192 water molecules. This larger urea/water mixture was then further equilibrated with a 1,000-ps simulation at constant temperature and pressure (310 K and 1 atm), and the final box size was 73.1 × 73.1 × 73.1 Å, which corresponded to an ≈8 M urea concentration at a density of 1.12 g/cm3.
The protein lysozyme was then immersed in the equilibrated 8 M urea box, and water and urea molecules overlapping with protein atoms were deleted. The criterion for overlapping was a distance of <2.7 Å between the water oxygen and any heavy atom of lysozyme and a distance of <2.4 Å between any heavy atom of urea and lysozyme. The final molecular system consisted of lysozyme centered in the box with 7,793 water and 1,809 urea molecules. Eight Cl− counter ions were then added to neutralize the solvated system, giving a total system size of ≈40,000 atoms. The final lysozyme in the 8 M urea system was then equilibrated with a 1,000-ps simulation at constant temperature and pressure (310 K and 1 atm), with the final box size converged to ≈72.9 × 72.9 × 72.9 Å. Five configurations were picked from the above-described trajectory, each 200 ps apart, as the production starting configurations for the wild type (see Fig. 1b for one of the solvated configurations). The starting structures of the mutant lysozyme were generated by a simple replacement of residue Trp-62 to Gly-62 from the above-described wild-type systems and then reequilibrated with a 1,000-ps simulation at constant temperature and pressure (310 K and 1 atm) each. Thus, for both the wild-type and mutant lysozymes, five trajectories starting from different initial configurations were run for statistics. For each configuration (total of 10: 5 for the wild type and 5 for the mutant), two different simulations were run at pH 2 with temperatures of 310 and 350 K, respectively, with up to a 1-μs MD run each at 310 K and 100 ns each at 350 K. For further validation, we also ran simulations at 100 ns each at 350 K at pH 7 (results are shown in SI; all results shown in this article were for pH 2 unless explicitly stated). The total MD simulation time was >10 μs. The NAMD2 MD program (25) was used for our simulations, with the CHARMM force field (16) for protein lysozyme and solvent urea and the slightly modified TIP3P water model (26) for the solvent water.
For the long-range electrostatic interactions, we made use of the particle-mesh Ewald method (27), whereas for the van der Waals interactions, a typical 10-Å cutoff was used. All production runs were performed with the constant temperature and pressure ensemble, with the temperature controlled by the Berendsen thermostat and pressure controlled by the Berendsen barostat (28). A time step of 1.5 fs was used, with bond lengths constrained for all simulations.
Supplementary Material
Acknowledgments
We thank Sameer Kumar for help with the importing of NAMD2 onto IBM BlueGene/L. We also acknowledge the contributions of the BlueGene/L hardware, system software, and science application teams, whose efforts and assistance made it possible for us to use the BlueGene/L at IBM Watson.
Abbreviation
- MD
molecular dynamics.
Footnotes
The authors declare no conflict of interest.
This article contains supporting information online at www.pnas.org/cgi/content/full/0701249104/DC1.
References
- 1.Kagan BL, Dobson CM. Science. 2005;307:42–43. doi: 10.1126/science.307.5706.42b. [DOI] [PubMed] [Google Scholar]
- 2.Klein-Seetharaman J, Oikawa M, Grimshaw SB, Wirmer J, Duchardt E, Ueda T, Imoto T, Smith LJ, Dobson CM, Schwalbe H. Science. 2002;295:1719–1722. doi: 10.1126/science.1067680. [DOI] [PubMed] [Google Scholar]
- 3.Dumoulin M, Last A, Desmyter A, Decanniere K, Canet D, Spencer A, Archer D, Muyldermans S, Wyns L, Matagne A, et al. Nature. 2003;424:783–788. doi: 10.1038/nature01870. [DOI] [PubMed] [Google Scholar]
- 4.Chiti F, Stefani M, Taddei N, Ramponi G, Dobson CM. Nature. 2003;424:805–808. doi: 10.1038/nature01891. [DOI] [PubMed] [Google Scholar]
- 5.Brooks CL, Onuchic JN, Wales DJ. Science. 2001;293:612–613. doi: 10.1126/science.1062559. [DOI] [PubMed] [Google Scholar]
- 6.Dobson CM, Sali A, Karplus M. Angew Chem Int Ed Engl. 1998;37:868–893. doi: 10.1002/(SICI)1521-3773(19980420)37:7<868::AID-ANIE868>3.0.CO;2-H. [DOI] [PubMed] [Google Scholar]
- 7.Brooks CL, Gruebele M, Onuchic JN, Wolynes PG. Proc Natl Acad Sci USA. 1998;95:11037–11038. doi: 10.1073/pnas.95.19.11037. [DOI] [PMC free article] [PubMed] [Google Scholar]
- 8.Zhou R, Huang X, Margulius CJ, Berne BJ. Science. 2004;305:1605–1609. doi: 10.1126/science.1101176. [DOI] [PubMed] [Google Scholar]
- 9.Liu P, Huang X, Zhou R, Berne BJ. Nature. 2005;437:159–162. doi: 10.1038/nature03926. [DOI] [PubMed] [Google Scholar]
- 10.Wales DJ, Scheraga HA. Science. 1999;285:1368–1372. doi: 10.1126/science.285.5432.1368. [DOI] [PubMed] [Google Scholar]
- 11.Fernandez A, Scheraga HA. Proc Natl Acad Sci USA. 2003;100:113–118. doi: 10.1073/pnas.0136888100. [DOI] [PMC free article] [PubMed] [Google Scholar]
- 12.Tajkhorshid E, Nollert P, Jensen M, Miercke LJ, O'Connell J, Stroud RM, Schulten K. Science. 2002;296:525–530. doi: 10.1126/science.1067778. [DOI] [PubMed] [Google Scholar]
- 13.Noskov S, Berneche S, Roux B. Nature. 2004;431:830–834. doi: 10.1038/nature02943. [DOI] [PubMed] [Google Scholar]
- 14.Eleftheriou M, Germain R, Royyuru A, Zhou R. J Am Chem Soc. 2006;128:13388–13395. doi: 10.1021/ja060972s. [DOI] [PubMed] [Google Scholar]
- 15.Paci E, Vendruscolo M. J Phys Condens Matter. 2005;17:S1617–S1626. [Google Scholar]
- 16.MacKerell AD, Bashford D, Bellott M, Evanseck RLDJ, Field MJ, Fischer S, Gao J, Guo H, Ha S, Joseph D, et al. J Phys Chem B. 1998;102:3586–3616. doi: 10.1021/jp973084f. [DOI] [PubMed] [Google Scholar]
- 17.Jorgensen WL, Maxwell D, Tirado-Rives J. J Am Chem Soc. 1996;118:11225–11236. [Google Scholar]
- 18.de Bakker PI, Hunenberger PH, McCammon JA. J Mol Biol. 1999;285:1811–1830. doi: 10.1006/jmbi.1998.2397. [DOI] [PubMed] [Google Scholar]
- 19.Frishman D, Argos P. Proteins. 1995;23:566–579. doi: 10.1002/prot.340230412. [DOI] [PubMed] [Google Scholar]
- 20.Canet D, Last AM, Tito P, Sunde M, Spencer A, Archer DB, Redfield C, Robinson CV, Dobson CM. Nat Struct Biol. 2002;9:308–315. doi: 10.1038/nsb768. [DOI] [PubMed] [Google Scholar]
- 21.Zhou R, Berne BJ, Germain R. Proc Natl Acad Sci USA. 2001;98:14931–14936. doi: 10.1073/pnas.201543998. [DOI] [PMC free article] [PubMed] [Google Scholar]
- 22.Zhou R. Proc Natl Acad Sci USA. 2003;100:13280–13285. doi: 10.1073/pnas.2233312100. [DOI] [PMC free article] [PubMed] [Google Scholar]
- 23.Magalhaes A, Maigret B, Hoflack J, Gomes JN, Scheraga HA. J Protein Chem. 1994;13:195–215. doi: 10.1007/BF01891978. [DOI] [PubMed] [Google Scholar]
- 24.Caflisch A, Karplus M. Structure (London) 1999;7:477–488. doi: 10.1016/s0969-2126(99)80064-1. [DOI] [PubMed] [Google Scholar]
- 25.Phillips JC, Braun R, Wang W, Gumbart J, Tajkhorshid E, Villa E, Chipot C, Skeel RD, Kale L, Schulten K. J Comput Chem. 2005;26:1781–1802. doi: 10.1002/jcc.20289. [DOI] [PMC free article] [PubMed] [Google Scholar]
- 26.Jorgensen WL, Chandrasekhar J, Madura JD, Impey RW, Klein ML. J Chem Phys. 1983;79:926–935. [Google Scholar]
- 27.Essman U, Perera L, Berkowitz ML, Darden T, Lee H, Pedersen LG. J Chem Phys. 1995;103:8577–8593. [Google Scholar]
- 28.Berendsen HJC, Postma JP, van Gunsteren WF, DiNola A, Haak JR. J Chem Phys. 1984;81:3684–3690. [Google Scholar]
Associated Data
This section collects any data citations, data availability statements, or supplementary materials included in this article.


