


Abstract
Combinatorial gene regulation largely contributes to phenotypic versatility in higher eukaryotes. Genome-wide chromatin immuno-precipitation (ChIP) combined with expression profiling can dissect regulatory circuits around transcriptional regulators. Here, we integrate tiling array measurements of DNA-binding sites for c-Myc, sp1, TFIID and modified histones with a tissue expression atlas to establish the functional correspondence between physical binding, promoter activity and transcriptional regulation. For this we develop SLM, a methodology to map c-Myc and sp1-binding sites and then classify sites as sp1-only, c-Myc-only or dual. Dual sites show several distinct features compared to the single regulator sites: specifically, they exhibit overall higher degree of conservation between human and rodents, stronger correlation with TFIID-bound promoters, and preference for permissive chromatin state. By applying regression models to an expression atlas we identified a functionally distinct signature for strong dual c-Myc/sp1 sites. Namely, the correlation with c-Myc expression in promoters harboring dual-sites is increased for stronger sp1 sites by strong sp1 binding and the effect is largest in proliferating tissues. Our approach shows how integrated functional analyses can uncover tissue-specific and combinatorial regulatory dependencies in mammals.
INTRODUCTION
Understanding how combinatorial regulatory networks contribute to phenotypic diversity in higher organisms is a major challenge of current functional genomics (1,2). To tackle this complex problem a powerful experimental strategy relies on genome-wide chromatin immuno-precipitation (ChIP) experiments which can localize binding sites of transcriptional regulators in a whole genome (ChIP-chip) and hence map protein–DNA interaction networks (3). Furthermore, such experiments can be combined with genomic sequence or expression profiling to assess the link between physical protein–DNA association and functional gene regulation. A key for the success of these methods are bioinformatics algorithms that range from signal analysis to robust integration of complementary data types on a comprehensive scale (4).
Yeast has been the most extensively studied organism and the only one for which large-scale datasets (>100 DNA-binding proteins) have been produced for the same condition (rich medium) (5–7). In mammalian cells, several specific transcription factors were studied (6,8–13) and datasets for several transcription factors measured in the same conditions are beginning to reveal multi-factorial aspects of gene regulation in mammals, notably around the HNF family of transcription activators in pancreas and liver (14). ChIP was also used to characterize binding of general transcription regulators, as the Taf1 subunit of the initiation complex TFIID (15), the polymerase II enzyme (16) or modified histone patterns (17).
Investigating the functional link between gene expression and transcription factor binding at promoters, computational approaches for explaining co-regulated gene clusters could identify overrepresented sequence motifs in the gene promoters (18–20). Examples of combinatorial regulation through pairs of sequence elements emphasized the importance of element order (21). Other classes of approaches used linear regression to model continuous expression levels in function of sequence elements or ChIP-binding strength (22–25). This approach was extended to multiple and interacting sequence motifs and applied to yeast-cell-cycle data, however at the cost of increased number of parameters (26). An interesting algorithm to tighten co-regulated modules imposed correlations in binding-site patterns (from ChIP) and expression profiles (27). Along this line, integration of large-scale ChIP and expression in yeast reconstructed the active parts of gene regulatory networks by imposing condition specific activity criteria on the static network inferred via ChIP (28). In mammals, integration of ChIP sites with other data types is expected to increase rapidly (8,13,14,29).
As a highly versatile transcriptional regulator, c-Myc is a proto-oncogene upregulated in many human malignancies (30–32). It encodes a basic helix-loop-helix leucine zipper transcription factor with a role in growth regulation and differentiation (33,34). Bound to its partner Max, the heterodimer induces expression of its targets by direct DNA binding to E-box motifs. Since this is a relatively uninformative criteria for comprehensive target identification, a number of studies have attempted to better characterize target genes, using classical ChIP (35), microarray experiments (36) and more recently ChIP combined with promoter (8) or genomic arrays (10). While it has so far not been possible to refine the target specificity beyond E-box preference, these studies have shown that c-Myc plays a nearly ubiquitous role at core promoters, possibly through interaction with the core transcription machinery (8,37). Likewise the sp1 zinc finger protein (specificity protein 1) is thought to play a critical role in cancer progression by regulating growth factors (38). It is known as a proximal promoter factor that frequently binds multiple GC-boxes upstream of transcription start sites (39), and acts as a transcription co-activator by direct binding to subunits of the basal transcription machinery.
In order to systematically investigate how bound c-Myc and sp1 influence expression of their target genes, we study how the expression of genes that harbor c-Myc or sp1 sites responds across a large collection of tissues (40). Using regression models, we find that genes with both c-Myc-and sp1-binding sites have a distinct expression signature when compared to genes with either site alone. Specifically, we find a group of proliferation associated genes whose correlation with c-Myc mRNA level is increased by the co-localization of c-Myc and sp1 binding at promoters.
MATERIALS AND METHODS
Datasets
Genomic data
Genomic sequence, annotations, chromosomal coordinates of TSSs, genes structure and alignments between human, mouse and rat are publicly available from the UCSC Genome Table browser (41). Based on these coordinates, we define ‘genes’ as the genomic regions from −1.5 kb upstream of the transcription start site (TSS) to +1 kb downstream of the polyadenylation site (PAS), accounting for roughly 30% of the chromosomes length. Additionally we define distal promoters stretching from −10 kb and −1.5 kb of the TSS (Figure 1A). The intragenic mapping follows the annotation, except for the 5′ regions defined as −1.5 kb to +0.5 kb of TSS, and 3′UTR, −1 kb to +1 kb of polyadenylation site (PAS).
Figure 1.

Localization of binding sites with respect to annotated genes. Annotation is from UCSC build hg17 (on chromosome 21 and 22 these sum to 1255 TSSs, including alternative TSSs for some genes). (A) More than 70% of the 633 (360 for c-Myc, 221 for sp1) fall close to genes (black), defined here as spanning from −1.5 kb upstream of the TSS to 1 kb downstream of the PAS (this represents ∼30% of total genomic sequence). Very few sites are found in distal promoters (−10 kb to −1.5 kb, gray). The remaining 20–25% of sites (white) are thus far from genes. (B) Refined mapping for the sites near genes (black fraction in Figure 2A) shows a strong preference for the 5′ regions. Sites are classified as either 5′ regions (from −1.5 kb to +0.5 kb of the TSS; green), exons (light green), intron (pink) or 3′UTR (−1 kb to +1 kb of PAS; red). Color scheme for panels A and B is explained below the panels. (C) Distribution of distances from TSSs for sites mapped in the 5′ regions. We find a tight co-localization with the TSS (defined as 0) for both factors, coordinates are taken positive in the transcript direction.
CHiP-chip data
The raw ChIP-chip data is publicly available (10). Recently, c-Myc and sp1 proteins were cross-linked to DNA and purified using specific antibodies. Fragments were amplified with random primers and hybridized on tiling arrays covering the non-repetitive genomic sequences of human chromosomes 21 and 22 at 35 bp resolution (43). The data provides three biological replicas and two technical replicas for each condition. To quantify the enrichment we used the six enriched samples and the six total chromatin samples.
Coordinates of TFIID binding were taken from (15) (http://licr-renlab.ucsd.edu/download.html) and converted to the UCSC human genome build hg17. c-Myc or sp1 sites falling in windows of ±2 kb around TFIID sites were classified as close to a TFIID site.
Histone modification islands were taken from (17) and converted to the human genome build hg17. c-Myc or sp1 sites, or TFIID anchor points localized in the regions reported as di-methylated, tri-methylated or acetylated were classified accordingly.
Expression microarray data
The publicly available tissue microarray data consists of 79 conditions in duplicate at (www.gnf.org) (40). We used condition normalized MAS5.0 scores as provided on the website. To map the TSSs to probeset identifiers, we used the tables provided in the UCSC browser.
Analysis
We use sequential steps: (1) a background subtraction for Affymetrix tiling arrays; (2) a binding site detection algorithm for ChIP experiments called sliding linear modeling (SLM) followed by a false discovery proportion (FDP) assessment; (3) a classification of sites according to their location with respect to genome annotations, and functional signatures in other comprehensive ChIP experiments; (4) a regression analysis to investigate the relationship between the mapped promoter classes and gene expression as measured on arrays.
Processing of raw tiling arrays data
The analysis is suited for ChIP experiments on high resolution tiling arrays, e.g. 35 bp resolution oligonucleotide arrays (10). Previous analysis methods focused both on chromatin (44,45) and RNA hybridizations (46,47). We implement a background correction for tiling arrays similar to the GCRMA algorithm for expression arrays (48). Background correction is done for each array separately. The intensities are assumed to follow the model Ij = Sj + NSj + O, where Ij is the measured intensity of the perfect match (PM) probe j, Sj and NSj represent the specific and non-specific binding and O is a probe-independent basal fluorescence level. j runs over all n probes on each array. We use the estimator  = min(Ij) − 1 as the minimum PM intensity measured on the array. The non-specific part is modeled as in (48,49) using a linear model:
  where ail are position (i ∈ {1, … , 25}) and letter (l ∈ {A,C,G,T}) dependent affinities and Pjil is an indicator variable taking value 1 if the probe j has base l at position i and 0 otherwise. In practice, we reduce the number of parameters by expressing the position dependence using third degree polynomials:
  with k ∈ {0,1,2,3} as in (49). Here
  where qik are orthogonal Legendre polynomials on the interval [1,25]. Due to the constraints
  , this leaves 13 independent regression parameters ckl. Since binding of a specific transcription factor is a rare event at the scale of the genome, we fit all probes on the array to the background model. This can be modified by the user in our software if necessary. The fraction of the variance in intensity captured by the model varies from 40 to 60% in the set of 12 arrays. This is comparable or larger than reported in (50). Maximum likelihood estimates of the
  (Figure S1A) are computed under the assumption that log(NSj) ∼ N(bj,τ2), where
  . We then define
  and
and 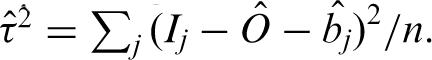 . The estimated log of the specific signal is denoted
  . As in previous work (51) we impose a lower bound on by requiring that ≥ log(m) to control the extension of the dynamical range at the lower limit. We used an ad hoc choice of m = 10. When Ij −
  ≤ m, we set
  = log(m). When Ij − > m, we set = E [log(Sj)], where E [ ], represents expectation with respect to a truncated version of the estimated normal density for log(NSj). Specifically
 |
with the upper integration boundary  . This estimator behaves as a softer maximum likelihood estimate (Figure S1B). In practice we evaluate the integral numerically using the Gnu Scientific Library (GSL). We then apply quantile normalization (52) in which we pool experiments and controls. Comparison with other background corrections and normalization is provided in Figure S2.
Estimation of local enrichment and sliding linear model (SLM)
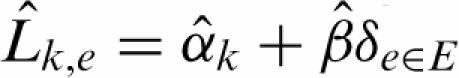
The closely spaced 25-mers justify an extension of RMA estimators for expression arrays (53). Only the perfect match (PM) probes are used (54,55). To estimate the position-dependent enrichment in the immunoprecipitated samples, SLM applies local multilinear regression to the normalized logarithmic signals. For simplicity, we describe the procedure for a single window centered on probe 0 located at the genomic position p0. The normalized signals of probe k at position pk in the experiment e is described as the superposition of a probe effect αk common to all samples, and β represents the enrichment of experiments (E) over controls (C) at position p0:
δe∈E is an indicator function taking value 1 if e is an experiment and 0 otherwise, and ηke are independent Gaussian noise terms with constant variance  . β is estimated locally using a Gaussian kernel centered on the position p0. The kernel wk = exp(−(pk − p0)2/2σ2) decays with the inter-probe genomic distance |pk − p0| with σ = 200 bp. The latter scale was chosen since it is much smaller than the width of an expected site but is large enough for local smoothing. On average, the signals from about five probes are smoothed at each position. Maximum likelihood estimators for α and β read:
 |
where 〈E〉k and 〈C〉k stand for as the group average of all experiments, respectively controls, for probe k. |E| is the number of experiments and |C| the number of controls. This shows that the estimator  is a weighted average of the difference between enriched and control samples. We apply a t-like statistic for locally weighted regression
  , where
 is the estimated variance in (cf. Supplementary any data and (56)) with the (biased) estimated noise strength
  .
.  is the estimated signal. The position p0 is then shifted by one probe and the procedure is repeated along the entire chromosome to determine the enrichment at each position. The statistics is then assessed non-parametrically as detailed below.
Site detection
As a first permissive selection, candidate peaks are required to have a minimum of six contiguous probes with t above the local 95th percentile computed locally in 10 kb windows. To summarize each peak, a Gaussian shape ( ) is fit to the probes above the threshold plus the neighboring three probes on either side. h, μ, λ are used to define the height, location and width of sites. This set of putative sites is then filtered using a resampling method that allows to control the false discovery proportion (FDP). The method is detailed in (57,58). Briefly, to construct the null model, we extract Gaussian shapes as described for all 924 possible label permutations (six experiments and six samples). The sites are then ranked according to their heights and a null-distribution of the test statistics for each rank is computed from the 924 permutations. For each rank r, we retain the nr sites in the correct experiment-control assignment with heights above the 95% percentile in the null-distribution. We then control the FDP by retaining the highest rank r that define a group with ≤5% predicted false positives, that is by choosing the largest r such that r/nr ≤ 0.05.
Site remapping
To compare results with the previous analysis we keep hg12 build for the site detection. Localization of sites to the hg17 genome version is determined using the batch coordinate conversion tool liftOver provided with the UCSC genome browser.
Data and probesets selection
We restrict the expression analysis to the 745 probesets in the GNF SymAtlas matching to genes on human chromosome 21 and 22. The reference probeset identifiers for c-Myc and sp1 are 202431_s_at and 214732_at, respectively.
Regression models for expression data
To assess the relation between gene expression levels and regulator expression levels we introduce gene-specific susceptibilities to c-Myc (ag) and sp1 (bg) via the linear model:
| (M1) |
Ig is a gene-specific intercept and  the condition normalized log2 expression of gene g in condition e, ɛge are independent Gaussian noise terms.
  and
and  refer to mRNA levels of the regulators in condition e and are our best proxies for their activity levels. Notice that we cannot prove that such susceptibilities reflect direct causal interaction; these can also reflect indirect regulation, or the existence of upstream regulators influencing both the expression of the regulator and the gene under consideration. Multilinear regression parameters and statistics are computed using the software R (http://cran.r-project.org). When a gene symbol is represented by multiple probesets, the probesets expression levels are averaged.
RESULTS
c-Myc and sp1-binding sites
We evaluate ChIP data for c-Myc and sp1 on human chromosomes 21 and 22 (10) by adapting signal estimators previously developed for GeneChips (Figure S3, Methods). We then apply a resampling technique (57) to control the false discovery proportion (FDP), resulting in 312 sites for c-Myc and 260 for sp1 (Table 1, left, Figure. S6). To examine the localization of sites relative to known genes we use the latest annotations and find that factors are preferentially (∼75%) located near genes (as defined in the Materials and Methods section). The negligible fraction of sites in the distal promoters (<1%) indicates that sites outside genes (∼20%) occur far from cis-regulatory enhancers, or that such elements can be located beyond 10 kb (Figure 1A). Among the 75% of sites near genes, sp1 occurs more frequently in 5′ regions (from −1.5 kb to +0.5 kb), 75% versus 60% for c-Myc (Figure 1B), which correlates with the known affinity of sp1 for GC-boxes frequently located near TSSs. Thus a significantly higher fraction of all sites (>50% for both factors) bind near TSSs than originally reported (22%, (10)) and we also find fewer sites within genes or in 3′ regions (maximally 10%). Specifically, 55% of the sp1 sites overlap with the 358 sites in the original mapping, that is the old peak falls in the interval [μ − 2λ, μ + 2λ] defined by the Gaussian shape. Similarly 77% of the c-Myc sites overlap with the 756 original sites. A comparison with original mapping from (10) is detailed in Figure S5 and in the online supplement. Finally no c-Myc or sp1 site maps closer than 10 kb from any of the eight annotated miRNA genes on chromosome 21 and 22.
Table 1.
Columns 1–2: Detected sites (FDP < 5%) and their positions with respect to annotated TSSs. The higher number of sites on chromosome 22 than chromosome 21 follows the number of annotated TSS (391 on chr 21, 864 on chr 22). Columns 3–7: All annotated TSS (UCSC genome browser, hg17) are split in to four groups: those without c-Myc or sp1 sites, those with only c-Myc, only sp1 or both. To be associated with a TSS, a site is required to lie between −1.5 kb and +1.5 kb of the TSS. The percentages refer to the total number of TSSs on each chromosome. All sites near genes with their functional annotations can be found at http://wiki.epfl.ch/naeflab. Here the smoothing used σ = 200 bp; the number of significant sites decreases as a function of σ (Figures S4 and S5). All sites computed with different σ’s are provided in the above website
| c-Myc | sp1 | Annotated TSS (unique genes) | No sites | sp1 only | c-Myc only | Dual sites | |
|---|---|---|---|---|---|---|---|
| chr21 | 108 | 69 | 391 (305) | 301 (77.1%) | 26 (6.6%) | 31 (7.9%) | 33 (8.4%) |
| chr22 | 204 | 191 | 864 (664) | 614 (71.1%) | 105 (12.1%) | 48 (5.6%) | 97 (11.2%) |
| Both | 312 | 260 | 1255 (969) | 915 | 131 | 79 | 130 |
Co-localization of c-Myc and sp1 sites is overrepresented at evolutionarily conserved promoters
We next study the position of sites relative to TSS by considering the distance between all peaks and each TSS. Sites occur preferentially within 500 bp of annotated TSSs; additionally, the sp1 distribution is tighter and upstream of c-Myc (Figure 1C). This shows that the sp1 site occurs on average 150 bp upstream of annotated TSS, which is encouraging considering the ∼1 kb resolution of the mapping. It is also consistent with the enrichment of GC-boxes found 65 bp upstream of TSSs (the result can be generated at http://www.isrec.isb-sib.ch/ssa/). The resemblance between the c-Myc and sp1 localization profiles hints at a co-localization of these factors near initiation as found also in (10). Among all sites near TSSs (Table 1, right) we find 130 TSS with dual c-Myc and sp1 sites while the expected overlap is 43 ± 5 (P < 10−49, hypergeometric distribution). This makes 50% (61% in the original analysis) of sp1 sites and 62% of c-Myc sites (originally 29%) dual sites. Moreover, 96% of all dual sites found in 10 kb windows fall within 1 kb of each other, and without obvious bias in the ordering. In comparison, only 19% of close co-localization is expected under the null hypothesis of random positions in the 10 kb window; thus co-localization is highly non-random. Moreover, positioning the sites with respect to conserved regions between human and mouse or human and rat (genome alignments taken from UCSC, cf. methods section) shows that binding of c-Myc and sp1 often occurs in conserved region, and that the enrichment increases with the conservation level in the aligned regions (Figure 2A). This agrees with previous reports for c-Myc (44), however we add that dual sites are generally more conserved than single sites.
Figure 2.

Positions of sites assessed in genomic and functional data. (A) Binding sites are enriched for conservation between human–mouse and human–rat. The fold enrichment (expressed with respect to randomized site locations) is plotted versus a conservation score taken as the quantile of pairwise alignment scores taken from UCSC genome database. For each conservation threshold, the number of sites falling in conserved islands is divided by its expected number, assuming random sites positions. Genome-wide alignments and scoring is described in (42). (B–C). Overlap with TFIID sites (15) and modified chromatin islands (17). In all cases the positions for c-Myc or sp1 sites are taken as the location of the Gaussian profiles (cf. Figure. S2, methods section). The TFIID- binding sites and the modified histone islands are given as genomic intervals. Their coordinates were taken from the original publications and mapped to the build hg17 of the human genome (Materials and Methods Section). (B) c-Myc and sp1 bind preferentially to TSSs also bound by TFIID (15). Such TSSs (255) are defined as having a TFIID island in a window of [−1 kb, +1 kb] around the TSS position and amount to 21% of all unique TSS region on chromosomes 21 and 22. Such TSSs also bound by c-Myc or sp1 are nearly 65% while this fraction is well below 20% for TFIID free sites. The relative fraction of dual sites is clearly higher when TFIID binds: the green fraction (dual) is larger than the combined blue (Myc) and yellow (sp1), whereas all three are approximately equal for TSS regions without TFIID. We find that 33% of all sp1 sites coincide with TFIID and 27% for the c-Myc sites. (C) c-Myc-only and dual sites are enriched near permissive chromatin islands (tri-methylated (Tri) and acetylated H3-K4 residues (Ace), 2 right bars). Bars represent the fraction of modified histone islands measured in HepG2 cells (17), (supplementary material) also bound by TFIID, and which contain either c-Myc, sp1, dual or no sites. We counted 125 such di-methylated (Di), 241 tri-methylated (Tri) and 259 acetylated (Ace) islands. Whereas the fractions c-Myc-only and dual sites is increased in the permissive state, sp1 fractions is unchanged from the facultative to the permissive states.
Functional annotation of sites
Gene Ontology (GO) analysis restricted to chromosomes 21 and 22 (using the GO Tree Machine http://genereg.ornl.gov/gotm) highlights the dominantly proliferation-associated character of the sites. However, the three groups (c-Myc-only, sp1-only and dual sites) represent distinct functional sub-categories: the dual sites are enriched for genes involved in RNA processing, generation of ATP, DNA checkpoints and ribonucleotide biosynthesis; c-Myc-only sites point to the cell cycle genes; lastly, the sp1-only group relates to intracellular transport (GO results are detailed on our online supplement).
Dual c-Myc/sp1 sites are enriched near active promoters
A recent genome-wide study identified active promoters using an antibody against the TAF1 subunit of the transcription initiation complex TFIID in IMR90 fibroblasts (15). Although the chromatin states of fibroblast and lymphocytes lineages might differ considerably, we find correlations between the TFIID sites and our identified sets, indicating that important characteristics of the regulatory landscape appear conserved across lineages. The first observation is that c-Myc or sp1 are significantly more frequent near active promoters, defined here as the 255 TSSs harboring TFIID sites from (15) and representing 15% of all TSSs on chromosomes 21 and 22. Indeed binding of either c-Myc or sp1 occurs in over 60% of the sites occupied by TFIID, as expected from (8), whereas this fraction is lower than 20% in the absence of TFIID (Figure 2B). Moreover, the relative fraction of dual sites when TFIID binds is over 50% (P < 10−9, hypergeometric test), while the three fractions are roughly comparable in absence of TFIID. This analysis suggests interaction between c-Myc and sp1 at core promoters (59).
Permissive chromatin distinguishes c-Myc only and dual c-Myc/sp1 sites
To pursue this hypothesis, we reasoned that the specific role of dual sites might also be reflected in the surrounding chromatin state. We analyze a genome-wide histone profiling study (17) reporting that tri-methylation at H3-K4 lysine residues (and to a lesser extent di-methylation) and acetylation at lysine H3-K9 close to TSSs were hallmarks of active transcriptional units in hepatocellular carcinoma cells (HepG2 line). This was in agreement with the TFIID study (15) in which histone acetylation and methylation (without distinction between di- and tri-methylation) were systematically found near TFIID sites. Despite potential pitfalls in comparing different cell lineages, we find a striking signature in the HepG2 methylation profiles that differentiate the dual sites (Figure 2C). Namely, permissive chromatin islands on chromosomes 21 and 22, characterized by tri-methylation at lysine H3-K4 and acetylation at H3-K9, clearly coincide with a larger fraction of c-Myc or sp1 sites than the ones harbored in the di-methylated H3-K4 islands, characteristic of the less permissive or facultative chromatin state (60). Additionally, the fraction of c-Myc sites is higher in the permissive states, consistent with (61), and this is more pronounced for the dual sites (P < 10−11 for di-methylation; P < 10−16 for tri-methylation; P < 10−15 acetylation; hypergeometric tests).
Tissue-specific expression for c-Myc and sp1 sites
We assess the functionality of the identified ChIP sites by considering the expression profiles of all c-Myc and sp1 sites in a tissue expression compendium (40). We are thus implicitly testing whether binding sites measured in Jurkat cells are functional in other cell types. While this is not expected for all regulators, it may hold here. First, there are many lymphoid-related conditions in the gene expression atlas where we expect similarity in the chromatin states. Second, c-Myc and sp1 are basic transcription factors that mediate generic or conserved functions. Comparing the mean expression levels in all three groups and tissues we find that these are highly correlated with c-Myc mRNA level which probably reflects the connection between c-Myc levels and proliferation (Figure 3A). Moreover while the sp1-only sites have the lowest expression, followed by the c-Myc-only sites, the dual sites are generally expressed at highest levels, noticeably in lymphoid lineages which are closest to Jurkat cells (Figure 3A, tissue track). The association between blood lineage, c-Myc expression and high expression of the dual site targets is quantified in Figure 3B. The mean expression levels of genes with c-Myc sites, or those with dual c-Myc and sp1 sites, are significantly correlated with c-Myc mRNA levels across conditions. For sp1 this correlation is not significant (Figure S7). Interestingly, the dual group is correlated with c-Myc expression with a slope that is ∼30% larger that for c-Myc-only sites, indicating that sp1 may contribute synergistically to the induction by c-Myc. As expected the genes without sites show much weaker correlation. It is also apparent from the conditions with lowest c-Myc mRNA expression that the genes with c-Myc sites, either single or accompanied by sp1 sites, have higher baseline expression than genes without sites, or genes with sp1 only sites (Figure S7). Given that it is highly unlikely that c-Myc sites would systematically hit high affinity probes, this presumably reflects that c-Myc sites are frequent in promoters of housekeeping genes that can be induced by multiple other regulators. A few terminally differentiated conditions appear uncorrelated despite intermediate to high c-Myc expression levels.
Figure 3.

Summary of expression levels for genes with binding sites across tissues. The null, c-Myc-only, sp1-only and dual groups are as in Table 1. They are represented by 31 (c-Myc), 57 (sp1), 57 (dual), 600 (null) probesets in the tissue atlas. The gene expression matrix is condition centered. (A) In all three lanes (c-Myc and sp1 expression, ChIP group and tissue) the horizontal axis represents the 79 tissue conditions from the SymAtlas tissue atlas (40), each represented for the sp1-only, c-Myc-only and dual groups. Ordering is according to increasing mean expression (from left to right) per group and tissue. In the lane ‘ChIP group’, the dual sites cluster at the right end of the scale, and this correlates with high c-Myc expression (blue track, top). Sp1-only sites have generally lower expression followed by c-Myc-only sites which are interspersed. The ‘tissue’ lane emphasizes that blood samples (20/79 samples, shown in red for the lymphoid and orange for the myeloid lineage) are enriched at the high expression end. (B) Quantification of data in (A). The dots show for each condition the mean expression level in each group. The lines show the correlation between the group means and c-Myc mRNA level. Slopes and adjusted R-squared are reported; all correlation are significant (P < 10−9 for the M group, P < 10−10 for the B group and P < 0.0001 for the null group). The mean expressions in c-Myc-only and dual groups correlate well with c-Myc expression levels. The dual group shows the highest slope (0.13) and clear positive outliers in the blood lineage. The weak correlation between the null group and c-Myc mRNA probably reflects indirect regulation. The low outliers in the c-Myc and dual groups coincide with terminally differentiated tissues, e.g. skin, uterus and tongue.
Strong sp1 sites enhance c-Myc susceptibility
Switching from a condition-centered to a gene-centered view, we systematically investigate associations between expression levels of genes and ChIP signals in their promoters. We model the expression levels of all genes in the atlas in function of c-Myc and sp1 mRNA levels using multilinear regression. We aim to test whether a correlation between gene expression and regulator activity reflects the strength of binding sites measured with ChIP. For this, the mRNA levels of the regulators are taken as best proxies for the activity levels of the proteins. The model (M1, methods section) assumes no indirect regulation and measures the gene-specific contributions for each transcription factor. To determine whether the susceptibilities reflect binding strength we use the nominal t scores for binding instead of fixed cutoffs as in Figure 3. We find that ag shows a significant correlation (Figure 4A) with the ChIP signal strength for c-Myc (tMyc) while not significant in the case of sp1 (Figure 4B), even though the sp1-bound promoters exhibit weak systematic positive bg. Analysis shows that for genes with dual sites, c-Myc susceptibility generally increases with the strength of sp1 binding (Figure 4C and D). This synergistic trend is confirmed in a stratified representation showing that ag for promoters with both strong c-Myc and sp1 ChIP sites (the B group) is higher than for promoters with weaker sites (Figure 4E). The regression coefficients for genes in group B are listed in Table S1. The susceptibility to sp1 mRNA level does not show similar differences, although the sp1 sites are subject to a slight increase in bg compared to c-Myc sites (Figure 4F). Turning to the significance of the regression parameters ag and bg, we find that the total fraction of genes that correlate significantly with c-Myc is about 65%, while only about 20% correlate with sp1 (Figure S10). For c-Myc, this fraction increases in the c-Myc only (76%, P = 0.09, hypergeometric test) and dual groups (87%, P = 0.025), while bg does not show large differences across groups. Interestingly, while there is overall bias for positive correlations (∼65% for both ag and bg), the fraction of positive ag is significantly enriched in the c-Myc only group (84%, P = 0.01) even more so for the dual sites (91%, P = 0.005). Finally the fraction with positive bg is highest (86%, P = 0.026) for the sp1-only sites.
Figure 4.

Relation between target expression, regulator expression levels and ChIP- binding strength for all genes. (A–B) Susceptibilities versus the strength of the ChIP- binding sites (t parameter) for c-Myc (A) and sp1 (B). Each dot is one TSS represented by the highest t score occurring in a fixed −1.5 to +1.5 kb window. Gray line show correlation for c-Myc (r2 = 0.26, P = 10−8) while that for sp1 is not significant. (C) Strength of c-Myc (tMyc) versus sp1 (tsp1) sites. Colored grid indicates the mean of the c-Myc susceptibility ag in each square. Red indicates positive and green negative mean values. Saturating colors represent absolute means ≥0.33. (D) c-Myc sites for two cutoffs (tMyc > 6 in black; tMyc > 9 in red) are binned according to sp1 binding. The smoothed mean (loess regression) of ag in function of tsp1 shows increasing average ag. The increase is more pronounced for stronger c-Myc sites (red). (E–F) Boxplots for the gene susceptibilities ag and bg stratified in groups. To emphasize the dependence on site strength we define groups as follows: the null group (Ø) has tMyc < 9 and tsp1 < 9; the S group has tsp1 > 9; the M group has tMyc > 9; the B group has both tMyc > 9 and tsp1 > 9. Groups are mutually exclusive and group size is indicated above the panels. (E) The distribution for ag shifts upwards: the B group has the highest median followed by the M group. (F) The distribution for bg shows no similar behavior. Comparable results are obtained with different processing of the raw ChIP data (Figures S8 and S9).
DISCUSSION
We combined genome-wide protein–DNA interaction data for the transcription regulators c-Myc, sp1 and for the TAF1 subunit of the TFIID complex with histone modifications and human expression data to establish the functional correspondence between physical binding, promoter activity and transcriptional regulation. Using sliding linear modeling (SLM) and classifying binding sites in Jurkat cells as sp1-only, c-Myc-only or dual, we uncovered that sites with both factors within 1 kb of each other showed several distinct features compared to the single regulator sites. Specifically, the dual sites showed a strong correlation with TFIID-bound promoters, even if the latter were measured in IMR90 fibroblasts. The dual sites also showed preference for permissive chromatin states as measured in HepG2 cells and overall higher degree of conservation between human and rodents. When assessing the relationship between c-Myc, sp1 sites and promoter activity, we have taken the risk of comparing different tissues: sp1 and c-Myc sites are from Jurkat cells, the TFIID sites from fibroblasts and methylation status was measured in HepG2 cells. Surprisingly the consistent distinction of dual sites (Figure 2B and C) indicates that these tissues share comparable chromatin states, which might be rooted in the general proliferating state of immortalized cell lines. Taken together, these findings pointed toward specific functional characteristics of dual sites. Nevertheless, to minimize caveats from difficult comparisons, we have not used the HepG2 and fibroblasts in the study of the expression data.
Classes of promoters were monitored across large expression datasets to study the relationship between promoter-binding configurations and gene expression. By assuming that many sites measured in Jurkat cells would also be found in other cell lines, linear models were used to determine the susceptibility of sites to the levels of the corresponding regulators as measured in the tissue atlas. We found that for genes harboring both factors, stronger sp1 binding increased the correlation between c-Myc activity and target expression levels. Furthermore, our analysis of correlation with regulator mRNA levels supports the notion that functional c-Myc sites are not strictly cell-type specific, which is consistent with its involvement in basic cellular functions such as growth or transcription. Specifically, the expression levels of genes with c-Myc site correlate well with c-Myc expression levels in the majority of tissues, with some exceptions. These insensitive conditions coincide with terminally differentiated tissues in which chromatin remodeling could prevent response to c-Myc while the conditions with open chromatin respond in a graded manner to the regulator level according to the proposed model (62).
This analysis generalizes an earlier ChIP study (8) where correlation between c-Myc levels and expression of c-Myc sites was discussed. Importantly, we add the dependency on sp1 sites using multilinear regression. Incidentally cooperativity between c-Myc and sp1 has been dissected in the hTert gene (63) which might provide a mechanistic basis for the observed behavior of dual sites. Cooperativity with sp1 has also been reported for other bHLH family members, notably ARNT (64) and SREBP (65). In agreement with studies of the c-Myc regulatory networks (33) Gene Ontology analysis identified biological processes linked to proliferation. Our analysis finds the presence of c-Myc in 16% of all TSSs (8,35), supporting the view that c-Myc might directly interact with the core transcription machinery to induce gene expression and that it might be helped in this task by sp1. In conclusion, the regulatory logic, or the way the c-Myc and sp1 signals are integrated at human promoters leads to complex relationships between transcription- factor binding and expression phenotypes. As ChIP experiments for multiple regulators in mammalian tissue are produced (14) we expect similar analyses to probe further combinatorial dependencies in mammalian gene regulatory systems.
SUPPLEMENTARY DATA
Supplementary Data is available at NAR online.
The complete lists of binding sites, together with the software source code, the Gene Ontology analysis and the comparison with previous studies can be found at: http://wiki.epfl.ch/naeflab.
ACKNOWLEDGEMENTS
We thank Philipp Bucher for useful discussions, Ioannis Xenarios, Otto Hagenbuechle, Mirko Bischofberger and Jacques Rougemont for insightful comments on the manuscript. This work was supported by the NCCR Molecular Oncology program from the Swiss National Science Foundation. The permutation null model was computed on Intel/HP cluster at the Vital-IT facilities at the Swiss Institute of Bioinformatics (SIB). Funding to the pay the Open Access publication charge was provided by the NCCR Molecular Oncology program.
Conflict of interest statement. None declared.
REFERENCES
- 1.Levine M, Tjian R. Transcription regulation and animal diversity. Nature. 2003;424:147–151. doi: 10.1038/nature01763. [DOI] [PubMed] [Google Scholar]
- 2.Istrail S, Davidson EH. Logic functions of the genomic cis-regulatory code. Proc. Natl. Acad Sci. U.S.A. 2005;102:4954–4959. doi: 10.1073/pnas.0409624102. [DOI] [PMC free article] [PubMed] [Google Scholar]
- 3.Blais A, Dynlacht BD. Constructing transcriptional regulatory networks. Genes. Dev. 2005;19:1499–1511. doi: 10.1101/gad.1325605. [DOI] [PubMed] [Google Scholar]
- 4.Siggia ED. Computational methods for transcriptional regulation. Curr. Opin. Genet. Dev. 2005;15:214–221. doi: 10.1016/j.gde.2005.02.004. [DOI] [PubMed] [Google Scholar]
- 5.Harbison CT, Gordon DB, Lee TI, Rinaldi NJ, Macisaac KD, Danford TW, Hannett NM, Tagne JB, Reynolds DB, et al. Transcriptional regulatory code of a eukaryotic genome. Nature. 2004;431:99–104. doi: 10.1038/nature02800. [DOI] [PMC free article] [PubMed] [Google Scholar]
- 6.Lee TI, Rinaldi NJ, Robert F, Odom DT, Bar-Joseph Z, Gerber GK, Hannett NM, Harbison CT, Thompson CM, et al. Transcriptional regulatory networks in Saccharomyces cerevisiae. Science. 2002;298:799–804. doi: 10.1126/science.1075090. [DOI] [PubMed] [Google Scholar]
- 7.Ren B, Robert F, Wyrick JJ, Aparicio O, Jennings EG, Simon I, Zeitlinger J, Schreiber J, Hannett N, et al. Genome-wide location and function of DNA binding proteins. Science. 2000;290:2306–2309. doi: 10.1126/science.290.5500.2306. [DOI] [PubMed] [Google Scholar]
- 8.Li Z, Van Calcar S, Qu C, Cavenee WK, Zhang MQ, Ren B. A global transcriptional regulatory role for c-Myc in Burkitt's lymphoma cells. Proc. Natl. Acad. Sci. U.S.A. 2003;100:8164–8169. doi: 10.1073/pnas.1332764100. [DOI] [PMC free article] [PubMed] [Google Scholar]
- 9.Martone R, Euskirchen G, Bertone P, Hartman S, Royce TE, Luscombe NM, Rinn JL, Nelson FK, Miller P, et al. Distribution of NF-kappaB-binding sites across human chromosome 22. Proc. Natl. Acad Sci. U. S. A. 2003;100:12247–12252. doi: 10.1073/pnas.2135255100. [DOI] [PMC free article] [PubMed] [Google Scholar]
- 10.Cawley S, Bekiranov S, Ng HH, Kapranov P, Sekinger EA, Kampa D, Piccolboni A, Sementchenko V, Cheng J, et al. Unbiased mapping of transcription factor binding sites along human chromosomes 21 and 22 points to widespread regulation of noncoding RNAs. Cell. 2004;116:499–509. doi: 10.1016/s0092-8674(04)00127-8. [DOI] [PubMed] [Google Scholar]
- 11.Euskirchen G, Royce TE, Bertone P, Martone R, Rinn JL, Nelson FK, Sayward F, Luscombe NM, Miller P, et al. CREB binds to multiple loci on human chromosome 22. Mol. Cell Biol. 2004;24:3804–3814. doi: 10.1128/MCB.24.9.3804-3814.2004. [DOI] [PMC free article] [PubMed] [Google Scholar]
- 12.Carroll JS, Liu XS, Brodsky AS, Li W, Meyer CA, Szary AJ, Eeckhoute J, Shao W, Hestermann EV, et al. Chromosome-wide mapping of estrogen receptor binding reveals long-range regulation requiring the forkhead protein FoxA1. Cell. 2005;122:33–43. doi: 10.1016/j.cell.2005.05.008. [DOI] [PubMed] [Google Scholar]
- 13.Odom DT, Zizlsperger N, Gordon DB, Bell GW, Rinaldi NJ, Murray HL, Volkert TL, Schreiber J, Rolfe PA, et al. Control of pancreas and liver gene expression by HNF transcription factors. Science. 2004;303:1378–1381. doi: 10.1126/science.1089769. [DOI] [PMC free article] [PubMed] [Google Scholar]
- 14.Odom DT, Dowell RD, Jacobsen ES, Nekludova L, Rolfe PA, Danford TW, Gifford DK, Fraenkel E, Bell GI, et al. Core transcriptional regulatory circuitry in human hepatocytes. Mol. Syst. Biol. 2006;2:E1–E5. doi: 10.1038/msb4100059. [DOI] [PMC free article] [PubMed] [Google Scholar]
- 15.Kim TH, Barrera LO, Zheng M, Qu C, Singer MA, Richmond TA, Wu Y, Green RD, Ren B. A high-resolution map of active promoters in the human genome. Nature. 2005;436:876–880. doi: 10.1038/nature03877. [DOI] [PMC free article] [PubMed] [Google Scholar]
- 16.Brodsky AS, Meyer CA, Swinburne IA, Hall G, Keenan BJ, Liu XS, Fox EA, Silver PA. Genomic mapping of RNA polymerase II reveals sites of co-transcriptional regulation in human cells. Genome Biol. 2005;6:R64. doi: 10.1186/gb-2005-6-8-r64. [DOI] [PMC free article] [PubMed] [Google Scholar]
- 17.Bernstein BE, Kamal M, Lindblad-Toh K, Bekiranov S, Bailey DK, Huebert DJ, McMahon S, Karlsson EK, Kulbokas EJ, 3rd, et al. Genomic maps and comparative analysis of histone modifications in human and mouse. Cell. 2005;120:169–181. doi: 10.1016/j.cell.2005.01.001. [DOI] [PubMed] [Google Scholar]
- 18.Tavazoie S, Hughes JD, Campbell MJ, Cho RJ, Church GM. Systematic determination of genetic network architecture. Nat. Genet. 1999;22:281–285. doi: 10.1038/10343. [DOI] [PubMed] [Google Scholar]
- 19.Segal E, Friedman N, Koller D, Regev A. A module map showing conditional activity of expression modules in cancer. Nat. Genet. 2004;36:1090–1098. doi: 10.1038/ng1434. [DOI] [PubMed] [Google Scholar]
- 20.Ihmels J, Friedlander G, Bergmann S, Sarig O, Ziv Y, Barkai N. Revealing modular organization in the yeast transcriptional network. Nat. Genet. 2002;31:370–377. doi: 10.1038/ng941. [DOI] [PubMed] [Google Scholar]
- 21.Beer MA, Tavazoie S. Predicting gene expression from sequence. Cell. 2004;117:185–198. doi: 10.1016/s0092-8674(04)00304-6. [DOI] [PubMed] [Google Scholar]
- 22.Bussemaker HJ, Li H, Siggia ED. Regulatory element detection using correlation with expression. Nat. Genet. 2001;27:167–171. doi: 10.1038/84792. [DOI] [PubMed] [Google Scholar]
- 23.Conlon EM, Liu XS, Lieb JD, Liu JS. Integrating regulatory motif discovery and genome-wide expression analysis. Proc. Natl. Acad Sci. U.S.A. 2003;100:3339–3344. doi: 10.1073/pnas.0630591100. [DOI] [PMC free article] [PubMed] [Google Scholar]
- 24.Gao F, Foat BC, Bussemaker HJ. Defining transcriptional networks through integrative modeling of mRNA expression and transcription factor binding data. BMC Bioinformatics. 2004;5:31. doi: 10.1186/1471-2105-5-31. [DOI] [PMC free article] [PubMed] [Google Scholar]
- 25.Galbraith SJ, Tran LM, Liao JC. Transcriptome network component analysis with limited microarray data. Bioinformatics. 2006;22:1886–1894. doi: 10.1093/bioinformatics/btl279. [DOI] [PubMed] [Google Scholar]
- 26.Das D, Banerjee N, Zhang MQ. Interacting models of cooperative gene regulation. Proc. Natl. Acad Sci. U.S.A. 2004;101:16234–16239. doi: 10.1073/pnas.0407365101. [DOI] [PMC free article] [PubMed] [Google Scholar]
- 27.Bar-Joseph Z, Gerber G, Lee T, Rinaldi N, Yoo J, Robert F, Gordon D, Fraenkel E, Jaakkola T, et al. Computational discovery of gene modules and regulatory networks. 2003;21:1337–1342. doi: 10.1038/nbt890. [DOI] [PubMed] [Google Scholar]
- 28.Luscombe NM, Babu MM, Yu H, Snyder M, Teichmann SA, Gerstein M. Genomic analysis of regulatory network dynamics reveals large topological changes. Nature. 2004;431:308–312. doi: 10.1038/nature02782. [DOI] [PubMed] [Google Scholar]
- 29.Smith AD, Sumazin P, Das D, Zhang MQ. Mining ChIP-chip data for transcription factor and cofactor binding sites. Bioinformatics. 2005;21(Suppl 1):i403–i412. doi: 10.1093/bioinformatics/bti1043. [DOI] [PubMed] [Google Scholar]
- 30.Henriksson M, Luscher B. Proteins of the Myc network: essential regulators of cell growth and differentiation. Adv. Cancer Res. 1996;68:109–182. doi: 10.1016/s0065-230x(08)60353-x. [DOI] [PubMed] [Google Scholar]
- 31.Adhikary S, Marinoni F, Hock A, Hulleman E, Popov N, Beier R, Bernard S, Quarto M, Capra M, et al. The ubiquitin ligase HectH9 regulates transcriptional activation by Myc and is essential for tumor cell proliferation. Cell. 2005;123:409–421. doi: 10.1016/j.cell.2005.08.016. [DOI] [PubMed] [Google Scholar]
- 32.Raetz EA, Kim MK, Moos P, Carlson M, Bruggers C, Hooper DK, Foot L, Liu T, Seeger R, et al. Identification of genes that are regulated transcriptionally by Myc in childhood tumors. Cancer. 2003;98:841–853. doi: 10.1002/cncr.11584. [DOI] [PubMed] [Google Scholar]
- 33.Basso K, Margolin AA, Stolovitzky G, Klein U, Dalla-Favera R, Califano A. Reverse engineering of regulatory networks in human B cells. Nat. Genet. 2005;37:382–390. doi: 10.1038/ng1532. [DOI] [PubMed] [Google Scholar]
- 34.Menssen A, Hermeking H. Characterization of the c-MYC-regulated transcriptome by SAGE: identification and analysis of c-MYC target genes. Proc. Natl. Acad. Sci. U.S.A. 2002;99:6274–6279. doi: 10.1073/pnas.082005599. [DOI] [PMC free article] [PubMed] [Google Scholar]
- 35.Fernandez PC, Frank SR, Wang L, Schroeder M, Liu S, Greene J, Cocito A, Amati B. Genomic targets of the human c-Myc protein. Genes. Dev. 2003;17:1115–1129. doi: 10.1101/gad.1067003. [DOI] [PMC free article] [PubMed] [Google Scholar]
- 36.Schlosser I, Holzel M, Hoffmann R, Burtscher H, Kohlhuber F, Schuhmacher M, Chapman R, Weidle UH, Eick D. Dissection of transcriptional programmes in response to serum and c-Myc in a human B-cell line. Oncogene. 2005;24:520–524. doi: 10.1038/sj.onc.1208198. [DOI] [PubMed] [Google Scholar]
- 37.Gomez-Roman N, Grandori C, Eisenman RN, White RJ. Direct activation of RNA polymerase III transcription by c-Myc. Nature. 2003;421:290–294. doi: 10.1038/nature01327. [DOI] [PubMed] [Google Scholar]
- 38.Safe S, Abdelrahim M. Sp transcription factor family and its role in cancer. Eur. J. Cancer. 2005;41:2438–2448. doi: 10.1016/j.ejca.2005.08.006. [DOI] [PubMed] [Google Scholar]
- 39.Courey AJ, Holtzman DA, Jackson SP, Tjian R. Synergistic activation by the glutamine-rich domains of human transcription factor Sp1. Cell. 1989;59:827–836. doi: 10.1016/0092-8674(89)90606-5. [DOI] [PubMed] [Google Scholar]
- 40.Su AI, Wiltshire T, Batalov S, Lapp H, Ching KA, Block D, Zhang J, Soden R, Hayakawa M, et al. A gene atlas of the mouse and human protein-encoding transcriptomes. Proc. Natl. Acad Sci. U.S.A. 2004;101:6062–6067. doi: 10.1073/pnas.0400782101. [DOI] [PMC free article] [PubMed] [Google Scholar]
- 41.Karolchik D, Hinrichs AS, Furey TS, Roskin KM, Sugnet CW, Haussler D, Kent WJ. The UCSC Table Browser data retrieval tool. Nucleic Acids Res. 2004;32:D493–496. doi: 10.1093/nar/gkh103. [DOI] [PMC free article] [PubMed] [Google Scholar]
- 42.Schwartz S, Kent WJ, Smit A, Zhang Z, Baertsch R, Hardison RC, Haussler D, Miller W. Human-mouse alignments with BLASTZ. Genome Res. 2003;13:103–107. doi: 10.1101/gr.809403. [DOI] [PMC free article] [PubMed] [Google Scholar]
- 43.Kapranov P, Cawley SE, Drenkow J, Bekiranov S, Strausberg RL, Fodor SP, Gingeras TR. Large-scale transcriptional activity in chromosomes 21 and 22. Science. 2002;296:916–919. doi: 10.1126/science.1068597. [DOI] [PubMed] [Google Scholar]
- 44.Ji H, Wong WH. TileMap: create chromosomal map of tiling array hybridizations. Bioinformatics. 2005;21:3629–3636. doi: 10.1093/bioinformatics/bti593. [DOI] [PubMed] [Google Scholar]
- 45.Keles S, van der Laan MJ, Dudoit S, Cawley SE. Multiple testing methods for ChIP-Chip high density oligonucleotide array data. J. Comput. Biol. 2006;13:579–613. doi: 10.1089/cmb.2006.13.579. [DOI] [PubMed] [Google Scholar]
- 46.David L, Huber W, Granovskaia M, Toedling J, Palm CJ, Bofkin L, Jones T, Davis RW, Steinmetz LM. A high-resolution map of transcription in the yeast genome. Proc. Natl. Acad Sci. U S A. 2006;103:5320–5325. doi: 10.1073/pnas.0601091103. [DOI] [PMC free article] [PubMed] [Google Scholar]
- 47.Huber W, Toedling J, Steinmetz LM. Transcript mapping with high-density oligonucleotide tiling arrays. Bioinformatics. 2006;22:1963–1970. doi: 10.1093/bioinformatics/btl289. [DOI] [PubMed] [Google Scholar]
- 48.Wu Z, Irizarry RA. Stochastic models inspired by hybridization theory for short oligonucleotide arrays. J. Comput. Biol. 2005;12:882–893. doi: 10.1089/cmb.2005.12.882. [DOI] [PubMed] [Google Scholar]
- 49.Naef F, Magnasco MO. Solving the riddle of the bright mismatches: labeling and effective binding in oligonucleotide arrays. Phys. Rev. E. Stat. Nonlin. Soft. Matter. Phys. 2003;68:011906. doi: 10.1103/PhysRevE.68.011906. [DOI] [PubMed] [Google Scholar]
- 50.Johnson WE, Li W, Meyer CA, Gottardo R, Carroll JS, Brown M, Liu XS. Model-based analysis of tiling-arrays for ChIP-chip. Proc. Natl. Acad Sci. U. S. A. 2006;103:12457–12462. doi: 10.1073/pnas.0601180103. [DOI] [PMC free article] [PubMed] [Google Scholar]
- 51.Wu Z, Irizarry RA, Gentleman R, Murillo FM, Spencer F. Johns Hopkins University, Dept. of Biostatistics Working papers; 2004. A model based background adjustment for oligonucleotide Expression arrays; p. 1. [Google Scholar]
- 52.Bolstad BM, Collin F, Simpson KM, Irizarry RA, Speed TP. Experimental design and low-level analysis of microarray data. Int. Rev. Neurobiol. 2004;60:25–58. doi: 10.1016/S0074-7742(04)60002-X. [DOI] [PubMed] [Google Scholar]
- 53.Irizarry RA, Hobbs B, Collin F, Beazer-Barclay YD, Antonellis KJ, Scherf U, Speed TP. Exploration, normalization, and summaries of high density oligonucleotide array probe level data. Biostatistics. 2003;4:249–264. doi: 10.1093/biostatistics/4.2.249. [DOI] [PubMed] [Google Scholar]
- 54.Li C, Wong WH. Model-based analysis of oligonucleotide arrays: expression index computation and outlier detection. Proc. Natl. Acad Sci. U.S.A. 2001;98:31–36. doi: 10.1073/pnas.011404098. [DOI] [PMC free article] [PubMed] [Google Scholar]
- 55.Hekstra D, Taussig AR, Magnasco M, Naef F. Absolute mRNA concentrations from sequence-specific calibration of oligonucleotide arrays. Nucleic Acids Res. 2003;31:1962–1968. doi: 10.1093/nar/gkg283. [DOI] [PMC free article] [PubMed] [Google Scholar]
- 56.Cleveland W, Loader C. Technical Report. Murray Hill, NY: AT&T Bell Laboratories; 1995. Smoothing by local regression: Principles and methods. [Google Scholar]
- 57.Korn EL, Troendle JF, McShane LM, Simon R. Controlling the number of false discoveries: application to high-dimensional genomic data. Journal of Statistical Planning and Inference. 2004;124:379–398. [Google Scholar]
- 58.Ge Y, Dudoit S, Speed TP. Resampling-based Multiple Testing for Microarray Data Analysis. Test. 2003;12:1–77. [Google Scholar]
- 59.Feng XH, Liang YY, Liang M, Zhai W, Lin X. Direct interaction of c-Myc with Smad2 and Smad3 to inhibit TGF-beta-mediated induction of the CDK inhibitor p15(Ink4B) Mol. Cell. 2002;9:133–143. doi: 10.1016/s1097-2765(01)00430-0. [DOI] [PubMed] [Google Scholar]
- 60.Fischle W, Wang Y, Allis CD. Histone and chromatin cross-talk. Curr. Opin. Cell Biol. 2003;15:172–183. doi: 10.1016/s0955-0674(03)00013-9. [DOI] [PubMed] [Google Scholar]
- 61.Guccione E, Martinato F, Finocchiaro G, Luzi L, Tizzoni L, Dall’ Olio V, Zardo G, Nervi C, Bernard L, Amati B. Myc-binding-site recognition in the human genome is determined by chromatin context. Nat. Cell Biol. 2006;8:764–770. doi: 10.1038/ncb1434. [DOI] [PubMed] [Google Scholar]
- 62.Cunliffe VT. Memory by modification: the influence of chromatin structure on gene expression during vertebrate development. Gene. 2003;305:141–150. doi: 10.1016/s0378-1119(03)00386-x. [DOI] [PubMed] [Google Scholar]
- 63.Kyo S, Takakura M, Taira T, Kanaya T, Itoh H, Yutsudo M, Ariga H, Inoue M. Sp1 cooperates with c-Myc to activate transcription of the human telomerase reverse transcriptase gene (hTERT) Nucleic Acids Res. 2000;28:669–677. doi: 10.1093/nar/28.3.669. [DOI] [PMC free article] [PubMed] [Google Scholar]
- 64.Kobayashi A, Sogawa K, Fujii-Kuriyama Y. Cooperative interaction between AhR.Arnt and Sp1 for the drug-inducible expression of CYP1A1 gene. J. Biol. Chem. 1996;271:12310–12316. doi: 10.1074/jbc.271.21.12310. [DOI] [PubMed] [Google Scholar]
- 65.Yieh L, Sanchez HB, Osborne TF. Domains of transcription factor Sp1 required for synergistic activation with sterol regulatory element binding protein 1 of low density lipoprotein receptor promoter. Proc. Natl. Acad Sci. U.S.A. 1995;92:6102–6106. doi: 10.1073/pnas.92.13.6102. [DOI] [PMC free article] [PubMed] [Google Scholar]