

Abstract
Objectives
To explore the atrophy rate of entorhinal cortex (ERC) in AD and normal aging and assess the value of rate measurement of ERC atrophy for classifying subjects with AD from cognitively normal (CN) control subjects.
Methods
Twenty-one AD patients and 23 CN subjects had MRI scans and clinical evaluations twice within 1.8 ± 0.6 years. ERC volumes were manually measured on volumetric T1-weighted MR images.
Results
Patients with AD had a greater annual percentage volume change of ERC than CN subjects on both sides (left: 6.8 ± 4.3%/year for AD vs 1.4 ± 2.5%/year for CN [F1,42 = 25.6, p < 0.001]; right: 6.3 ± 3.3%/year for AD vs 1.4 ± 2.3%/year for CN [F1,42 = 25.6, p < 0.001]). Furthermore, increased ERC atrophy rate was correlated (r = −0.56, p < 0.01) with decreased memory performance in AD. CN subjects had on average annual ERC atrophy rates greater than zero (p < 0.01). Baseline volume of ERC predicted atrophy rate of ERC (left: r = −0.53, p < 0.01; right: r = −0.42, p < 0.05) in CN subjects but not in AD subjects. Using ERC baseline volumes alone resulted in 77% overall correct classification (p < 0.01) between AD and CN subjects, with 76% sensitivity and 78% specificity and an area under receiver operator characteristic (ROC) curve of 0.83. Adding annual atrophy rate of ERC to the model accounted for most of the variance (p < 0.01), diminishing contributions from baseline volume and yielding 82% overall classification, with 76% sensitivity and 86% specificity and an area under the ROC curve of 0.93.
Conclusion
ERC volume loss over time may be a better indicator for AD than cross-sectional measurements.
Neurohistologic studies of patients with AD show that the entorhinal cortex (ERC), a structure important for memory function, is particularly vulnerable to neurofibrillary tangle pathology and neuron loss.1,2 Furthermore, there is increasing evidence that the ERC is an early site for AD pathology,3,4 before the disease extends to the hippocampus and neocortex. Consistent with this theory, cross-sectional MRI studies showed that patients with AD had smaller ERC volumes than cognitively normal (CN) subjects.5–8 However, a substantial overlap in ERC volumes between AD and control subjects existed, presumably because of the biologic variability of ERC size but perhaps also because some normal control subjects might have prodromal AD, leading to atrophy of ERC. Despite this overlap, ERC volume was helpful in predicting subsequent development of dementia,9 implying that ERC atrophy may precede cognitive impairment. Longitudinal MRI studies have been performed on a number of patient groups. There are several reports of increased rates of atrophy of the whole brain10–14 and of the hippocampus15,16 and corpus callosum17 in patients with AD and in subjects with mild cognitive impairment. However, the rate of ERC atrophy in normal aging and AD is unclear.
The overall goal of this project was to measure rates of ERC atrophy in AD and elderly control subjects. Although the ERC is a discrete, histologically described region of the cortex, there are no unique image features that identify the ERC on MRI. Therefore, to define a region on MRI that represents ERC, anatomic landmarks usually are used to manually trace the boundaries of this structure. As the locations of these landmarks may vary between subjects and slice angulations may vary between MRI scans, it is often difficult for raters to draw the boundaries of ERC consistently, introducing measurement errors. This could limit accuracy in measuring longitudinal volume changes of ERC in individual subjects. To reduce this problem, we therefore co-registered the MRI scans of each subject using rigid body transformations,18,19 so that a rater who was blinded to the chronologic order of the MRI data could identify the ERC landmarks simultaneously on the serial MRI scans of each subject. We then tested the following hypotheses: first, that rate of ERC atrophy would be higher in AD than in control subjects; second, that classification of AD from control subjects using longitudinal data would be better than classification using cross-sectional data; furthermore, we sought to determine the extent to which baseline volume of the ERC would predict the rate of atrophy.
Subtle decline of memory function commonly occurs also in normal aging in the absence of a progression to AD.20,21 A neurohistologic study of normal elderly, however, found no significant neuron loss in ERC,4 whereas another study reported small degrees of ERC atrophy with aging.22 Because autopsy studies are cross-sectional by nature, it could not be determined if the small ERC volumes were the result from a decline over time or represented the size at baseline. Therefore, another hypothesis was that CN elderly have rates of ERC atrophy that are significantly greater than zero.
Materials and methods
Twenty-one patients with AD (74.5 ± 6.7 years old; 9 men and 12 women) and 23 CN subjects (76.5 ± 7.9 years old; 16 men and 7 women) were studied twice within on average 1.8 ± 0.6 years. The AD patients were recruited from the Memory and Aging Center of the University of California at San Francisco (UCSF) and the Alzheimer Center of the University of California at Davis (UCD) and received the standard battery of cognitive and neuropsychological tests in the referred centers. A clinical diagnosis of AD was established according to the criteria by the National Institute of Neurological and Communication Disorders and Stroke/Alzheimer’s Disease and Related Disorders Association.23 Of 21 patients, 18 were diagnosed with probable AD and 3 with possible AD. The severity of dementia for each patient was graded by the Mini-Mental State Examination (MMSE).24 The CN subjects were recruited from the community and received the same standard neuropsychological examinations as the AD patients at the centers. CN subjects had cognitive test scores within the normal range and no clinical history of alcoholism, psychiatric illness, epilepsy, hypertension, diabetes, major heart disease, or head trauma. To evaluate specifically hippocampal-dependent memory performance, the Delayed List Recall Test (DLR) from the word list learning tests of the Memory Assessment Scales was used.25 Although both recruitment centers (UCSF and UCD) used the DLR, the number of words that needed to be remembered was slightly different between the centers (9 words at UCSF, 12 words at UCD). To standardize DLR results between the centers, memory scores from each center were therefore normalized to the maximum number of words on the list. One AD patient and one CN subject, who did not speak English very well and therefore did not perform the DLR, were not included in the analysis. All subjects were examined twice in the centers before MRI scans, and no subject had a change in diagnosis between the first and second examination. In addition, a neuroradiologist evaluated the MRI data of all subjects to exclude other major neuropathologies. All subjects or their guardians gave written informed consent before participation in the study, which was approved by the Committee of Human Research at UCSF and UCD.
MRI data were obtained on a 1.5 T Siemens Vision System (Siemens, Iselin, NJ), using a standard quadrature head coil. A vacuum-molded head holder (Vac-Pac; Olympic Medical, Seattle, WA) was employed to restrict head movements. Structural MRI data were acquired using a double spin echo (DSE) sequence with repetition time (TR)/first echo time (TE1)/second TE (TE2) = 2,500/20/80 milliseconds, 1.00 × 1.25-mm2 in-plane resolution, and about 50 contiguous 3.00-mm-thick axial slices oriented along the optic nerve as seen from a midsection sagittal scout MR image. In addition, a volumetric magnetization-prepared rapid gradient echo (MPRAGE) sequence was acquired, with TR/TE/TI = 10/7/300 milliseconds, 15° flip angle, 1.00 × 1.00-mm2 in-plane resolution, and 1.40-mm-thick coronal partitions and oriented orthogonal to the image planes of DSE.
Volume measurements of the ERC were performed manually by tracing the ERC boundaries on MPRAGE images, following the protocol published before.26 In brief, the ERC was measured from one section caudal to the level of the limen insulae and until the section behind the posterior limit of the gyrus intralimbicus. The medial margin of the ERC was marked along the ventral border of the gyrus semilunaris, that is, the fundus of the sulcus semiannularis. The lateral margin of the ERC was in the medial bank of the collateral sulcus, where it bordered the perirhinal cortex. The border of the ERC and perirhinal cortex depended on the depth of the collateral sulcus.26 Figure 1 depicts the ERC measurement over time in the CN and AD subjects. The total intracranial volume (TIV) was determined based on the tissue-segmented MRI data.27 To account for variations in head size between subjects, cross-sectional volumes were normalized to the TIV of each subject, according to
Figure 1.

Entorhinal cortex measurement over time in a 72-year-old cognitively normal subject (follow up = 2.2 years) and a 72-year-old AD patient (follow up = 2 years). Cognitively normal subject = top row; AD patient = bottom row; first scans = left column; second scans = right column.
where Vi0 is an absolute volume and TIV/TIVi is an index of a subject’s TIV to the mean TIV of the group (patients and controls combined). To improve consistency in determining ERC boundaries for longitudinal measurements, an experienced rater traced the ERC on longitudinal MPRAGE images that were co-registered and displayed simultaneously on a computer screen for each subject. Furthermore, image co-registration and display were done in random chronologic order to maintain blindness of the rater toward the order of the studies. ERC volume change over time of each subject was expressed as an annual percentage rate of change, according to the following rate of change:
Here, rVOL is the annual percentage change of ERC, VOL1 and VOL2 are ERC volumes in cubic millimeters at first and second scans, and T is the interscan interval in years. As the subject’s TIV should not change between studies, longitudinal data, when expressed as percentage rate of change, are automatically corrected for TIV. Reliability of volume measurements of the ERC was determined on nine volunteers between 22 and 84 years of age (mean age 44 ± 18 years, two men and seven women) who had MRI scans twice within 1 hour in separate sessions. The intra-class correlation coefficient of ERC measurements was 0.99.
Statistical analysis
Differences in atrophy rate and baseline volume of the left and right ERC between the groups were tested using multivariate analysis of variance (MANOVA), accounting for age and sex variations. The one-sample t-test was used to determine whether CN subjects had ERC rates different from zero. To test the relationship between atrophy rate and baseline volume of ERC, linear regression was used to predict atrophy rates from baseline volumes. To compare rates and baseline volumes between the groups independently of physical units, both measures were transformed into Z-scores and differences tested using ANOVA. Rates of ERC atrophy and baseline volume of individual subjects were transformed into Z-scores according to
Here, Z(ERCi) is the Z-score of the rate of atrophy or baseline volume of ERC in a subject and ERCCN and SDCN are mean and SD of the rate of atrophy or baseline volume of ERC in control subjects. The powers of the annual rate of atrophy and baseline volume of ERC for discriminating AD patients from CN subjects were tested using logistic regression analysis in terms of sensitivity, specificity, and overall correct classification. Furthermore, receiver operator characteristic (ROC) analysis was performed to express group separation in terms of area under the ROC curve. All data are presented as means ± SD.
Results
The demographic characteristics of the subjects are listed in table 1. The groups were comparable with respect to age (p = 0.2) and sex distribution (χ2 = 1.6, p = 0.2). As expected, patients with AD had lower MMSE scores (p < 0.001) and lower DLR scores (p < 0.001) than CN subjects. Also listed in table 1 are the average intervals between MRI scans for AD and CN.
Table 1.
Demographics of AD patients and cognitively normal control subjects (CN)
| Subjects | n (% women) | Age, y | MMSE score | DLR, % | Scan interval, y |
|---|---|---|---|---|---|
| CN | 23 (30) | 76.5 ± 7.9 | 29 ± 1 | 88 ± 18 | 1.8 ± 0.5 |
| AD | 21 (52) | 74.5 ± 6.7 | 22 ± 7 | 21 ± 25 | 1.8 ± 0.7 |
Data are presented as means ± SD.
MMSE = Mini-Mental State Examination; DLR = Delayed List Recall Test,25 expressed as percentage of maximum number of words in the lists.
Annual percentage change and baseline volume of left and right ERC in AD and CN are listed in table 2. Annual percentage changes of ERC were greater on both sides (left: F1,42 = 25.6, p < 0.001; right: F1,42 = 32.4, p < 0.001) in AD patients when compared with CN subjects. The difference remained significant after accounting for age and sex. There was no age or sex effect on rate of ERC atrophy in both the left and the right sides. Differences of the rates between the left and right ERC were not significant. In addition, annual percentage change of ERC in CN was greater than zero (p < 0.01). However, not all CN subjects had positive rates of ERC atrophy, implying that there might be differences between control subjects, depending whether atrophy rates were positive or not. Age, sex, and MMSE scores did not account for differences in rates of ERC atrophy between control groups with positive and negative rates of ERC atrophy. However, 5 of 17 subjects with positive rates of ERC atrophy had DLR scores of <80%, indicating some problems with memory. In contrast, the five subjects with negative rates of ERC atrophy all had DLR scores of >80%, indicating good memory performance. Consistent with previous MRI reports from cross-sectional studies,6 AD patients had smaller ERC volumes on both the left (F1,42 = 14.6, p < 0.001) and the right (F1,42 = 14.8, p < 0.001) sides compared with CN subjects. This difference also remained significant after accounting for age and sex. Effects of side were not significant. Furthermore, annual percentage change and baseline volumes of ERC were inversely correlated in CN subjects on both sides (left: r = −0.53, p < 0.01; right: r = −0.42, p < 0.05). In contrast, no relationship of annual percentage change and baseline volume of ERC was found in AD. The relationship between annual percentage change and baseline volume of ERC with left and right sides combined in AD and CN subjects is depicted in figure 2.
Table 2.
Percentage annual rate of atrophy (rate) and baseline volume (base) of entorhinal cortex in AD patients and cognitively normal control subjects (CN)
| Subjects | Left rate* | Right rate* | Left base† | Right base† |
|---|---|---|---|---|
| CN | 1.4 ± 2.5 | 1.4 ± 2.3 | 1,179 ± 369 | 1,174 ± 363 |
| AD | 6.8 ± 4.3‡ | 6.3 ± 3.3‡ | 819 ± 215‡ | 770 ± 330‡ |
Data are presented as means ± SD.
In % change/y from baseline volume.
In mm3.
p < 0.01 AD vs CN.
Figure 2.

Relationship between atrophy rate and baseline volume of entorhinal cortex in each AD patient and cognitively normal control subject. ○ = cognitively normal subject; ● = AD patient.
In AD, increased annual percentage ERC change was correlated (r = −0.56, p = 0.01) with decreased memory performance at baseline, as measured by DLR. The relationship between annual percentage ERC change and DLR scores is depicted in figure 3. In contrast to annual percentage ERC change, volumes of ERC were not significantly correlated with DLR scores in AD. MMSE scores, which are generally used to assess dementia severity, did not correlate with annual percentage ERC change or volume of ERC. Furthermore, neither DLR nor MMSE scores were correlated with annual percentage ERC change or volume of ERC in CN subjects.
Figure 3.
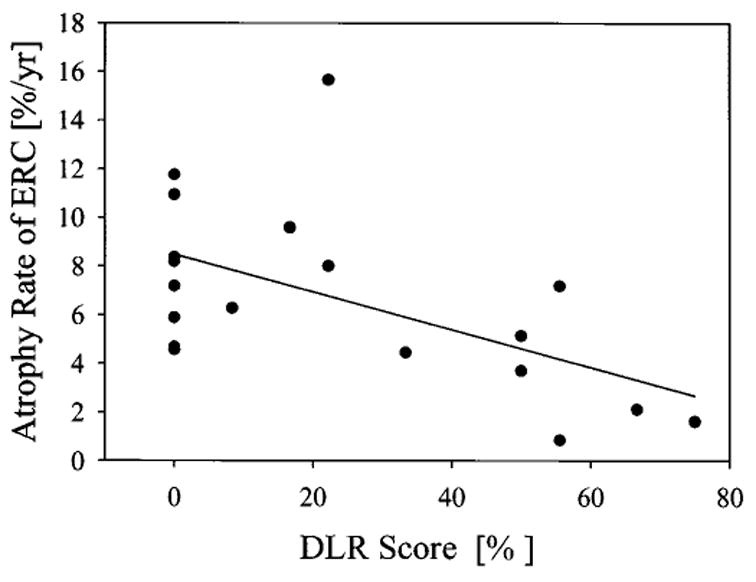
Relationship between atrophy rates of entorhinal cortex and memory performance in AD patients. Memory performance was measured with a Delayed List Recall Test (DLR)25 of words, and DLR scores were expressed as percentage of maximum number of words on a list that needed to be remembered.
For testing discrimination between the groups based on ERC rates and baseline volumes, left and right ERC measures were combined because no significant effect of side was observed. Discrimination between AD and CN subjects based on ERC baseline volume or annual percentage change is depicted in figure 4. This demonstrates a better separation between AD and CN subjects with annual percentage change than with baseline volume. The difference between annual percentage change and baseline volume measures in separating the groups was significant (F1,85 = 6.2, p = 0.01). Sensitivity, specificity, and overall correct classification in separating AD and CN with rates and baseline volumes of ERC are listed in table 3. Also listed in table 3 is the area under the curve from an ROC analysis. Using ERC baseline volumes alone resulted in 77% overall correct classification (p < 0.01) of the subjects by logistic regression, with 76% sensitivity, 78% specificity, and an area under the ROC curve of 0.83. Adding annual percentage change of ERC to the model accounted for most of the variance (p < 0.01), diminishing contributions from baseline volume. This yielded an 82% overall correct classification, with 76% sensitivity and 86% specificity and an area under the ROC curve of 0.93.
Figure 4.

Z-Score of percent annual rate of atrophy and baseline volume of entorhinal cortex in AD and cognitive normal (CN) control subjects. ● = baseline volume in CN; ○ = baseline volume in AD; ▲ = percent annual rate of atrophy in CN; △ = percent annual rate of atrophy in AD.
Table 3.
Classification between AD patients and cognitively normal elderly with baseline volume and annual rate of atrophy of entorhinal cortex
| Parameter | Sensitivity, % | Specificity, % | Overall classification, % | Area under ROC curve |
|---|---|---|---|---|
| Baseline volume | 78 | 76 | 77 | 0.83 |
| + annual rate of atrophy | 86 | 76 | 82 | 0.93 |
Sensitivity, specificity, and overall classification by logistic regression analysis and area under receiver operator characteristic (ROC) curve by ROC analysis.
Discussion
The major findings of this study were as follows: 1) the atrophy rate of ERC in normal aging was significantly greater than zero; 2) AD was associated with a greater rate of ERC atrophy than normal aging. Furthermore, a greater rate of ERC atrophy correlated inversely with memory performance in AD; and 3) Longitudinal ERC measurements were better than cross-sectional measurements in separating AD from CN subjects.
The first finding was that normal aging was associated with a rate of ERC atrophy greater than zero. Furthermore, we observed in this study that normal subjects who had no ERC atrophy (no change or increase of ERC with time) had higher rates of delayed verbal recall, whereas several normal subjects with ERC atrophy (decreased ERC with time) had lower rates of delayed verbal recall, suggesting problems with memory. Together, this suggests that positive rates of ERC atrophy in control subjects may have some functional significance, not simply reflecting random measurement errors. However, whether these longitudinal changes reflect accumulative neuronal loss in ERC or are related to other tissue changes without cell loss during normal aging needs to be determined. Autopsy studies of age-related neuronal loss in ERC yielded conflicting results.4,22 Autopsy studies of hippocampus suggested that aging is associated with neuronal loss.28–30 However, because autopsy studies are cross-sectional by nature and therefore may be confounded by differences in neuron numbers between subjects, these observations cannot establish conclusively a relationship with aging. It was found that rate of ERC atrophy was inversely correlated with baseline volume in CN subjects in this study, as expected for a gradually progressing pathology. Subjects with smaller ERC volumes had shown higher possibility for developing dementia9; therefore, it is possible that those CN subjects with small ERC volume and significant rates of ERC atrophy had early AD. Long-term follow-up studies will be necessary to examine these possibilities.
The second major finding was that AD was associated with an approximately three times greater rate of ERC atrophy than normal aging. Furthermore, ERC volume losses of 6.3 to 6.8%/year in AD are larger than the hippocampal volume losses of 2.3 to 3.98%/year reported before.15,16,31 Several longitudinal studies also reported increased atrophy rates globally10–14 and locally in the corpus callosum17 in the patients with AD. All together, these provide evidence that AD results in a greater progression of cerebral atrophy than normal aging. Furthermore, the data suggest that the ERC is initially the region with the greatest rate of atrophy in AD.
The third major finding was that rates of ERC atrophy provided greater discriminating power than baseline volumes for separation of AD from CN subjects. Furthermore, when rates and baseline measures were combined, rates of ERC atrophy contributed overwhelmingly to the separation between AD and CN, whereas contributions from ERC baseline volumes were negligible for the classification. This suggests that differential volume losses of ERC over time may reflect better cognitive conditions in dementia than absolute ERC size. A possible explanation for the inferior value of cross-sectional ERC measurements in differentiating between AD and normal aging as compared with longitudinal observations of ERC volume change could be the anatomic variability of ERC volumes between subjects. This intersubject variability could add a great deal of noise to the measurement of baseline volume, without a simple way for correction. Longitudinal volume measurements, by contrast, are self-correcting for anatomic variability, which could explain the improvement in differentiating AD patients from control subjects. However, a 100% classification with ERC rates was not achieved in this small selected sample. This may be due to increased rates of ERC atrophy in some control subjects with presymptomatic AD and very low rates of ERC atrophy in some patients with AD. It has been reported that hippocampal volume could classify 100% AD from control subjects in a small sample,32 but this finding could not be replicated in the following larger sample.33 In addition, ERC volume could classify 87% AD from control subjects.34 Recently, it has been reported that the atrophy rate of the hippocampus could classify 89% AD from control subjects.11 However, comparing classifications from different studies is complicated because of differences between studies in sample population and MRI measurements. In this study, we compared rate measurements with absolute volume measurements of ERC on the same subjects and found that rates were better than absolute volumes of ERC in classifying AD patients and control subjects. Further studies are needed to compare all MRI measures in the same population to find the best indicator for AD.
Acknowledgments
The authors thank Ms. Diana Sacrey and Ms. Meera Krishnan for assisting in the image processing.
Footnotes
Supported in part by the VA Research Service (MIRECC) (M.W.W.), RO1 AG10897 (M.W.W.), PO1 AG12435 (M.W.W.), PO1 AG123435 (H.C.C.), VA REAP (M.W.W.), and the Alzheimer’s Association.
References
- 1.Braak H, Braak E. Neuropathological stageing of Alzheimer-related changes. Acta Neuropathol (Berl) 1991;82:239–259. doi: 10.1007/BF00308809. [DOI] [PubMed] [Google Scholar]
- 2.Gaomez-Isla T, Price JL, McKeel DJ, Morris JC, Growdon JH, Hyman BT. Profound loss of layer II entorhinal cortex neurons occurs in very mild Alzheimer’s disease. J Neurosci. 1996;16:4491–4500. doi: 10.1523/JNEUROSCI.16-14-04491.1996. [DOI] [PMC free article] [PubMed] [Google Scholar]
- 3.Braak H, Braak E. Staging of Alzheimer’s disease-related neurofibrillary changes. Neurobiol Aging. 1995;16:271–278. doi: 10.1016/0197-4580(95)00021-6. [DOI] [PubMed] [Google Scholar]
- 4.Price JL, Ko AI, Wade MJ, Tsou SK, McKeel DW, Morris JC. Neuron number in the entorhinal cortex and CA1 in preclinical Alzheimer disease. Arch Neurol. 2001;58:1395–1402. doi: 10.1001/archneur.58.9.1395. [DOI] [PubMed] [Google Scholar]
- 5.Juottonen K, Laakso MP, Insausti R, et al. Volumes of the entorhinal and perirhinal cortices in Alzheimer’s disease. Neurobiol Aging. 1998;19:15–22. doi: 10.1016/s0197-4580(98)00007-4. [DOI] [PubMed] [Google Scholar]
- 6.Du AT, Schuff N, Amend D, et al. Magnetic resonance imaging of the entorhinal cortex and hippocampus in mild cognitive impairment and Alzheimer’s disease. J Neurol Neurosurg Psychiatry. 2001;71:441–447. doi: 10.1136/jnnp.71.4.441. [DOI] [PMC free article] [PubMed] [Google Scholar]
- 7.Bobinski M, de Leon MJ, Convit A, et al. MRI of entorhinal cortex in mild Alzheimer’s disease. Lancet. 1999;353:38–40. doi: 10.1016/s0140-6736(05)74869-8. [DOI] [PubMed] [Google Scholar]
- 8.Xu Y, Jack CJ, O’Brien PC, et al. Usefulness of MRI measures of entorhinal cortex versus hippocampus in AD. Neurology. 2000;54:1760–1767. doi: 10.1212/wnl.54.9.1760. [DOI] [PubMed] [Google Scholar]
- 9.Killiany RJ, Gomez-Isla T, Moss M, et al. Use of structural magnetic resonance imaging to predict who will get Alzheimer’s disease. Ann Neurol. 2000;47:430–439. [PubMed] [Google Scholar]
- 10.Fox NC, Cousens S, Scahill R, Harvey RJ, Rossor MN. Using serial registered brain magnetic resonance imaging to measure disease progression in Alzheimer disease: power calculations and estimates of sample size to detect treatment effects. Arch Neurol. 2000;57:339–344. doi: 10.1001/archneur.57.3.339. [DOI] [PubMed] [Google Scholar]
- 11.Chan D, Fox NC, Jenkins R, Scahill RI, Crum WR, Rossor MN. Rates of global and regional cerebral atrophy in AD and frontotemporal dementia. Neurology. 2001;57:1756–1763. doi: 10.1212/wnl.57.10.1756. [DOI] [PubMed] [Google Scholar]
- 12.Scahill RI, Schott JM, Stevens JM, Rossor MN, Fox NC. Mapping the evolution of regional atrophy in Alzheimer’s disease: unbiased analysis of fluid-registered serial MRI. Proc Natl Acad Sci USA. 2002;99:4703–4707. doi: 10.1073/pnas.052587399. [DOI] [PMC free article] [PubMed] [Google Scholar]
- 13.Fox NC, Crum WR, Scahill RI, Stevens JM, Janssen JC, Rossor MN. Imaging of onset and progression of Alzheimer’s disease with voxel-compression mapping of serial magnetic resonance images. Lancet. 2001;358:201–205. doi: 10.1016/S0140-6736(01)05408-3. [DOI] [PubMed] [Google Scholar]
- 14.Fox NC, Freeborough PA, Rossor MN. Visualisation and quantification of rates of atrophy in Alzheimer’s disease. Lancet. 1996;348:94–97. doi: 10.1016/s0140-6736(96)05228-2. [DOI] [PubMed] [Google Scholar]
- 15.Jack CR, Jr, Petersen RC, Xu Y, et al. Rate of medial temporal lobe atrophy in typical aging and Alzheimer’s disease. Neurology. 1998;51:993–999. doi: 10.1212/wnl.51.4.993. [DOI] [PMC free article] [PubMed] [Google Scholar]
- 16.Jack CR, Jr, Petersen RC, Xu Y, et al. Rates of hippocampal atrophy correlate with change in clinical status in aging and AD. Neurology. 2000;55:484–489. doi: 10.1212/wnl.55.4.484. [DOI] [PMC free article] [PubMed] [Google Scholar]
- 17.Teipel SJ, Bayer W, Alexander GE, et al. Progression of corpus callosum atrophy in Alzheimer disease. Arch Neurol. 2002;59:243–248. doi: 10.1001/archneur.59.2.243. [DOI] [PubMed] [Google Scholar]
- 18.Woods RP, Grafton ST, Holmes CJ, Cherry SR, Mazziotta JC. Automated image registration: I. General methods and intrasubject, intramodality validation. J Comput Assist Tomogr. 1998;22:139–152. doi: 10.1097/00004728-199801000-00027. [DOI] [PubMed] [Google Scholar]
- 19.Woods RP, Grafton ST, Watson JD, Sicotte NL, Mazziotta JC. Automated image registration: II. Intersubject validation of linear and nonlinear models. J Comput Assist Tomogr. 1998;22:153–165. doi: 10.1097/00004728-199801000-00028. [DOI] [PubMed] [Google Scholar]
- 20.Petersen RC, Smith G, Kokmen E, Ivnik RJ, Tangalos EG. Memory function in normal aging. Neurology. 1992;42:396–401. doi: 10.1212/wnl.42.2.396. [DOI] [PubMed] [Google Scholar]
- 21.Small SA, Stern Y, Tang M, Mayeux R. Selective decline in memory function among healthy elderly. Neurology. 1999;52:1392–1396. doi: 10.1212/wnl.52.7.1392. [DOI] [PubMed] [Google Scholar]
- 22.Insausti R, Insausti AM, Sobreviela MT, Salinas A, Martinez-Penuela JM. Human medial temporal lobe in aging: anatomical basis of memory preservation. Microsc Res Techn. 1998;43:8–15. doi: 10.1002/(SICI)1097-0029(19981001)43:1<8::AID-JEMT2>3.0.CO;2-4. [DOI] [PubMed] [Google Scholar]
- 23.McKhann G, Drachman D, Folstein M, Katzman R, Price D, Stadlan EM. Clinical diagnosis of Alzheimer’s disease: report of the NINCDS-ADRDA Work Group under the auspices of Department of Health and Human Services Task Force on Alzheimer’s Disease. Neurology. 1984;34:939–944. doi: 10.1212/wnl.34.7.939. [DOI] [PubMed] [Google Scholar]
- 24.Folstein MF, Folstein SE, McHugh PR. “Mini-Mental State”. A practical method for grading the cognitive state of patients for the clinician. J Psychiatr Res. 1975;12:189–198. doi: 10.1016/0022-3956(75)90026-6. [DOI] [PubMed] [Google Scholar]
- 25.Williams JM. Memory assessment scales. Odessa: Psychological Assessment Resources; 1991. [Google Scholar]
- 26.Insausti R, Juottonen K, Soininen H, et al. MR volumetric analysis of the human entorhinal, perirhinal, and temporopolar cortices. AJNR. 1998;19:659–671. [PMC free article] [PubMed] [Google Scholar]
- 27.Tanabe JL, Amend D, Schuff N, et al. Tissue segmentation of the brain in Alzheimer disease. AJNR. 1997;18:115–123. [PMC free article] [PubMed] [Google Scholar]
- 28.West MJ. Regionally specific loss of neurons in the aging human hippocampus. Neurobiol Aging. 1993;14:287–293. doi: 10.1016/0197-4580(93)90113-p. [DOI] [PubMed] [Google Scholar]
- 29.West J, Fitzpatrick JM, Wang MY, et al. Comparison and evaluation of retrospective intermodality brain image registration techniques. J Comput Assist Tomogr. 1997;21:554–566. doi: 10.1097/00004728-199707000-00007. [DOI] [PubMed] [Google Scholar]
- 30.Simic G, Kostovic I, Winblad B, Bogdanovic N. Volume and number of neurons of the human hippocampal formation in normal aging and Alzheimer’s disease. J Comp Neurol. 1997;379:482–494. doi: 10.1002/(sici)1096-9861(19970324)379:4<482::aid-cne2>3.0.co;2-z. [DOI] [PubMed] [Google Scholar]
- 31.Kaye JA, Swihart T, Howieson D, et al. Volume loss of the hippocampus and temporal lobe in healthy elderly persons destined to develop dementia. Neurology. 1997;48:1297–1304. doi: 10.1212/wnl.48.5.1297. [DOI] [PubMed] [Google Scholar]
- 32.Seab JP, Jagust WJ, Wong ST, Roos MS, Reed BR, Budinger TF. Quantitative NMR measurements of hippocampal atrophy in Alzheimer’s disease. Magn Res Med. 1988;8:200–208. doi: 10.1002/mrm.1910080210. [DOI] [PubMed] [Google Scholar]
- 33.Jack CR, Jr, Petersen RC, Xu YC, et al. Medial temporal atrophy on MRI in normal aging and very mild Alzheimer’s disease. Neurology. 1997;49:786–794. doi: 10.1212/wnl.49.3.786. [DOI] [PMC free article] [PubMed] [Google Scholar]
- 34.Juottonen K, Laakso MP, Insausti R, et al. Volumes of the entorhinal and perirhinal cortices in Alzheimer’s disease. Neurobiol Aging. 1998;19:15–22. doi: 10.1016/s0197-4580(98)00007-4. [DOI] [PubMed] [Google Scholar]