

Abstract
Reactive oxygen species (ROS) play a crucial role in many cellular responses and signaling pathways, including the oxidative burst defense response to pathogens. We have examined very early events in cryptogein-induced ROS production in tobacco (Nicotiana tabacum) Bright Yellow-2 suspension cells. Using Amplex Red and Amplex Ultra Red reagents, which report real-time H2O2 accumulation in cell populations, we show that the internal signal for H2O2 develops more rapidly than the external apoplastic signal. Subcellular accumulation of H2O2 was also followed in individual cells using the 2′,7′-dichlorofluorescein diacetate fluorescent probe. Major accumulation was detected in endomembrane, cytoplasmic, and nuclear compartments. When cryptogein was added, the signal developed first in the nuclear region and, after a short delay, in the cell periphery. Interestingly, isolated nuclei were capable of producing H2O2 in a calcium-dependent manner, implying that nuclei can serve as a potential active source of ROS production. These results show complex spatial compartmentalization for ROS accumulation and an unexpected temporal sequence of events that occurs after cryptogein application, suggesting novel intricacy in ROS-signaling cascades.
Reactive oxygen species (ROS) are versatile molecules that play an indispensable role in mediating a diversity of cellular responses in plant cells, including necrotic reactions, programmed cell death, development, gravitropism, and hormonal signaling. The membrane-bound NADPH oxidase or respiratory burst oxidase homologs (Rboh; Groom et al., 1996; Keller et al., 1998; Torres et al., 2002) are key enzymes that generate superoxide radicals in plant cells, which are converted into H2O2 (Pugin et al., 1997; Sagi and Fluhr, 2006). Rboh are localized to plasma membrane fractions (Keller et al., 1998) and are stimulated directly by Ca2+ (Sagi and Fluhr, 2001). This stimulation is likely mediated by their N-terminal extension containing EF-hand calcium-binding motifs. These enzymes are known to participate in different plant processes and responses. For example, developmental processes, such as cell expansion and root growth (Foreman et al., 2003; Renew et al., 2005), xylem differentiation (Barcelo, 2005), and apical dominance and leaf shape (Sagi et al., 2004), are regulated by Rboh activity. Accumulating evidence suggests a role for Rboh in hormonal signaling pathways in plants, including abscisic acid-mediated stomatal closure (Kwak et al., 2003) and ethylene regulation of cell death (Overmyer et al., 2003), and as an auxin-mediated signal transduction controlling root development (Nagata et al., 2004). Rboh are also involved in different defense responses to wounding (Sagi et al., 2004), abiotic stress (e.g. water stress and ozone; Jiang and Zhang, 2002; Joo et al., 2005), and hypersensitive cell death in response to avirulent pathogen attack (Sagi and Fluhr, 2001; Torres et al., 2002).
A well-studied example of the role of Rboh in plant pathogen interactions is exemplified in the cryptogein-induced defense response in tobacco (Nicotiana tabacum). Cryptogein, a proteinaceous elicitor, produced by the pathogenic fungus Phytophthora cryptogea, belongs to a family of 10-kD proteins called elicitins (Panabieres et al., 1995). In tobacco plants and suspension cells, cryptogein induces a hypersensitive response (Ricci et al., 1989; Binet et al., 2001) and systemic acquired resistance (Keller et al., 1996). A mode of action for cryptogein has been suggested that starts with recognition of the elicitor by an unidentified plasma membrane receptor that leads to a cascade of events, including calcium influx, potassium and chloride effluxes, cytosolic acidification, and plasma membrane depolarization (Pugin et al., 1997; Bourque et al., 1999). These events lead to the activation of Rboh (Simon-Plas et al., 2002), which is responsible for ROS production in the oxidative burst, and to the activation of mitogen-activated protein kinase homologs (Bourque et al., 1999; Nurnberger and Scheel, 2001; Kadota et al., 2004). The production of apoplastic ROS in the oxidative defense-related burst promoted by cryptogein and other pathogens is biphasic: a rapid and transient production of ROS, which occurs within minutes of the perception of pathogens, and a second, much later phase of ROS production within hours, which is specific to hypersensitive response-inducing pathogens (Grant and Loake, 2000).
The spatial, temporal, and quantitative components of ROS signaling dictate its specificity. These components include the precise location and magnitude of ROS production coupled to its cellular scavenging (Mullineaux and Karpinski, 2002) and modulation by nitric oxide (Delledonne et al., 2001; Zaninotto et al., 2006). Rboh enzymatic activity mediates the vectoral transfer of electrons to produce extracellular short-lived superoxides. The relationship of the external signal produced by Rboh to modulation of the intracellular ROS signal and its localization are fundamental questions that remain unanswered. In this study, we examine very early events in cryptogein-induced H2O2 production, its localization and kinetics. We have identified subcellular sites for H2O2 accumulation in the cytoplasm, endoplasmic reticulum (ER), and nuclear region, and have identified a novel site for ROS production in nuclei. Furthermore, our results suggest that the early cryptogein-induced response in Bright Yellow (BY)-2 cells is actually initiated within the cells, suggesting that extracellular ROS production may serve to amplify preceding internal ROS signals.
RESULTS
Rapid H2O2 Response in Cryptogein-Treated BY-2 Cells
The low autofluorescence of BY-2 cells, due to the lack of developed chloroplasts, facilitates their use in real-time kinetic observation. Amplex Red (AR) and Amplex Ultra Red (AUR) reagents were employed due to their high sensitivity and have been used previously to measure H2O2 production in human leukocytes and enzymatic assays (Mohanty et al., 1997; Mazura et al., 2006). When AUR was used to assay the response of BY-2 cells to cryptogein (100 nm), rapid accumulation of H2O2 was detected. Catalase, an enzyme that catalyzes the breakdown of H2O2, and diphenylene iodonium (DPI), which inhibits flavin-containing enzymes, were incorporated to examine the nature of the signal. As shown in Figure 1A, the AUR response was sensitive to catalase and DPI, indicating that it was H2O2 that was measured and that a flavin-dependent enzyme is a source for this activity. To localize the origin of the signal, optical sections of individual cells were sampled using confocal laser-scanning microscopy (CLSM). The image showed that, in the case of AUR reagent, the signal emanated from the surrounding medium, leaving the cells as a dark shadow (Fig. 1A, left inset). This result indicates that AUR does not cross the cell membrane and reports extracellular H2O2 accumulation, presumably from a DPI-sensitive source like Rboh.
Figure 1.

Generation of H2O2 in cryptogein-treated BY-2 cells as reported by AR and AUR. A, AUR assay of cryptogein-treated cells. Left, Representative kinetics graph of H2O2 response to cryptogein (100 nm) as measured by fluorescence emission in the absence or presence of DPI (2 μm) and catalase (628 units/mL). Arrow indicates the addition of cryptogein. Left inset, Representative confocal image of cryptogein-treated cells in the presence of AUR reagent. Right, Maximal reaction response rates before and after cryptogein addition (average of five experiments ± sd). B, AR assay of cryptogein-treated cells as described in A. C, Measurement of the kinetics of H2O2 accumulation in cryptogein response. Left, Accumulation of H2O2 with AR and AUR after the addition (arrow) of cryptogein (n = 5, average ± sd). Right, Calculated time response to achieve maximal linear accumulation after the addition of cryptogein (±sd).
A similar assay was carried out with AR, which resulted in comparable reaction patterns, but with significant kinetic differences and a markedly different image pattern (Fig. 1B). Significantly, when the optical section of individual cells was examined, it showed that the fluorescent signal emanates from inside the cell (Fig. 1B, left inset). The physicochemical basis for the differences in cell permeability displayed between AUR and AR is unknown. In the case of AR, the effective inhibition by catalase with respect to that observed in the AUR measurement was reduced (80% in the AUR measurement, 50% in the AR measurement). Similarly, the effectiveness of inhibition by DPI was slightly reduced (100% in the AUR measurement, 90% in the AR measurement). These results show that, under the conditions used, AR is cell permeable and reports internal changes in H2O2 apparently with the support of a cellular peroxidase activity. This scenario is consistent with the observed weaker inhibition of the signal by exogenously applied catalase relative to inhibition of catalase during AUR measurement. The fact that external catalase can affect internal H2O2 levels has been observed previously (Allan and Fluhr, 1997).
Rapid scanning of H2O2 accumulation in BY-2 cells was carried out as shown in Figure 1C. Normalized emission data were analyzed for response kinetics by measuring the response time from the addition of cryptogein (Fig. 1C, arrow) and the commencement of the linear phase of H2O2 accumulation. Analysis of these curves revealed that AR response time was more rapid than that measured for AUR (1.3 ± 0.3 min, using AR, compared to 2.5 ± 0.2 min, using AUR). The longer response time shown by AUR may be an intrinsic feature of this reporter agent. To examine this possibility, we employed the calmodulin antagonist N-(6-aminohexyl)-5-chloro-1-napthelenesulfonamid-hydrochloride (W7), which induces rapid ROS production in BY-2 cells (this work; C. Ashtamker, unpublished data). The response time after W7 addition was immediate, as measured by AUR (Supplemental Fig. S1), and was identical to the rapid response measured by AR (data not shown), indicating that AUR can measure rapid kinetic changes as well. Thus, it appears that the internal signal from cells treated by cryptogein, as reported by AR, develops more rapidly than the external signal, as reported by AUR.
Cellular Accumulation of H2O2
The kinetics of the internal H2O2 signal was further examined by CLSM using dichlorofluorescein (DCF; 2′,7′-DCF diacetate [H2DCFDA]). The initial fluorescent signals of the AR and DCF probes showed complete colocalization after the addition of H2O2 (Supplemental Fig. S2). For kinetic CLSM measurements of individual cells, the AR reagent proved to be less useful because it showed laser-induced instability (Zhou et al., 1997; Towne et al., 2004). As in the case of AR, the DCF signal is dependent on its concentration in a particular compartment and on the intrinsic cellular peroxidase activity (Gerber and Dubery, 2003). However, the kinetics of DCF oxidation within a certain compartment should represent actual real-time changes in H2O2 concentrations that result from production in the compartment or from H2O2 influx to the compartment.
DCF-treated cells showed a basal-level signal that accumulated in all cytoplasmic areas, including the nucleoplasm (Fig. 2A, left; basal level). After exogenous excitation of the cells with 100 nm cryptogein (Fig. 2A, left; +Cryp), the DCF signal was significantly elevated in most cellular localizations. Cells that were treated with DPI showed significant reduction of the basal level of the DCF signal to a level in which the basal signal cannot be detected (data not shown). The inhibition indicates that the basal level of ROS is at least partially produced by flavin-containing enzymes (e.g. Rboh). A time course of the response to cryptogein in the absence or presence of DPI was conducted and measurements of the signal intensity were taken every 15 s for a total reaction time of 15 min. A representative normalized graph (Fig. 2A, right) shows an increase in DCF signal in response to cryptogein application (arrow). Interestingly, DPI inhibition was significant as observed in the AR assay (Fig. 1B). This result is consistent with the identification of Rboh as the source of cryptogein-induced ROS response (Simon-Plas et al., 2002).
Figure 2.

Subcellular accumulation of H2O2 in BY-2 cells after H2O2 and cryptogein addition as reported by DCF. A, Left inset, Optical section showing the DCF signal before and 13 min after the addition of 100 nm cryptogein. Right inset, Kinetics graph of response to cryptogein reported by DCF with or without the addition of DPI. B, Subcellular accumulation of H2O2. Left insets, DCF signal before and 75 s after external addition of 0.1 mm H2O2. Right insets, Image of DCF signal before and 5 min after addition of 100 nm cryptogein. Top insets in B, Division of the cell into periphery (blue line) and nuclear (orange line) regions. Scale bar in bottom right image = 10 μm. C, Kinetics graphs of signal intensity after H2O2 (left inset) and cryptogein (right inset) application. DCF signals were recorded from the designated periphery and nuclear subcellular compartments as shown in the top insets of B. D, Maximal rate of signal acquisition as measured in the periphery or nucleus expressed as the time gap. The time to achieve maximal rate of signal acquisition was measured in each compartment. The difference in start times was calculated as described in “Materials and Methods.” Negative values were defined when the nuclear compartment reacted before the periphery compartment. Averages of five experiments ± se are shown.
To further clarify the results obtained with the AR/AUR assays that suggested an earlier internal ROS signal, kinetics of H2O2 accumulation as reported by DCF were followed by collecting data separately from periphery and nuclear regions in individual immobilized cells. Measurements were collected every 0.3 s for a total reaction time of 2 to 5 min from both regions (Fig. 2B). As a control, 0.1 mm H2O2 was added to the cells. The exogenously added H2O2 was shown to promote a rapid rise in the DCF signal (Fig. 2, B and C; compare image of basal level to +H2O2). Quantitative analysis of five independent experiments showed an average of 2.6 ± 0.3 s delay between the maximal rate change of the signal measured at the periphery, which occurred first, compared to the maximal rate change of the signal measured from the nuclear region, which followed (Fig. 2D). The results are consistent with the external application of H2O2 and indicate the time needed for inward diffusion of H2O2. These results show the sensitivity of the system to discern cellular flux directions of H2O2. The same experiments were carried out after the addition of 100 nm cryptogein (Fig. 2, B and C, right insets). In this case, measurements showed that the flux direction was reversed, with the nuclear region showing an earlier change in rate than the periphery (7.4 ± 2.2 s; n = 6; Fig. 2D). These results suggest that internal sources of H2O2 may contribute to the cellular response to cryptogein and are consistent with the finding that internal response times reported by AR occurred more rapidly than external response times reported by AUR (Fig. 1).
Cellular Compartmentalization of DCF Accumulation
The imaging characteristics of the basal and induced DCF signal suggest that it is accessible to many cellular compartments. To identify DCF subcellular localization, double-staining experiments with a variety of cellular probes were conducted. FM 4-64, a hydrophobic fluorescent stain, has been shown to rapidly stain the cell plasma membrane and progress by endocytosis to label internal cellular membranes (Bolte et al., 2004). Double-stained cells with DCF and FM 4-64 showed distinct localization (Fig. 3A). In comparison, double staining with a mitochondria-specific probe, MitoTracker Red CMXRos (Zanella et al., 2002), showed a great deal of fluorescent overlap that colocalized in all cytoplasmic areas in which mitochondria are present, consistent with the respiratory function of these organelles (Fig. 3B). Cells double stained with DCF and the ER-specific probe ER-Tracker Blue-White DPX (Richter-Unruh et al., 2004) showed that the signals were completely interspersed (Fig. 3C). The prominent envelopment of the plant nucleus by the ER is also evident, as has been shown previously (Staehelin, 1997; Okushima et al., 2002). In addition to the localization noted above, the DCF signal emanates from the nucleus as well. Taken together, the results suggest that DCF reports the accumulation of H2O2 in the vicinity of the ER, mitochondria, and nucleus.
Figure 3.

Imaging of H2O2 and subcellular-specific stains. A, Optical section of cells double stained with DCF and the membrane-specific marker FM 4-64. B, Optical section of cells double stained with DCF and mitochondrial-specific marker MitoTracker. C, Optical section of cells double stained with DCF and the ER-specific marker DPX. Right insets in each image are enlarged sections of the cell periphery (top inset) and the nuclear regions (bottom inset). Scale bars in bottom image = 10 μm.
Brefeldin A Disruption of Cellular Compartments
To further differentiate the localization of the DCF signal with reference to endomembranes, cells were examined after the application of the fungal metabolite brefeldin A (BFA). Exposing cells to BFA has been shown to modify intracellular protein traffic from the ER to the Golgi apparatus and to induce remodeling of ER-Golgi apparatus morphology (Fujiwara et al., 1988; Klausner et al., 1992; Driouich et al., 1993). The rationale for following DCF distribution in BFA-treated cells is the expectation that, if the DCF signal is associated with the ER, its distribution would be radically altered in BFA-treated cells.
Initially, the influence of BFA on ER structure was followed with DiOC5(3), an ER marker (Zhao et al., 2006). Cells were treated with 40 μm BFA for different time periods and then stained with DiOC5(3). Treated and untreated cells were visualized by CLSM and optical sections of cells were obtained to produce the three-dimensional (3D) reconstructed images that are presented in Figure 4A (left). Untreated cells showed that the stain is spread throughout the cytoplasm as thin filaments that form a net and concentrated especially around the nucleus (Fig. 4A, top left; control). This staining by DiOC5(3) is consistent with both ER and Golgi structures, as shown before (Ritzenthaler et al., 2002). After 30 to 90 min of exposure to BFA, the ER was reorganized as patch-like structures observed in the periphery of the cells (Fig. 4A, bottom left; +BFA). The patch-like structures are thought to represent novel blending of ER and Golgi membranes (Nebenfuhr et al., 2002). A parallel experiment was conducted with DCF-stained cells. The basal level of H2O2 accumulation yielded similar images (Fig. 4A, right insets; compare control and +BFA). Untreated cells showed the prevalent normal DCF signal distribution; however, after BFA treatment, cells with exceptional morphology, including large smears and patches at the cell periphery, were detected.
Figure 4.

Imaging of H2O2 and subcellular-specific stains in BFA-treated BY-2 cells. A, Cells were stained separately with the ER marker DiOC5(3) or DCF. Left insets, 3D reconstructions of cells stained with DiOC5(3). Right insets, 3D reconstructions of cells stained with DCF. Images of nontreated cells (control; top insets) and between 30 and 90 min of BFA treatment (bottom insets) were collected. B, Cells were double stained with DCF and the ER-specific marker DPX. Top inset, Nontreated cells showing DCF, DPX, and merge images; bottom insets, DCF, DPX, and merge images were collected at 30 min (middle inset) and 60 min (bottom inset) after BFA addition. Scale bar = 10 μm.
To further establish the influence of BFA on the distribution of the DCF signal, a similar experiment was conducted by double staining with DCF and ER-Tracker DPX. Optical sections of cells were collected and the 3D reconstruction images are shown (Fig. 4B, top inset). The images yielded patterns similar to that detected with DiOC5(3) (Fig. 4A, left inset) and DPX (Fig. 3C). After 30 min of exposure to BFA (Fig. 4B, middle inset), the area surrounding the nucleus and some patch-like areas were stained by DPX, which is in concordance with the DiOC5(3) stain (Fig. 4A). DCF signals were seen to colocalize to the same areas, with the nucleus as an additional DCF-stained region. After 1 h of treatment with BFA (Fig. 4B, bottom inset), a patch-like appearance was observed (Fig. 4B, bottom inset). These results show that BFA treatment dramatically shifts the pattern of DCF staining into ER-Golgi hybrid stacks and suggests that part of the DCF signal emanates from the endomembrane system.
Nuclei Are a Potential Source of ROS Production
Nuclear regions showed intense DCF fluorescence (Figs. 1–4). This could be a result of ROS that originate from other cellular locations and cross into the nucleoplasm, where they react with DCF. Alternatively, the nuclear region may itself be a source. To examine this, intact nuclei were purified as previously described (Stoppin et al., 1994). When viewed by confocal microscopy, isolated nuclei were largely free of surrounding ER and mitochondria as established by DiOC5(3) and MitoTracker staining (data not shown) and appeared to be intact (Fig. 5, A and C, transmission insets). To see whether DCF is present in the nuclei, high excitation regimes were employed. Such treatment was shown previously to excite DCF in BY-2 cells (Dixit and Cyr, 2003). Under these conditions, DCF labeled the nucleolus (Fig. 5A, green color). Triple staining with the membrane-specific dye FM 4-64 and with the DNA-specific dye diamidino-2-phenylindole (DAPI; Fig. 5A, red and blue colors, respectively) revealed an intact nuclear membrane surrounding an area with chromatin and complex unstained substructure within and around the nucleolus.
Figure 5.

Imaging of H2O2 signal in BY-2 cells and isolated nuclei in response to calcium application, as reported by DCF and AUR. A, Merged optical section of isolated BY-2 nucleus triple stained with FM 4-64, DAPI, and DCF. B, Optical section of cells stained with DCF before and after the addition of 1 mm calcium. C, Optical section of isolated nuclei stained with DCF (top inset) and AUR (bottom inset) before (control) and after the addition of 1 mm calcium (+Ca2+), and transmission images of the isolated nuclei. Scale bar = 10 μm. D, Representative graph of calcium-dependent DCF response in isolated nuclei. E, Reaction rates after 1 mm calcium addition (average of at least five experiments ± sd).
Cryptogein addition to isolated nuclei showed no effect (data not shown), indicating that signal transduction for ROS induction was disrupted. Consequently, we sought a different mode of activation of ROS production. Calcium, a downstream component of the cryptogein-signaling pathway that is also known to induce ROS production by Rboh, was employed as a possible activator. As shown in Figure 5B, addition of 1 mm Ca2+ was found to induce a DCF signal in EGTA-pretreated BY-2 cells. In isolated nuclei, the same concentration of Ca2+ induced a DCF signal that was chiefly localized to the nucleolus (Fig. 5C, top). Similar results were obtained using AUR as a reporter, which in this case was found to be competent to enter isolated nuclei (Fig. 5C, bottom). The rate of the H2O2-generated signal as measured by DCF was found to correlate with Ca2+ concentrations but not to the addition of NADPH (Fig. 5D), which is a potential electron donor (e.g. to Rboh). High concentrations of calcium necessary to induce H2O2 accumulation in isolated nuclei may reflect their relative impermeability to calcium, as has been reported previously (Pauly et al., 2000). The signal was partially inhibited by DPI (60% inhibition) and exogenous catalase (30% inhibition), as shown in Figure 5E. The results imply that nuclei can be an independent source of H2O2.
DISCUSSION
Real-time rapid changes in elicitor-induced ROS accumulation were followed in BY-2 cell populations and in individual cells. The results revealed unexpected complex kinetics in which ROS accumulated within the cell more rapidly than the response outside the cell. The result is not due to limitations in the measurement of external response times as shown by the immediate reporting of H2O2 accumulation after W7 application (Supplemental Fig. S1). The exact mode by which W7 induces ROS accumulation is not known. W7 serves as a calmodulin antagonist and has been used to study calcium/calmodulin-mediated pathways in animals and plants. The ROS response in BY-2 cells induced by W7 is likely a result of rapid calcium bursts (Kaplan et al., 2006). Such bursts are known to precede the accumulation of H2O2 in different signaling pathways (Neill et al., 2002; Jiang and Zhang, 2003). Thus, W7 appears to short circuit cellular ROS activation and shows that different modes of ROS activation will yield different action patterns.
The discrepancy between the external and internal cellular response times after cryptogein addition is inconsistent with the conventional pattern expected for a peripheral extracellular origin of ROS by Rboh. Superoxides are thought to be produced on the outer surface of the cell by a plasma membrane-bound Rboh activity. The negatively charged superoxide product could traverse the plasma membrane as the neutral hydroperoxyl (HO2, pKa = 4.88) or by being converted to the membrane-permeable H2O2 (Sagi and Fluhr, 2006). In any case, this scenario predicts prior extracellular superoxide/H2O2 accumulation followed by a membrane and hence diffusion-limited increase in intracellular H2O2. The resultant opposite findings reported here suggest a delay time for the extracellular response that may be due to inherent qualities of the cellular response to cryptogein. It is of interest that, in cryptogein-treated epidermal tissue, cytosolic and nuclear accumulation of ROS is more prominent than peripheral accumulation (Allan and Fluhr, 1997).
Changes in H2O2 accumulation in cell populations reported by AR/AUR reagents are consistent with dynamic intracellular processes of ROS as measured by DCF. Thus, when the cell area was roughly divided into peripheral and nuclear spatial cellular compartments, the response to cryptogein as compared to the response to the exogenous addition of H2O2 suggested that the nuclear region (i.e. internal region) responded before the periphery of the cell. By use of double-stain techniques, the regions for DCF accumulation were identified as cytoplasm, mitochondria, ER, and the nucleoplasm, all of which indicate that these compartments could be possible sources for intracellular ROS production or that they are compartments in which the ROS levels were modified due to elicitor addition. Mitochondria are a known source of ROS (Moller, 2001), but have not been implicated in the rapid cryptogein response that is associated with Rboh (Simon-Plas et al., 2002). In contrast to the measurement of the initial bursts of ROS featured here (seconds to minutes), longer term analysis may implicate the involvement of mitochondria and other cellular compartments. For example, cadmium treatment of BY-2 cells elicited calcium currents and Rboh-dependent ROS bursts (Garnier et al., 2006). However, later waves (beyond 30 min) of ROS response and subsequent cadmium toxicity were shown to emanate from ROS activity in the mitochondria.
An interesting finding is that one of the major compartments in plant cells reported by DCF is the endomembrane system. BFA treatment (Fig. 4) radically altered the distribution of the ER and concomitantly dramatically shifted the normal localization pattern of the DCF signal into ER-Golgi hybrid stacks. The finding that a major DCF signal emanates from around the nucleus is consistent with endomembrane localization because the ER is known to surround this organelle. The ER compartment is substantially more oxidizing than the surrounding cytoplasm (Hwang et al., 1992; Nardai et al., 2003); this oxidizing environment ensures the correct formation and isomerization of disulfide bonds facilitated by special protein disulfide isomerases that act in protein folding and assembly (Freedman et al., 1994). In the context of endomembrane reactivity to the cryptogein elicitor, this may indicate that, despite intrinsic buffering capacity, a wave of ROS is either initiated at, or floods through, endomembrane compartments. Treatment of cells with H2O2 was shown to promote or inhibit cytoplasmic disulfide bond formation of select proteins in a concentration-dependent manner (Cumming et al., 2004). This oxidation can function as a cellular messenger that is likely to modulate the activity of many different proteins, leading to a variety of responses (Mori and Schroeder, 2004). The results here indicate that the endomembrane and nuclear compartments are likely targets or sources for ROS signaling.
DCF reported rapid accumulation of ROS in the nucleoplasm as a result of cryptogein addition. A major ramification of this observation is that ROS signals initiated by cryptogein permeate the cell and would impinge on the nucleoplasm redox state. This could have direct impact on a variety of transcription factors that are known to be redox regulated (Fedoroff, 2006). Visualization of H2O2 transients in the cell does not necessarily indicate that it directly interacts with these targets, but that its effect may be funneled through thioredoxin-like redox transducing mechanisms (Dos Santos and Rey, 2006). Plasma membranes and organelles, such as mitochondria, peroxisomes, and chloroplasts have been shown to act as ROS generators. Here, we show that isolated nuclei can also generate H2O2 in response to calcium addition. This is consistent with the suggestion that plant nuclei are capable of generating their own calcium currents that could contribute to organelle signaling (Pauly et al., 2000). Furthermore, animal nuclei were shown to regulate calcium signals in localized subnuclear regions, indicating that calcium can simultaneously regulate independent processes in the nucleus (Echevarria et al., 2003).
Due to the isolated state of the nuclei, we do not know whether they normally function as a physiological source of ROS. In contrast to the endomembrane system, the nucleus is considered to be in a relatively reduced state (Hansen et al., 2006); thus, the signal measured may be part of the homeostasis mechanism used to maintain that state. The molecular source of this ROS is unknown. However, because the signal was partially inhibited by DPI (60%), it could be from an enzymatic source that uses flavin. RbohD and RbohF were shown to localize mainly to the plasma membrane (Keller et al., 1998; Sagi and Fluhr, 2001); nevertheless, other members of the Rboh family could reside in other cellular locations (e.g. the nuclear membrane). For example, human Nox4 (NADPH oxidase 4) from endothelial cells of the umbilical vein showed preferential localization to the nucleus (Kuroda et al., 2005). Interestingly, all plant rboh genes carry EF-hands that bind Ca2+, and plant Rboh proteins were shown to be stimulated directly by Ca2+ (Sagi and Fluhr, 2001). Alternatively, a completely novel source could be responsible for nuclear ROS production. Taken together, the implications are that nuclei are not only reservoirs of ROS accumulation, but may actively be a source of ROS production. Whether they play a role in the early cryptogein-induced intracellular signal remains to be seen.
Our results suggest that an internal ROS signal precedes the external signal, implying that, in intact cells, the cryptogein-signaling cascade stimulates intracellular components that produce an initial H2O2 signal. To what extent the later extracellular burst depends on this event is unknown. In calcium signaling, primary currents of calcium are known to stimulate other compartments to increase calcium release and thus set up an integrated signaling network of calcium currents (Sanders et al., 2002). It is intriguing that the ROS-signaling pathway appears to have adopted similar attributes.
MATERIALS AND METHODS
Plant Material and Isolation of BY-2 Nuclei
Tobacco (Nicotiana tabacum) cv BY-2 cells were maintained under continuous light conditions at 26°C on a rotary platform shaker at 120 rpm and subcultured every 7 d at a 1:50-mL dilution in Murashige and Skoog medium (Murashige and Skoog, 1962) supplemented with 3% Suc and thiamine (adjusted to pH 6.2). All experiments with BY-2 cells were performed using cells in their log phase of growth after a 3:50-mL (v/v) dilution and after a further 3 d of subcultivation. Isolation of nuclei was performed as described previously (Stoppin et al., 1994).
Fluorophores and Chemicals
Most fluorophores and inhibitors were purchased from Molecular Probes, Invitrogen. Fluorophores were kept protected from light in desiccators. Stock solutions in anhydrous dimethyl sulfoxide (DMSO) at −20°C were prepared of the following: H2DCFDA (D-399), 100 mm; DiOC5(3) (D-272), 100 mm; MitoTracker Red CMXRos (M-7512), 1 mm; AR (A-22188), 100 mm; AUR (A-36006), 100 mm; and ER-Tracker Blue-White DPX (E-12353), 1 mm. FM-64 (T-3166) was a 10 mm stock solution in sterile water and was kept at room temperature. DPI (D-7909) and BFA (B-7450) were kept as 20 mm stock solution in DMSO at −20°C. Other chemicals were supplied by Sigma-Aldrich. DAPI dihydrochloride (D-8417) was a 5 mg/mL stock solution in sterile water and was kept protected from light in a desiccator at −20°C.
Expression and Purification of Cryptogein
Pichia pastoris (strain GS115) bearing the plasmid pLEP3 was a gift from Dr. Toyoki Amano (Department of Biology, Shizuoka University, Japan), and was used for cryptogein production (O'Donohue et al., 1996). Cryptogein was dissolved in distilled water as a 50 μm stock solution.
AUR and AR Assays
AR hydrogen peroxide/peroxidase assay kit (A-22188) and AUR reagent (A-36006) were from Molecular Probes. In the presence of horseradish peroxidase (HRP), these reagents react in a 1:1 stoichiometry with H2O2 to produce the highly fluorescent resorufin. In all experiments, BY-2 cells were washed and resuspended in fresh medium in a final packed volume of 1:10, and then the suspension was incubated for 90 min at 50 rpm for adaptation at room temperature. In AUR assays, a working solution of 50 μL (100 μm reagent and 0.2 units/mL HRP in 1× reaction buffer) was used in a 1:1 ratio with the cells. In AR assays, cells were preloaded in the working solution (without HRP) for 10 min in the dark, then washed and resuspended in fresh medium at a 1:10 ratio. Then cells were used in a 1:1 ratio with fresh medium. All experiments were preformed in a final volume of 100 μL/microplate well. A microplate fluorescence reader (Synergy HT; Bio-Tek) was used for excitation at 520 ± 20 nm and emission detection at 590 ± 20 nm. When used, DPI (2 μm) was added 35 min prior to the beginning of each experiment, while 628 units/mL catalase were added at the beginning of each experiment. The addition of these reagents did not affect the fluorescent properties of AR and AUR (Supplemental Fig. S3).
Cell Labeling and Viability Tests
A modified slide was used to facilitate microscopy flow-through experiments on nonadherent live cells, such as plant BY-2 cells. In all experiments, a volume of 50 μL of suspension BY-2 cells was applied to the modified slide. All staining, washing, and reagent supplementation procedures were done directly on the slide using the incubation times and final concentrations as described in Table I. For each reagent, viability tests were conducted using Trypan blue 0.4% solutions (Sigma-Aldrich; T-8154). A final concentration of 0.1% Trypan blue was added to the specimens and incubated for 1 min. At least 500 cells were counted for each treatment tested. All viability tests showed more then 95% viability during the time spans measured.
Table I.
Probes used in this study
| Probe | Marker Selectivity | Final Concentration | Incubation Time (min) | Excitation/Emission Bands Used |
|---|---|---|---|---|
| DCF (H2DCFDA) | H2O2 | 5 μm | 5 | 488/505–525 nm |
| AR or AUR | H2O2 | 50 μm | 5 | 543/>610 nm |
| FM 4-64 | Membranes | 10 μm | 5 | 543/>610 nm |
| MitoTracker Red CMXRos | Mitochondria | 0.5 μm | 5 | 543/>610 nm |
| DiOC5(3) | ER and membrane potential | 10 μm | 2–5 | 488/505–525 nm |
| ER-Tracker Blue-White DPX | ER | 10 μm | 5 | 405/430–460 nm |
| DAPI dihydrochloride | DNA | 5 μg/mL | 5 | 405/430–460 nm |
BY-2 Cell Confocal Imaging
All images were taken with the 40× and 60× objectives on an Olympus IX70 microscope equipped with FLUOVIEW 500 CLSM. For all probes, laser intensity was adjusted to the lowest level that retained a significant signal-to-noise ratio. Laser and filter combinations used are summarized in Table I. For 3D reconstructions, Z series were done with 0.5-μm steps.
Kinetics Measurements and Analysis
For fluorescence measurements of cell populations using AR and AUR reagents, the response delay time was calculated from the time of the addition of cryptogein to the time of linear accumulation. The first derivative was taken from the region of maximal linear accumulation of H2O2 and the slope was extrapolated to the time axis. For kinetics measurement of individual cells using the DCF reporter, confocal signal measurements were taken from the whole cell area provided by FLUOVIEW 500 software. In the case of kinetics of ROS production from different compartments, intensity measurements were taken from defined areas of the nucleus and the cell periphery as described in Figure 2B. To calculate the time gap between signals gathered from each compartment in a given experiment, the first-order derivative of the kinetic data provided by FLUOVIEW 500 software was calculated and smoothed by the moving average function provided in an Excel worksheet (period = 12). The peak in the first-order derivative graph was used to define the start point of the maximal rate change of signal acquisition. For each experiment, the difference between the time points to maximal rate of signal acquisition in the periphery to the maximal rate of signal acquisition in the nucleus was calculated.
BFA Treatment
Cells were treated with 40 μm BFA for different time periods. Samples of cells were taken, stained with different probes, washed three times with medium containing the same BFA concentration, and immediately imaged.
Supplemental Data
The following materials are available in the online version of this article.
Supplemental Figure S1. Generation of H2O2 in cryptogein or W7-treated BY-2 cells as reported by AUR assay.
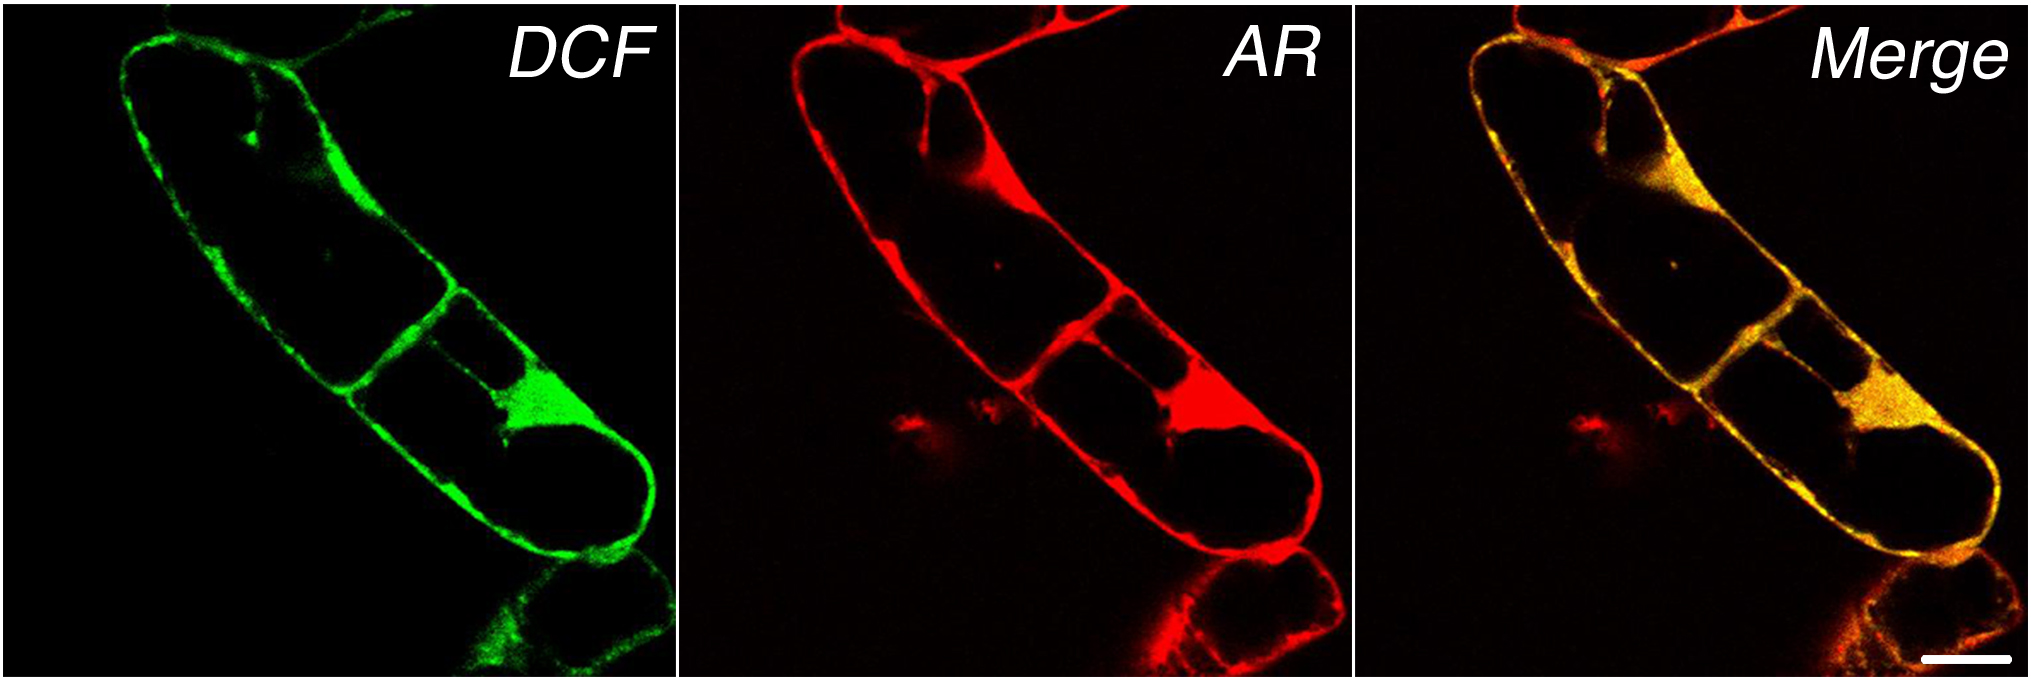
Supplemental Figure S2. Imaging of H2O2 accumulation in BY-2 cells stained with DCF and AR.
Supplemental Figure S3. Examination of the fluorescent properties of AR and AUR reagents in the presence of DPI and catalase.
Supplementary Material
Acknowledgments
We thank Dvora Dolev for helpful technical assistance and Dr. Toyoki Amano (Department of Biology, Shizuoka University, Japan) for kindly providing the cryptogein construct.
This work was supported in part by a grant from the Israel Science Foundation (grant no. 417/03 to M.S. and R.F.) and by the Minerva Foundation (Federal German Ministry for Education and Research).
The author responsible for distribution of materials integral to the findings presented in this article in accordance with the policy described in the Instructions for Authors (www.plantphysiol.org) is: Robert Fluhr (robert.fluhr@weizmann.ac.il).
The online version of this article contains Web-only data.
Open Access articles can be viewed online without a subscription.
References
- Allan AC, Fluhr R (1997) Two distinct sources of elicited reactive oxygen species in tobacco epidermal cells. Plant Cell 9 1559–1572 [DOI] [PMC free article] [PubMed] [Google Scholar]
- Barcelo AR (2005) Xylem parenchyma cells deliver the H2O2 necessary for lignification in differentiating xylem vessels. Planta 220 747–756 [DOI] [PubMed] [Google Scholar]
- Binet MN, Humbert C, Lecourieux D, Vantard M, Pugin A (2001) Disruption of microtubular cytoskeleton induced by cryptogein, an elicitor of hypersensitive response in tobacco cells. Plant Physiol 125 564–572 [DOI] [PMC free article] [PubMed] [Google Scholar]
- Bolte S, Talbot C, Boutte Y, Catrice O, Read ND, Satiat-Jeunemaitre B (2004) FM-dyes as experimental probes for dissecting vesicle trafficking in living plant cells. J Microsc (Oxf) 214 159–173 [DOI] [PubMed] [Google Scholar]
- Bourque S, Binet MN, Ponchet M, Pugin A, Lebrun-Garcia A (1999) Characterization of the cryptogein binding sites on plant plasma membranes. J Biol Chem 274 34699–34705 [DOI] [PubMed] [Google Scholar]
- Cumming RC, Andon NL, Haynes PA, Park M, Fischer WH, Schubert D (2004) Protein disulfide bond formation in the cytoplasm during oxidative stress. J Biol Chem 279 21749–21758 [DOI] [PubMed] [Google Scholar]
- Delledonne M, Zeier J, Marocco A, Lamb C (2001) Signal interactions between nitric oxide and reactive oxygen intermediates in the plant hypersensitive disease resistance response. Proc Natl Acad Sci USA 98 13454–13459 [DOI] [PMC free article] [PubMed] [Google Scholar]
- Dixit R, Cyr R (2003) Cell damage and reactive oxygen species production induced by fluorescence microscopy: effect on mitosis and guidelines for non-invasive fluorescence microscopy. Plant J 36 280–290 [DOI] [PubMed] [Google Scholar]
- Dos Santos CV, Rey P (2006) Plant thioredoxins are key actors in the oxidative stress response. Trends Plant Sci 11 329–334 [DOI] [PubMed] [Google Scholar]
- Driouich A, Zhang GF, Staehelin LA (1993) Effect of brefeldin A on the structure of the Golgi apparatus and on the synthesis and secretion of proteins and polysaccharides in sycamore maple (Acer pseudoplatanus) suspension-cultured cells. Plant Physiol 101 1363–1373 [DOI] [PMC free article] [PubMed] [Google Scholar]
- Echevarria W, Leite MF, Guerra MT, Zipfel WR, Nathanson MH (2003) Regulation of calcium signals in the nucleus by a nucleoplasmic reticulum. Nat Cell Biol 5 440–446 [DOI] [PMC free article] [PubMed] [Google Scholar]
- Fedoroff N (2006) Redox regulatory mechanisms in cellular stress responses. Ann Bot (Lond) 98 289–300 [DOI] [PMC free article] [PubMed] [Google Scholar]
- Foreman J, Demidchik V, Bothwell JHF, Mylona P, Miedema H, Torres MA, Linstead P, Costa S, Brownlee C, Jones JDG, et al (2003) Reactive oxygen species produced by NADPH oxidase regulate plant cell growth. Nature 422 442–446 [DOI] [PubMed] [Google Scholar]
- Freedman RB, Hirst TR, Tuite MF (1994) Protein disulfide isomerase: building bridges in protein folding. Trends Biochem Sci 19 331–336 [DOI] [PubMed] [Google Scholar]
- Fujiwara T, Oda K, Yokota S, Takatsuki A, Ikehara Y (1988) Brefeldin-A causes disassembly of the Golgi complex and accumulation of secretory proteins in the endoplasmic-reticulum. J Biol Chem 263 18545–18552 [PubMed] [Google Scholar]
- Garnier L, Simon-Plas F, Thuleau P, Agnel JP, Blein JP, Ranjeva R, Montillet JL (2006) Cadmium affects tobacco cells by a series of three waves of reactive oxygen species that contribute to cytotoxicity. Plant Cell Environ 29 1956–1969 [DOI] [PubMed] [Google Scholar]
- Gerber IB, Dubery IA (2003) Fluorescence microplate assay for the detection of oxidative burst products in tobacco cell suspensions using 2′,7′-dichlorofluorescein. Methods Cell Sci 25 115–122 [DOI] [PubMed] [Google Scholar]
- Grant JJ, Loake GJ (2000) Role of reactive oxygen intermediates and cognate redox signaling in disease resistance. Plant Physiol 124 21–29 [DOI] [PMC free article] [PubMed] [Google Scholar]
- Groom QJ, Torres MA, Fordham-Skelton AP, Hammond-Kosack KE, Robinson NJ, Jones JDG (1996) rbohA, a rice homologue of the mammalian gp91phox respiratory burst oxidase gene. Plant J 10 515–522 [DOI] [PubMed] [Google Scholar]
- Hansen JM, Go YM, Jones DP (2006) Nuclear and mitochondrial compartmentation of oxidative stress and redox signaling. Annu Rev Pharmacol 46 215–234 [DOI] [PubMed] [Google Scholar]
- Hwang C, Sinskey AJ, Lodish HF (1992) Oxidized redox state of glutathione in the endoplasmic reticulum. Science 257 1496–1502 [DOI] [PubMed] [Google Scholar]
- Jiang M, Zhang J (2003) Cross-talk between calcium and reactive oxygen species originated from NADPH oxidase in abscisic acid-induced antioxidant defence in leaves of maize seedlings. Plant Cell Environ 26 929–939 [DOI] [PubMed] [Google Scholar]
- Jiang MY, Zhang JH (2002) Involvement of plasma-membrane NADPH oxidase in abscisic acid- and water stress-induced antioxidant defense in leaves of maize seedlings. Planta 215 1022–1030 [DOI] [PubMed] [Google Scholar]
- Joo JH, Wang SY, Chen JG, Jones AM, Fedoroff NV (2005) Different signaling and cell death roles of heterotrimeric G protein α and β subunits in the Arabidopsis oxidative stress response to ozone. Plant Cell 17 957–970 [DOI] [PMC free article] [PubMed] [Google Scholar]
- Kadota Y, Goh T, Tomatsu H, Tamauchi R, Higashi K, Muto S, Kuchitsu K (2004) Cryptogein-induced initial events in tobacco BY-2 cells: Pharmacological characterization of molecular relationship among cytosolic Ca2+ transients, anion efflux and production of reactive oxygen species. Plant Cell Physiol 45 160–170 [DOI] [PubMed] [Google Scholar]
- Kaplan B, Davydov O, Knight H, Galon Y, Knight MR, Fluhr R, Fromm H (2006) Rapid transcriptome changes induced by cytosolic Ca2+ transients reveal ABRE-related sequences as Ca2+-responsive cis elements in Arabidopsis. Plant Cell 18 2733–2748 [DOI] [PMC free article] [PubMed] [Google Scholar]
- Keller H, Blein JP, Bonnet P, Ricci P (1996) Physiological and molecular characteristics of elicitin-induced systemic acquired resistance in tobacco. Plant Physiol 110 365–376 [DOI] [PMC free article] [PubMed] [Google Scholar]
- Keller T, Damude HG, Werner D, Doerner P, Dixon RA, Lamb C (1998) A plant homolog of the neutrophil NADPH oxidase gp91phox subunit gene encodes a plasma membrane protein with Ca2+ binding motifs. Plant Cell 10 255–266 [DOI] [PMC free article] [PubMed] [Google Scholar]
- Klausner RD, Donaldson JG, Lippincottschwartz J (1992) Brefeldin A: insights into the control of membrane traffic and organelle structure. J Cell Biol 116 1071–1080 [DOI] [PMC free article] [PubMed] [Google Scholar]
- Kuroda J, Nakagawa K, Yamasaki T, Nakamura K, Takeya R, Kuribayashi F, Imajoh-Ohmi S, Igarashi K, Shibata Y, Sueishi K, et al (2005) The superoxide-producing NAD(P)H oxidase Nox4 in the nucleus of human vascular endothelial cells. Genes Cells 10 1139–1151 [DOI] [PubMed] [Google Scholar]
- Kwak JM, Mori IC, Pei ZM, Leonhardt N, Torres MA, Dangl JL, Bloom RE, Bodde S, Jones JDG, Schroeder JI (2003) NADPH oxidase AtrbohD and AtrbohF genes function in ROS-dependent ABA signaling in Arabidopsis. EMBO J 22 2623–2633 [DOI] [PMC free article] [PubMed] [Google Scholar]
- Mazura P, Fohlerova R, Brzobohaty B, Kiran NS, Janda L (2006) A new, sensitive method for enzyme kinetic studies of scarce glucosides. J Biochem Bioph Methods 68 55–63 [DOI] [PubMed] [Google Scholar]
- Mohanty JG, Jaffe JS, Schulman ES, Raible DG (1997) A highly sensitive fluorescent micro-assay of H2O2 release from activated human leukocytes using a dihydroxyphenoxazine derivative. J Immunol Methods 202 133–141 [DOI] [PubMed] [Google Scholar]
- Moller IM (2001) Plant mitochondria and oxidative stress: electron transport, NADPH turnover, and metabolism of reactive oxygen species. Annu Rev Plant Physiol 52 561–591 [DOI] [PubMed] [Google Scholar]
- Mori IC, Schroeder JI (2004) Reactive oxygen species activation of plant Ca2+ channels. A signaling mechanism in polar growth, hormone transduction, stress signaling, and hypothetically mechanotransduction. Plant Physiol 135 702–708 [DOI] [PMC free article] [PubMed] [Google Scholar]
- Mullineaux P, Karpinski S (2002) Signal transduction in response to excess light: getting out of the chloroplast. Curr Opin Plant Biol 5 43–48 [DOI] [PubMed] [Google Scholar]
- Murashige T, Skoog F (1962) A revised medium for rapid growth and bioassays with tobacco tissue cultures. Physiol Plant 15 473–497 [Google Scholar]
- Nagata T, Todoriki S, Kikuchi S (2004) Radial expansion of root cells and elongation of root hairs of Arabidopsis thaliana induced by massive doses of gamma irradiation. Plant Cell Physiol 45 1557–1565 [DOI] [PubMed] [Google Scholar]
- Nardai G, Korcsmaros T, Papp E, Csermely P (2003) Reduction of the endoplasmic reticulum accompanies the oxidative damage of diabetes mellitus. Biofactors 17 259–267 [DOI] [PubMed] [Google Scholar]
- Nebenfuhr A, Ritzenthaler C, Robinson DG (2002) Brefeldin A: deciphering an enigmatic inhibitor of secretion. Plant Physiol 130 1102–1108 [DOI] [PMC free article] [PubMed] [Google Scholar]
- Neill S, Desikan R, Hancock J (2002) Hydrogen peroxide signalling. Curr Opin Plant Biol 5 388–395 [DOI] [PubMed] [Google Scholar]
- Nurnberger T, Scheel D (2001) Signal transmission in the plant immune response. Trends Plant Sci 6 372–379 [DOI] [PubMed] [Google Scholar]
- O'Donohue MJ, Boissy G, Huet JC, Nespoulous C, Brunie S, Pernollet JC (1996) Overexpression in Pichia pastoris and crystallization of an elicitor protein secreted by the phytopathogenic fungus, Phytophthora cryptogea. Protein Expr Purif 8 254–261 [DOI] [PubMed] [Google Scholar]
- Okushima Y, Koizumi N, Yamaguchi Y, Kimata Y, Kohno K, Sano H (2002) Isolation and characterization of a putative transducer of endoplasmic reticulum stress in Oryza sativa. Plant Cell Physiol 43 532–539 [DOI] [PubMed] [Google Scholar]
- Overmyer K, Brosche M, Kangasjarvi J (2003) Reactive oxygen species and hormonal control of cell death. Trends Plant Sci 8 335–342 [DOI] [PubMed] [Google Scholar]
- Panabieres F, Marais A, LeBerre JY, Penot I, Fournier D, Ricci P (1995) Characterization of a gene cluster of Phytophthora cryptogea which codes for elicitins, proteins inducing a hypersensitive-like response in tobacco. Mol Plant-Microbe Interact 8 996–1003 [DOI] [PubMed] [Google Scholar]
- Pauly N, Knight MR, Thuleau P, van der Luit AH, Moreau M, Trewavas AJ, Ranjeva R, Mazars C (2000) Cell signalling: control of free calcium in plant cell nuclei. Nature 405 754–755 [DOI] [PubMed] [Google Scholar]
- Pugin A, Frachisse JM, Tavernier E, Bligny R, Gout E, Douce R, Guern J (1997) Early events induced by the elicitor cryptogein in tobacco cells: involvement of a plasma membrane NADPH oxidase and activation of glycolysis and the pentose phosphate pathway. Plant Cell 9 2077–2091 [DOI] [PMC free article] [PubMed] [Google Scholar]
- Renew S, Heyno E, Schopfer P, Liszkay A (2005) Sensitive detection and localization of hydroxyl radical production in cucumber roots and Arabidopsis seedlings by spin trapping electron paramagnetic resonance spectroscopy. Plant J 44 342–347 [DOI] [PubMed] [Google Scholar]
- Ricci P, Bonnet P, Huet JC, Sallantin M, Beauvaiscante F, Bruneteau M, Billard V, Michel G, Pernollet JC (1989) Structure and activity of proteins from pathogenic fungi Phytophthora eliciting necrosis and acquired-resistance in tobacco. Eur J Biochem 183 555–563 [DOI] [PubMed] [Google Scholar]
- Richter-Unruh A, Verhoef-Post M, Malak S, Homoki J, Hauffa BP, Themmen APN (2004) Leydig cell hypoplasia: absent luteinizing hormone receptor cell surface expression caused by a novel homozygous mutation in the extracellular domain. J Clin Endocrinol Metab 89 5161–5167 [DOI] [PubMed] [Google Scholar]
- Ritzenthaler C, Nebenfuhr A, Movafeghi A, Stussi-Garaud C, Behnia L, Pimpl P, Staehelin LA, Robinson DG (2002) Reevaluation of the effects of brefeldin A on plant cells using tobacco bright yellow 2 cells expressing Golgi-targeted green fluorescent protein and COPI antisera. Plant Cell 14 237–261 [DOI] [PMC free article] [PubMed] [Google Scholar]
- Sagi M, Davydov O, Orazova S, Yesbergenova Z, Ophir R, Stratmann JW, Fluhr R (2004) Plant respiratory burst oxidase homologs impinge on wound responsiveness and development in Lycopersicon esculentum. Plant Cell 16 616–628 [DOI] [PMC free article] [PubMed] [Google Scholar]
- Sagi M, Fluhr R (2001) Superoxide production by plant homologues of the gp91phox NADPH oxidase. Modulation of activity by calcium and by tobacco mosaic virus infection. Plant Physiol 126 1281–1290 [DOI] [PMC free article] [PubMed] [Google Scholar]
- Sagi M, Fluhr R (2006) Production of reactive oxygen species by plant NADPH oxidases. Plant Physiol 141 336–340 [DOI] [PMC free article] [PubMed] [Google Scholar]
- Sanders D, Pelloux J, Brownlee C, Harper JF (2002) Calcium at the crossroads of signaling. Plant Cell (Suppl) 14 S401–S417 [DOI] [PMC free article] [PubMed] [Google Scholar]
- Simon-Plas F, Elmayan T, Blein JP (2002) The plasma membrane oxidase NtrbohD is responsible for AOS production in elicited tobacco cells. Plant J 31 137–147 [DOI] [PubMed] [Google Scholar]
- Staehelin LA (1997) The plant ER: a dynamic organelle composed of a large number of discrete functional domains. Plant J 11 1151–1165 [DOI] [PubMed] [Google Scholar]
- Stoppin V, Vantard M, Schmit AC, Lambert AM (1994) Isolated plant nuclei nucleate microtubule assembly: the nuclear surface in higher plants has centrosome like activity. Plant Cell 6 1099–1106 [DOI] [PMC free article] [PubMed] [Google Scholar]
- Torres MA, Dangl JL, Jones JDG (2002) Arabidopsis gp91phox homologues AtrbohD and AtrbohF are required for accumulation of reactive oxygen intermediates in the plant defense response. Proc Natl Acad Sci USA 99 517–522 [DOI] [PMC free article] [PubMed] [Google Scholar]
- Towne V, Will M, Oswald B, Zhao QJ (2004) Complexities in horseradish peroxidase-catalyzed oxidation of dihydroxyphenoxazine derivatives: appropriate ranges for pH values and hydrogen peroxide concentrations in quantitative analysis. Anal Biochem 334 290–296 [DOI] [PubMed] [Google Scholar]
- Zanella B, Calonghi N, Pagnotta E, Masotti L, Guarnieri C (2002) Mitochondrial nitric oxide localization in H9c2 cells revealed by confocal microscopy. Biochem Biophys Res Commun 290 1010–1014 [DOI] [PubMed] [Google Scholar]
- Zaninotto F, La Camera S, Polverari A, Delledonne M (2006) Cross talk between reactive nitrogen and oxygen species during the hypersensitive disease resistance response. Plant Physiol 141 379–383 [DOI] [PMC free article] [PubMed] [Google Scholar]
- Zhao YZ, Gao S, Chou IN, Toselli P, Stone P, Li WD (2006) Inhibition of the expression of lysyl oxidase and its substrates in cadmium-resistant rat fetal lung fibroblasts. Toxicol Sci 90 478–489 [DOI] [PubMed] [Google Scholar]
- Zhou MJ, Diwu ZJ, Panchuk-Voloshina N, Haugland RP (1997) A stable nonfluorescent derivative of resorufin for the fluorometric determination of trace hydrogen peroxide: applications in detecting the activity of phagocyte NADPH oxidase and other oxidases. Anal Biochem 253 162–168 [DOI] [PubMed] [Google Scholar]
Associated Data
This section collects any data citations, data availability statements, or supplementary materials included in this article.