

Abstract
Gap junctions have diverse roles in a wide variety of tissues and have recently become a subject of intense investigation in neural circuits where synchrony and oscillations may play an important part. In circuits where gap junctions are present, the possibility arises of identifying intercommunicating cells via introduction of tracer into one cell and observing its spread into its coupled neighbors. Staining the coupled cells by this means opens the door to many vital techniques including paired-cell electrophysiology, RT-PCR, and morphological characterization of previously unknown coupled cells. Tracers commonly used at the present time are not generally suitable for these purposes in many tissues, including neurons. This paper describes how a fluorescent nuclear tracer, Po-pro-1, can be used to visualize coupled cells in several types of retinal neurons thought to be comprised of different connexin proteins including Cx36, Cx45, Cx50, and Cx57.
Keywords: gap junction, connexin, electrical couplin, retina
Intracellular communication as produced by gap junctions is extremely diverse in terms of tissue localization, type of constituent proteins forming the channels, and putative functions (Spray et al. 1999). The modern study of gap junctions, including evidence for their participation in neural circuitry, began almost 50 years ago (Watanabe 1958; Bennett et al. 1959; Furshpan and Potter 1959). It is only in the last few years, however, that the notion that gap junctions might be widespread in mammalian neural circuitry has taken firm hold. Evidence for electrical coupling in oscillatory and synchronous behavior in a variety of circuits has rapidly accrued (Galarreta and Hestrin 2001; Devor and Yarom 2002; Bennett and Zukin 2004; Connors and Long 2004). coupling is often found among different classes of cells (heterologous coupling). unless two cells are simultaneously patch clamped and also happen to be coupled, it is usually difficult to identify both participants in an electrical synapse between heterologous partners. introduction of tracer into one cell may demonstrate coupling by virtue of its passage into a neighboring cell, but the morphology of the coupled cells is usually not clear.
Although the study of gap junctions has been greatly enriched by tracer studies (e.g., Simpson et al. 1977; Brink and Dewey 1980), classic tracers such as Lucifer Yellow and carboxyfluorescein have been of limited use in neural circuits. A major reason for this is that neural gap junctions are most often comprised of connexins with selectivity for cationic tracers, and the majority of the popular fluorescent tracers are anionic. Cx36 and most other connexins found in the retina do not pass negatively charged tracers well (Mills and Massey 1995,2000).
Introduction of biocytin and Neurobiotin (Vector Laboratories; Burlingame, CA) as tracers (Vaney 1991) was a great step forward in identifying sites of gap junctions in neurons (Devor and Yarom 2002; Venance et al. 2004). In the retina, for example, Neurobiotin coupling provided the first anatomical evidence for gap junctions between many types of cells where coupling was only suspected or previously unknown (Vaney 1991). Most of these have been subsequently confirmed by other means (Massey and Mills 1999; Jacoby and Marshak 2000).
A limitation of Neurobiotin is that it is non-fluorescent—its presence and flow must be assayed following tissue fixation, permeabilization, and exposure to an avidin-derived molecule that has a fluorescent tag. This renders in vivo measurement impossible and diffusion measurements more difficult (Xin and Bloomfield 1997; Mills and Massey 1998,2000) than with fluorescent tracers.
There has long been the need for a fluorescent tracer with the following ideal properties: it should be (1) bright, (2) photostable, (3) membrane impermeant, (4) sufficiently small to pass readily through gap junctional channels, and (5) positively charged. We have tested many candidates but found them to perform less than satisfactory. Here we report that a blue nuclear dye, Po-pro-1, can serve as an in vivo fluorescent tracer for many coupled cell types including several coupled networks in the retina and between pairs of HeLa cells transfected with Cx35.
Materials and Methods
Adult albino rabbits were deeply anesthetized with injections of urethane (1.5 g/kg, IP) and then humanely killed by intracardial injection of 5 cc urethane following removal of the eyes. All procedures were in accordance with the guidelines of the University of Texas at Houston Animal Welfare Committee, NIH guidelines, and the Declaration of Helsinki. Retinas were separated from the sclera and pigment epithelium, mounted ganglion cell (vitreal) side up on filter paper, placed in a chamber, and continuously perfused with oxygenated Ames solution (Sigma; St Louis, MO). Injections were performed on an Olympus BX50WI microscope (Olympus; Tokyo, Japan) with mercury epifluorescence, using a standard blue-violet (BV) filter cube. Ganglion cells were targeted by application of one or two drops of .0001% acridine orange (Invitrogen; Carlsbad, CA) dissolved in perfusion medium. This procedure labels the somas of the entire population of ganglion cells within 30 sec. Alpha ganglion cells are recognizable as the largest somas in the ganglion cell layer. Dye injection into large pentagonal somas usually stains ON alpha ganglion cells, whereas injection of large oval somas stains OFF alpha ganglion cells with >95% accuracy. We targeted PA1 amacrine cells by adding another drop or two of the acridine orange solution, after which we could locate somas of the few types of amacrine cells that have some of their cell bodies located within the inner plexiform layer. Fluorescent nuclei of PA1 cells were slightly oval and the largest and most numerous of the three amacrine cell types that could be found by this method (Wright and Vaney 2004). We labeled A- and B-type horizontal cells, OFF cone bipolar cells, and AII amacrine cells by incubation of the entire retina in the blue fluorescent dye, 4,6-diamino-2-phenylindole (DAPI, 30 μM; Invitrogen) for 18 min. We previously found that these and other cell types could be reliably labeled by varying DAPI concentration and incubation time (Mills and Massey 1991,1992,1994,1998).
Individual cells were filled by iontophoresis (+1 to 2.5 nA, 3 Hz, 10-15 min) with thin-wall glass electrodes tip-filled with >10 mM Po-pro-1 in distilled water. Invitrogen generally supplies Po-pro-1 (catalog #P-3581) as a 1-mM solution in 100% DMSO. We obtained it in dry powder form from their bulk sales department and found it easily soluble in water to >10 mM. Po-pro-1-targeted cells were filled with 3.5% Neurobiotin + 0.5% Lucifer Yellow, and the retinas were then fixed in 4% paraformaldehyde for 1 hr. Cells were visualized by overnight incubation in 1:1000 streptavidin-Cy3 (Jackson ImmunoResearch; West Grove, PA). A polyclonal antibody to choline acetyltransferase raised in goat (Chemicon International; Temecula, CA) and conjugated to the secondary antibody donkey anti-goat Cy5 (1:200; Jackson ImmunoResearch) was used as a fiducial marker for stratification of filled cells within the inner plexiform layer.
To test tracer movement in an expression system, HeLa cells stably transfected with perch Cx35 in pcDNA 3.1 zeocin were plated onto glass coverslips and incubated for 3 days (O'Brien et al. 2004). Cells were fed 1-6 hr prior to tracer injection experiments. Tracer was injected into individual transfected confluent cells. Carbenoxolone (25 μM; Sigma) was used to reduce coupling in some experiments and was added to the perfusion media 3 min prior to dye injection and maintained until the coverslip was removed for fixation. Previous studies indicated that this was a sufficient amount of time for the full effect to take place in this preparation; 15 min was sufficient in whole-mount retina ~100-μm thick.
Po-pro-1 fluorescence was photographed using a Leica DFC 350FX digital camera (Meyer Instruments; Houston, TX) using the BV-type filter cube (excitation: 400-440; dichroic: DM455; barrier filter: 475LP) of the Olympus BX50WI microscope. Cells filled with Neurobiotin or Lucifer Yellow were imaged using a Zeiss 510 MetaFluor confocal microscope (Carl Zeiss; Oberkochen, Germany). Neurobiotin visualized by streptavidin-Cy3 was imaged using the 543 HeNe1 laser line, whereas Lucifer Yellow was imaged with the Argon/2 488 line. Oil-immersion objectives [Zeiss PlanNeofluor X40 numerical aperture (NA) = 1.3 and Zeiss PlanAPOChromat X63; NA = 1] were used. The pinhole was set to 1 airy unit and tissue was sampled at 0.5-um intervals. Stack sizes were as stated in the figure captions. × and Y resolutions were 0.2-0.3 μm.
Properties of Po-pro-1
Po-pro-1 has many of the properties desirable in a gap junction-permeant fluorescent tracer: it is bright and photostable (extinction coefficient = 50,000). Its structure is shown in Figure 1A. Its absorption spectra (Figure 1B) is well positioned for the 405- and 436-nm lines of a mercury lamp. Po-pro-1 is well confined inside the membrane in healthy tissue but is not notably sequestered other than by binding to nucleic acid. The molecular mass of Po-pro-1 is 579 Da; when the two iodide salts are removed in solution, its ionic molecular mass is 325 Da with a net charge of +2. Thus, its small size and net positive charge enable it to pass through the majority of gap junctions including neural junctions.
Figure 1.

Absorption and emission spectra (A) and structure (B) of Po-pro-1.
Po-pro-1 can be readily iontophoresed into target cells. Electrodes pulled from thin-wall glass and whose resistances would measure ~25 MΩ with Neurobiotin have resistances of 50-100 MΩ when filled with Po-pro-1 prepared as described in the Materials and Methods section. Po-pro-1 has a relatively small Stokes shift with an excitation peak at 435 nm; its peak emission is at 455 nm. It is not visible through a standard UV (DAPI) filter set. Although not strongly fluorescent until bound to nucleic acid, Po-pro-1 in the electrode is nevertheless sufficiently fluorescent to enable accurate impalement of the target cells when viewed through the BV-type filter cube.
Results
Testing Po-pro-1 in a Transfected Cell Line
Properties of gap junctional connexins are often studied in expression systems. Figure 2A shows how Po-pro-1 traverses the gap junctions formed by transfection of Cx35, the fish ortholog of the mammalian neural connexin, Cx36, into a HeLa cell line. At high gain, 11 HeLa cells can be distinguished above background as coupled to the injected cell. Figure 2B shows the loss of Po-pro-1 coupling when 25 μM carbenoxolone, a gap junctional blocker, is added to the perfusion solution. This establishes that the coupling observed in Figure 2A was indeed mediated by gap junctions and not by leakage or some other nonspecific mechanism.
Figure 2.
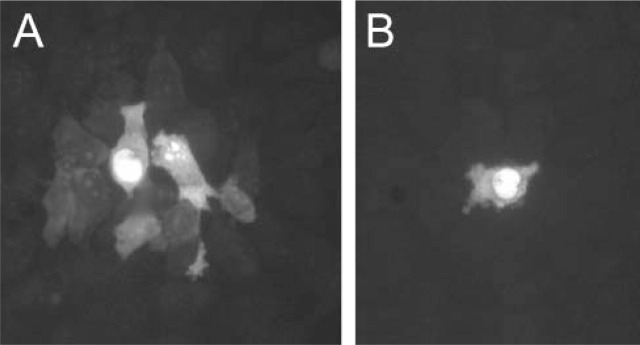
(A) Injection of Po-pro-1 into a single HeLa cell transfected with Cx35 produced Po-pro-1 fluorescence in several neighboring cells. (B) Inclusion of 25 μM carbenoxolone in the perfusion media closed gap junctions and restricted Po-pro-1 fluorescence to the injected cell.
Po-pro-1 Passes Through Neural Gap Junctions in Mammalian Retina
Mammalian retina is an excellent tissue for testing potential tracers for neural gap junctions (Vaney 1991) because a great many cell types are electrically coupled via gap junctions comprised of a variety of connexin types (Massey et al. 2004; O'Brien et al. 2004). Tracer coupling is well established between axonless (A-type) horizontal cells, which consist of large gap junctions that will pass both anionic and cationic tracers and are probably comprised of Cx50 (Massey et al. 2004). Other cells whose tracer-coupling properties are well characterized include axon-bearing (B-type) horizontal cells that may be comprised of Cx57 (Hombach et al. 2004), the AII (rod) amacrine cell, which is coupled both to neighboring AII amacrine cells via Cx36 (Feigenspan et al. 2001; Mills et al. 2001) and to ON cone bipolar cells that may use Cx45 (Maxeiner et al. 2005), and alpha ganglion cells that have been reported to be coupled to other alpha ganglion cells via Cx36 (Hidaka et al. 2004; Schubert et al. 2005) and two or more populations of amacrine cells (connexin unknown) in a variety of species. Many other types of amacrine cells are coupled to amacrine cells, both of the same and of different types (Xin and Bloomfield 1997), and several types of ganglion cells are coupled to amacrine cells, although the identity of the amacrine cells is usually unknown.
Iontophoresis of Po-pro-1 into each of these cell types produced visible evidence of tracer coupling in vivo. Figure 3A shows the typically extensive coupling between pairs of A-type horizontal cells. These gap junctions are some of the largest known neural gap junctions (Massey et al. 2004) and are one of the few neural gap junctions that will pass Lucifer Yellow. Figure 3B similarly shows coupling between B-type horizontal cells, which do not pass Lucifer Yellow. Po-pro-1 tracer coupling allows coupled cells to be visualized in the living retinal preparation and subsequently targeted for electrophysiology, including paired recordings or injection of other tracers.
Figure 3.

(A) Injection of Po-pro-1 into a single A-type horizontal cell (center) extensively labeled the coupled mosaic of neighboring A-type horizontal cells. Focus is on the processes. (B) Injection of Po-pro-1 into a single B-type horizontal cell (arrow) labeled the soma and the initial processes of the injected cell. Nuclei of several coupled cells were also labeled. Two of these were subsequently injected with Lucifer Yellow to reveal the full B-type horizontal cell characteristic morphology shown to the left and right of the injected cell.
AII amacrine cells are coupled via gap junctions to both neighboring AII amacrine cells and to ON cone bipolar cells. Figure 4 shows Po-pro-1 coupling produced via injection of Po-pro-1 into a single AII amacrine cell soma. Several neighboring AII amacrine cells are fluorescent following Po-pro-1 diffusion into their somas. Several ON cone bipolar cells are also stained with Po-pro-1. Injection of Lucifer Yellow into one of the large coupled somas produced the characteristic AII amacrine cell morphology, focused here on the level of the lobules. Retinal bipolar cells can be reliably discriminated from horizontal cells by size and from amacrine cells by both depth and size. Further, OFF cone bipolar cells are labeled with DAPI, whereas ON cone bipolar cells are not (Mills and Massey 1992). Therefore, small Po-pro-1-fluorescent somas that are not also labeled by the DAPI incubation are ON cone bipolar cells. Injection of Lucifer Yellow into some of these small Po-pro-1-fluorescent somas confirmed that they were ON cone bipolar cells (not shown).
Figure 4.

Injection of Po-pro-1 into a single AII amacrine cell (arrow) produces a variety of coupled somas (blue) located both in the distal and proximal inner nuclear layer (arrowheads). Injection of Neurobiotin into the proximal coupled somas reveals the diagnostic morphology of an AII amacrine cell (red), focused here on the soma and lobular appendages. ON cone bipolar cells (unmarked blue somas) are also visible.
Po-pro-1 Allows Unambiguous Identification of Cells in Heterologous Networks
Several types of ganglion cells are also tracer coupled to ganglion cells of the same type, to one or more populations of amacrine cells, or to both (Vaney 1991; Dacey and Brace 1992; Xin and Bloomfield 1997). Figure 5A shows the patterns of fluorescent somas labeled after injection of Po-pro-1 into an OFF alpha ganglion cell whose Po-pro-1 fluorescence is still visible. Figure 5B shows that Po-pro-1 injection into an ON alpha ganglion cell did not produce additional fluorescent somas. The ON alpha ganglion cell is not coupled in rabbit retina by tracer or metabolic coupling or by electrophysiology (DeVries 1999; Marc and Jones 2002; Hu and Bloomfield 2003), thereby reinforcing the notion that staining is via gap junctions and not by diffusion through the membrane and reuptake of Po-pro-1 into other cells. Figure 6 shows the morphology of an amacrine cell visualized via Po-pro-1 diffusion from an OFF alpha ganglion cell and subsequently injected with Neurobiotin. For the first time, the full morphology of this type of axon-bearing amacrine cell is revealed and unequivocally associated with the OFF alpha ganglion cell as a regularly occurring interconnected component of this circuit. Injection of Neurobiotin into these Po-pro-1-labeled amacrine cells often produced Neurobiotin staining in the ganglion cell originally injected with Po-pro-1, again establishing that amacrine cells are stained via gap junctional diffusion of Po-pro-1.
Figure 5.

(A) Injection of Po-pro-1 into an OFF alpha ganglion cell produced numerous fluorescent-coupled somas (three of which are labeled with asterisks) at a time when the Po-pro-1 fluorescence of the injected cell still fills much of the cell. (B) Po-pro-1 injection into an ON alpha ganglion cell did not produce additional fluorescent somas.
Figure 6.

Injection of Neurobiotin into an amacrine cell targeted by its fluorescence following injection of Po-pro-1 into an OFF alpha ganglion cell shows the full morphology of the amacrine cell. This is a wide-field amacrine cell with an axon-bearing morphology. (Inset) Po-pro-1 injection into an OFF alpha ganglion cell soma (out of frame) produced visible Po-pro-1 fluorescence in nearby ganglion cells. Neurobiotin injection into one of these fluorescent ganglion cell somas confirms specificity of tracer diffusion by revealing the dendritic arbor of an OFF alpha ganglion cell as well as coupled somas of other OFF alpha ganglion cells (arrows) and numerous amacrine cell somas. Bar = 200 μm.
Although OFF alpha ganglion cells are identifiable by their Po-pro-1 fluorescence at the time of injection, this fluorescence is typically restricted to only the soma after fixation and processing for streptavidin-Cy 3 (to label the Neurobiotin-injected amacrine cells). We verified on many occasions the correspondence between the OFF alpha ganglion cells and this type of coupled amacrine cell by either subsequently injecting Lucifer Yellow into the original Po-pro-1-labeled ganglion cell (not shown) or by injecting ganglion cell somas that were labeled by Po-pro-1 diffusion from the originally injected ganglion cell. Figure 6 shows an example of this latter case, where Neurobiotin injection into a Po-pro-1-coupled ganglion cell reveals not only the diagnostic morphology of an OFF alpha ganglion cell but also Neurobiotin coupling to other OFF alpha ganglion cells. The numerous smaller-stained somas belong to the amacrine cells coupled to the Neurobiotin-injected ganglion cell. The original Po-pro-1-injected soma is out of the frame of this micrograph.
Wright and Vaney (2004) studied the morphology of an axon-bearing (polyaxonal) amacrine cell called the PA1. Injection of Neurobiotin into a PA1 labeled the somas of many amacrine cells coupled to it and sometimes a small ganglion cell. They tentatively identified this ganglion cell as the so-called local edge-detector ganglion cell based upon its size and costratification with the processes of PA1 amacrine cells, and because the local edge detector is coupled to amacrine cells. We have confirmed this identification by injecting Po-pro-1 into a PA1 amacrine cell and then filling some of the resultant fluorescent somas with Neurobiotin. Figure 7 is a confocal stack (maximum intensity projection) of 70 images taken at 0.5-μm intervals showing the original Po-pro-1 injection, a ganglion cell targeted via coupled Po-pro-1 fluorescence in the ganglion cell layer, and a different PA1 amacrine cell targeted by its Po-pro-1 fluorescence in the amacrine cell layer. The axon of the ganglion cell is shown in Figure 7B, a stack encompassing only the ganglion cell and nerve fiber layers and also in Figure 7A, where it is faintly visible. Other PA1 cells were stained via Neurobiotin coupling following injection of Neurobiotin into the PA1. The Po-pro-1-filled PA1 was targeted via its fluorescence following application of acridine orange and the location of its soma in the inner plexiform layer according to Wright and Vaney (2004), who also showed that PA1 somas could be located in the inner plexiform layer, the ganglion cell layer, or the inner nuclear layer. Figure 7C shows the stratification depth of this ganglion cell, which matches that of the local edge-detector ganglion cell and PA1 amacrine cell.
Figure 7.

Injection of Po-pro-1 intoa PA1 amacrine cell (medium arrow) produced fluorescent somas in both the ganglion and amacrine cell layers. (A) Injection of Neurobiotin into somas in the amacrine cell layer fully stained another PA1 amacrine cell (asterisk) as well as other putative PA1 somas via Neurobiotin coupling, one of which is marked with a long arrow. Injection of Neurobiotin into the fluorescent soma in the ganglion cell layer stained a small ganglion cell with the stratification and morphology of the so-called local edge detector (arrowhead). Axon is marked by short arrows here and in (B), where the axon is highlighted in a stack of 8 × 1-μm images encompassing the ganglion cell and nerve fiber layers. (C) Stratification depth revealed by a z-axis reconstruction of this injection demonstrates that the ganglion cell processes (red) ramify between the two bands of choline acetyltransferase immunoreactivity (green), characteristic of the local edge-detector ganglion cell.
Discussion
Introduction of tracer into a cell that makes gap junctions with other cells is a powerful technique that allows detailing of the full morphology of the coupled cells. This identifies two (or more) members of a synaptic circuit that form a processing unit. When this can be done in vivo, it provides the even more powerful possibility of recording from the coupled cell, which would be unlikely to be found other than by trial and error in a tissue with complex organization such as the central nervous system.
Two different types of tracer may be useful in this way. The first type will stain the entire coupled cell and reveal its full morphology. Neurobiotin has served well in this first case with some limitations. In a great many preparations, only the somas and possibly the proximal dendrites of the coupled cells are revealed, leaving the identity of the coupled cells unknown. In other preparations such as the AII amacrine cell, the stained arbor of coupled cells is so extensive as to obscure the individual details of the coupled cells, again leaving them unidentifiable. Neurobiotin is also not visible in vivo, obviating the possibility of vital assays of cell function.
In these cases, the second type of tracer whose fluorescence is restricted to the nucleus can overcome many of these obstacles. The signal-to-noise ratio is improved without the background of fluorescence from cell processes but, most importantly, a target is provided for subsequent analysis in vivo. This can include staining of individual examples of the coupled cell and physiological recording.
Relative Intensity of Coupled Cells
We have previously used measurement of the intensities of coupled cells to model the flow and relative distribution of Neurobiotin through retinal gap junctions (Mills and Massey 1998,2000; Xia and Mills 2004). This allows us to make some observations regarding the ability to detect Po-pro-1 in tracer-coupled cells. The major variables that determine detectability of tracer-coupled somas are many and include the threshold for detection of that tracer, sequestration/compartmentalization in the cell, amount of time tracer is permitted to diffuse from the injected cell to those coupled, relative impedances and sizes of the compartments coupled to the injection site, and diffusion coefficient that determines the flux of tracer between the various compartments. Diffusion among retinal neurons ranges from rapid in A-type horizontal cells (Figure 3) to sluggish (gap junctions between photoreceptors or between poorly coupled amacrine cells). Therefore, intensity of the coupled cell can range from nearly equal to the injected cell to well below threshold. Our Neurobiotin-coupled preparations suggest a range of detection of ~3 log10 units (Mills and Massey 1998).
Major differences between Po-pro-1 and Neurobiotin that affect relative coupling are the relative diffusion coefficients, compartmentalization, and threshold for detection. Po-pro-1, which has a molecular mass 17% larger than Neurobiotin, diffuses somewhat less rapidly. Quantification of intensities and estimation of diffusion rates are complicated by the compartmentalization problem. Po-pro-1 binds to nucleic acid and is virtually non-fluorescent when unbound. Its concentration in the cytoplasm is not measurable, whereas its concentration in the nucleus is often sufficient to produce a saturated fluorescent signal. Some estimation of diffusion rates is possible by carefully examining the sequence of elapsed times when each coupled cell just becomes fluorescent, but this rigorous and difficult procedure is beyond the scope of this study. Finally, the rapidity and brightness of fluorescent labeling during the injection procedure lead us to believe that the threshold of detection for Po-pro-1 is considerably lower than that for Neurobiotin. For these reasons, we believe that coupling via Po-pro-1 injection will be readily detectable over a range of coupling efficiencies between cells that encompass most of the range of tracer coupling previously observed in neural tissues. Comparison ofthe relative coupling of amacrine cells to ganglion cells in the rabbit retina suggests that the lower end of the Neurobiotin coupling range may not be detectable with Po-pro-1 as the tracer. Because we believe that Po-pro-1 has a lower detection threshold, this probably means that its larger size leads to a reduced diffusion rate across the gap junctions, but that concentrations as low as 2-2.5 log10 units below that of the injected cell are detectable.
Limitations
Po-pro-1 is a very sensitive nuclear dye. It is not uncommon for cells nicked with the electrode to fluoresce strongly, confirming identity of the truly coupled cells more difficult. However, in many cases, injection of Neurobiotin into the Po-pro-1-coupled cells will produce Neurobiotin staining of the cell originally injected with Po-pro-1, confirming the existence of the gap junctional pathway.
Po-pro-1 is not fixable, making the possibility of double-label experiments using immunocytochemistry or other tracer methods difficult, although it was not unusual for the soma of the injected cell to be identifiable by residual Po-pro-1 fluorescence days after fixation and after exposure to permeabilizing agents such as Triton X-100. Photostability of Po-pro-1 is good, although dim cells can be faded if exposed to unduly long fluorescence.
Although there was no evidence of diffusion through the membrane in healthy tissue, some cells filled with Po-pro-1 did not retain the dye for periods >30 min. It may be that the amount of Po-pro-1 injected into large cells eventually equilibrates over the volume of the cell and the nuclear fluorescence drops below the threshold of detection.
Applications
We have shown examples of how cells of many different types connected via gap junctions to a cell injected with Po-pro-1 can be targeted and identified. These include some previously known coupled pairs for establishing validity and also previously unknown coupled cells to demonstrate the promise of the technique. It is clear that Po-pro-1 can serve as a valuable tool for the identification and physiological characterization of coupled cells and the study of mechanisms modulating that coupling in intact, living preparations. The ability to visualize coupled cells opens many possibilities using current techniques of staining, physiology, and molecular biology.
Examples shown in this study come from the mammalian retina, which has well-characterized cell types and structure. Po-pro-1 may be an even more valuable tool in brain structures whose cell types and connectivity are less well characterized, but where oscillations and synchrony may play pivotal roles
Acknowledgments
This research was supported by National Institutes of Health Grants EY-10121 (to SLM), EY-12857 (to JOB), and core grant EY-10608, and Research to Prevent Blindness (an unrestricted award to the Department of Ophthalmology and Visual Science, University of Texas at Houston-Health Science Center, Houston, TX).
Literature Cited
- Bennett MVL, Crain SM, Grundfest H. (1959) Electrophysiology of supramedullary neurons in Spheroides maculates. I. Orthodromic and antidromic responses. J Gen Physiol 43:159–188 [DOI] [PMC free article] [PubMed] [Google Scholar]
- Bennett MVL, Zukin RS. (2004) Electrical coupling and neuronal synchronization in the mammalian brain. Neuron 41:495–511 [DOI] [PubMed] [Google Scholar]
- Brink PR, Dewey MM. (1980) Evidence for fixed charge in the nexus. Nature 285:101–102 [DOI] [PubMed] [Google Scholar]
- Connors BW, Long MA. (2004) Electrical synapses in the mammalian brain. Annu Rev Neurosci 27:393–418 [DOI] [PubMed] [Google Scholar]
- Dacey DM, Brace S. (1992) A coupled network for parasol but not midget ganglion cells in the primate retina. Vis Neurosci 9:279–290 [DOI] [PubMed] [Google Scholar]
- Devor A, Yarom Y. (2002) Electrotonic coupling in the inferior olivary nucleus revealed by simultaneous double patch recordings. J Neurophysiol 87:3048–3058 [DOI] [PubMed] [Google Scholar]
- DeVries SH. (1999) Correlated firing in rabbit retinal ganglion cells. J Neurophysiol 81:908–920 [DOI] [PubMed] [Google Scholar]
- Feigenspan A, Teubner B, Willecke K, Weiler R. (2001) Expression of neuronal connexin 36 in AII amacrine cells of the mammalian retina. J Neurosci 21:230–239 [DOI] [PMC free article] [PubMed] [Google Scholar]
- Furshpan EJ, Potter DD. (1959) Transmission at the giant motor synapses of the crayfish. J Physiol 145:289–325 [DOI] [PMC free article] [PubMed] [Google Scholar]
- Galarreta M, Hestrin S. (2001) Spike transmission and synchrony detection in networks of GABAergic interneurons. Science 292: 2295–2299 [DOI] [PubMed] [Google Scholar]
- Hidaka S, Akohari Y, Kurosawa Y. (2004) Dendrodendritic electrical synapses between mammalian retinal ganglion cells. J Neurosci 24:10553–10567 [DOI] [PMC free article] [PubMed] [Google Scholar]
- Hombach S, Janssen-Bienhold U, Sohl G, Schubert T, Bussow H, Ott T, Weiler R, et al. (2004) Functional expression of connexin57 in horizontal cells of the mouse retina. Eur J Neurosci 19:2633–2640 [DOI] [PubMed] [Google Scholar]
- Hu EH, Bloomfield SA. (2003) Gap junctional coupling underlies the short-latency spike synchrony of retinal alpha ganglion cells. J Neurosci 23:6768–6777 [DOI] [PMC free article] [PubMed] [Google Scholar]
- Jacoby RA, Marshak DW. (2000) Synaptic connections of DB3 diffuse bipolar cell axons in macaque retina. J Comp Neurol 416:19–29 [DOI] [PMC free article] [PubMed] [Google Scholar]
- Marc RE, Jones BW. (2002) Molecular phenotyping of retinal ganglion cells. J Neurosci 22:413–427 [DOI] [PMC free article] [PubMed] [Google Scholar]
- Maxeiner S, Dedek K, Janssen-Bienhold U, Ammermuller J, Brune H, Kirsch T, Pieper M, et al. (2005) Deletion of connexin45 in mouse retinal neurons disrupts the rod/cone signaling pathway between AII amacrine and ON cone bipolar cells and leads to impaired visual transmission. J Neurosci 25:566–576 [DOI] [PMC free article] [PubMed] [Google Scholar]
- Massey SC, Mills SL. (1999) Gap junctions between AII amacrine cells and calbindin-positive bipolar cells in the rabbit retina. Vis Neurosci 16:181–189 [DOI] [PubMed] [Google Scholar]
- Massey SC, O'Brien JJ, Trexler EB, Li W, Keung JW, Mills SL, O'Brien J. (2004) Multiple neuronal connexins in the mammalian retina. Cell Commun Adhes 10:425–430 [DOI] [PubMed] [Google Scholar]
- Mills SL, Massey SC. (1991) Labeling and distribution of AII amacrine cells in the rabbit retina. J Comp Neurol 304:491–501 [DOI] [PubMed] [Google Scholar]
- Mills SL, Massey SC. (1992) Morphology of bipolar cells in the rabbit retina labeled by DAPI. J Comp Neurol 321:133–149 [DOI] [PubMed] [Google Scholar]
- Mills SL, Massey SC. (1994) Distribution and coverage of A- and B-type horizontal cells stained with Neurobiotin in the rabbit retina. Vis Neurosci 11:549–560 [DOI] [PubMed] [Google Scholar]
- Mills SL, Massey SC. (1995) Differential properties of two gap junctional pathways made by AII amacrine cells. Nature 377:734–737 [DOI] [PubMed] [Google Scholar]
- Mills SL, Massey SC. (1998) The kinetics of tracer movement through homologous retinal gap junctions. Vis Neurosci 15:765–77 [DOI] [PMC free article] [PubMed] [Google Scholar]
- Mills SL, Massey SC. (2000) A series of biotinylated tracers distinguishes three types of gap junction in retina. J Neurosci 20: 8629–8636 [DOI] [PMC free article] [PubMed] [Google Scholar]
- Mills SL, O'Brien JJ, Li W, O'Brien J, Massey SC. (2001) Rod pathways in the mammalian retina use connexin36. J Comp Neurol 436:336–350 [PMC free article] [PubMed] [Google Scholar]
- O'Brien J, Nguyen HB, Mills SL. (2004) Cone photoreceptors in bass retina use two connexins to mediate electrical coupling. J Neurosci 24:5632–5642 [DOI] [PMC free article] [PubMed] [Google Scholar]
- Schubert T, Degen J, Willecke K, Hormuzdi SG, Monyer H, Weiler R. (2005) Connexin36 mediates gap junctional coupling of alpha-ganglion cells in mouse retina. J Comp Neurol 485:191–201 [DOI] [PubMed] [Google Scholar]
- Simpson I, Rose B, Loewenstein WR. (1977) Size limit of molecules permeating the junctional membrane channels. Science 195:294–296 [DOI] [PubMed] [Google Scholar]
- Spray DC, Scemes E, Rozental R. (1999) Cell-cell communication via gap junctions. In Zigmond MJ, Bloom FE, Landis SC, Roberts JL, Squire LR, eds. Fundamental Neuroscience. San Diego, Academic Press, 317–343 [Google Scholar]
- Vaney DI. (1991) Many diverse types of retinal neurons show tracer coupling when injected with biocytin or Neurobiotin. Neurosci Lett 125:187–190 [DOI] [PubMed] [Google Scholar]
- Venance L, Glowinski J, Giaume C. (2004) Electrical and chemical transmission between striatal GABAergic output neurones in rat brain slices. J Physiol 559:215–230 [DOI] [PMC free article] [PubMed] [Google Scholar]
- Watanabe A. (1958) The interaction of electrical activity among neurons of lobster cardiac ganglion. Jpn J Physiol 8:305–318 [DOI] [PubMed] [Google Scholar]
- Wright LL, Vaney DI. (2004) The type 1 polyaxonal amacrine cells of the rabbit retina: a tracer-coupling study. Vis Neurosci 21:145–155 [DOI] [PubMed] [Google Scholar]
- Xia XB, Mills SL. (2004) Gap junctional regulatory mechanisms in the AII amacrine cell of the rabbit retina. Vis Neurosci 21:791–805 [DOI] [PMC free article] [PubMed] [Google Scholar]
- Xin D, Bloomfield SA. (1997) Tracer coupling pattern of amacrine and ganglion cells in the rabbit retina. J Comp Neurol 383:512–528 [DOI] [PubMed] [Google Scholar]