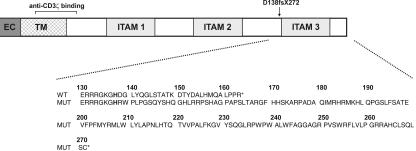
Figure 5.
Diagram of patient CD3ζ mutation. The extracellular (EC), transmembrane (TM), and 3 intracellular ITAMs of wild-type CD3ζ protein are depicted along with the location of the homozygous patient mutation and the recognition site of the anti-CD3ζ Ab used in the present study. Wild-type (WT) and patient (MUT) CD3ζ amino acid sequences in the region affected by the mutation are shown in the expanded view. X indicates stop codon; and fs, frameshift.

