

Abstract
Borderline personality disorder places a significant burden on healthcare providers and other agencies. This study evaluated the cost-effectiveness of cognitive behavior therapy plus treatment as usual compared to treatment as usual alone for patients with borderline personality disorder. The economic analysis was conducted alongside a multi-center, randomized controlled trial. The costs of primary and secondary healthcare utilization, alongside the wider economic costs, were estimated from medical records and patient self-report. The primary outcome measure used was the quality-adjusted life year (QALY), assessed using EuroQol. On average, total costs per patient in the cognitive behavior therapy group were lower than patients receiving usual care alone (−£689), although this group also reported a lower quality of life (−0.11 QALYs). These differences were small and did not approach conventional levels of statistical significance. The use of cognitive therapy for borderline personality disorder does not appear to demonstrate any significant cost-effective advantage based on the results of this study.
Borderline personality disorder (BPD) is a severe personality dysfunction that has been reported to affect approximately 2% of the adult population (Bateman & Fonagy, 2004). BPD imposes a significant burden on primary and secondary health care services as well as other statutory service providers (Zanari, Frankenburg, Hebben, & Silk, 2004). Several studies have attempted to quantify the potential economic impact of personality disorders more generally. In a cost of illness study, (Smith, Shah, Wright, & Lewis, 1995) estimated that the annual cost of personality disorders to the National Health Service (NHS) amounted to over £61 million in 1986. More recently (Rendu, Moran, Patel, Knapp, & Mann, 2002) assessed the costs of personality disorders amongst general practice attendees in the UK. The mean total costs (health and non-health related) for patients with personality disorder was £3,094 compared with £1,633 for those without personality disorder. This study also highlighted the considerable burden on non-health care providers and the wider economy, the costs of which accounted for over 80% of the total costs assessed. The total economic impact of BPD remains largely unknown.
Faced with finite resources it is essential that decisions concerning the management of patients with BPD are made on both effectiveness and cost-effectiveness grounds. Despite the potential economic burden associated with BPD, there is only limited evidence from existing studies on the potential cost-effectiveness of alternative treatments for this group. Although no formal cost-effectiveness studies have been undertaken in BPD, there have been studies which have previously assessed the health care utilization and costs of alternative treatments (Bateman & Fonagy, 2003; Chiesa, Fonagy, Holmes, Drahorad, & Harrison-Hall, 2002). For example, Bateman and Fonagy (2003) assessed the health care costs associated with psychoanalytically oriented partial hospital treatment for borderline personality disorder compared with treatment as usual within general psychiatric services (Bateman & Fonagy, 2003). This study demonstrated that the additional costs of partial hospital treatment were offset by less psychiatric inpatient care and reduced emergency room treatment during follow-up. However, the statistical analyses were confined to assessing the difference within groups for the separate assessment periods (pretreatment, treatment, and follow-up), as opposed to examining the difference between groups. In the absence of formal cost-effectiveness analyses only tentative conclusions can be drawn regarding the relative cost-effectiveness of particular interventions based on existing studies. The limited evidence on cost-effectiveness in BPD is in marked contrast to the number of economic evaluations that have been conducted in other areas of mental health.
We have previously described the rational, trial methodology, and the primary and secondary outcomes of the BOSCOT (Borderline Personality Disorder Study of Cognitive Therapy) randomized controlled trial (Davidson, Tyrer et al., 2006; Davidson, Norrie et al., 2006). An integral part of the design of this study was the inclusion of an economic study to assess the cost-effectiveness of cognitive behavior therapy in addition to treatment as usual (CBT plus TAU) compared to TAU alone. In this paper, we present the results of the cost-effectiveness analysis. Although CBT is resource intensive and therefore potentially costly, it was anticipated that the effectiveness of CBT would result in reductions in resource use and costs during follow-up which would be of sufficient magnitude to offset any cost disadvantage compared to TAU alone.
METHOD
The primary objective of the economic analysis was to assess the relative cost-effectiveness CBT plus TAU, in comparison with TAU, in subjects with BPD. The economic analysis was conducted prospectively alongside a multi-center, randomized controlled trial. The methodology of this trial has been described in detail elsewhere and is summarized in brief below (Davidson et al., 2006).
SUBJECTS
The study was conducted in three centers (Glasgow, London, & Ayrshire/Arran) across three different NHS regions in the U.K. Patients were recruited if they were aged between 18 and 65 years, met criteria for at least 5 items of the borderline personality disorder using the Structured Clinical Interview for DSM IV Axis II Personality Disorders (SCID-II; First, Gibbon, Spitzer, Williams, & Benjamin, 1996), had received either inpatient psychiatric services or an assessment at accident and emergency services or an episode of deliberate self-harm (either suicidal act or self-mutilation) in the previous 12 months and were able to give informed consent. Patients were excluded if they were currently receiving inpatient treatment for a mental state disorder, currently receiving a systematic psychological therapy or specialist service, particularly psychodynamic psychotherapy, had insufficient knowledge of English to enable them to be assessed adequately and to understand the treatment approach, temporarily resident in the area, and those who had evidence of an organic illness, mental impairment, alcohol or drug dependence, schizophrenia or bipolar affective disorder.
INTERVENTIONS
106 subjects were randomised to receive CBT plus TAU (n = 54) or TAU alone (n = 52). All participants received the standard treatment (TAU) they would have received if the trial had not been in place. In addition, the cognitive behaviour therapy group were offered an average of 27 sessions of CBT, of which, an average of 16 sessions were subsequently attended.
Patients included in the intervention and control groups were followed up for two years from entry into the trial. Trained research assistants who were blind to treatment condition conducted all assessment interviews. Patients were assessed immediately prior to randomization and then in face-to-face interviews every six months.
CLINICAL OUTCOMES
The primary clinical outcome measure applied in the trial was based on a composite measure, comprising of three elements: 1. suicidal acts, 2. inpatient psychiatric hospitalization, and 3. accident and emergency (A&E) attendance. Full details and results of the primary and secondary outcomes are reported in full in the main trial paper (Davidson et al., 2006). In summary, the odds ratio based on the primary composite outcome measure for the CBT plus TAU group, compared with TAU alone, was 0.70 (95% confidence interval [CI] 0.38 to 1.31, p = 0.27). In terms of the number of suicidal acts, a significant reduction over the follow-up period was reported in favor of CBT plus TAU compared to TAU alone (mean difference −0.91; 95% CI 1.67 to −0.17, p = 0.02). Additional evidence for the benefit of the addition of CBT was also observed in a number of secondary outcomes including positive symptom distress index at one year follow-up, state anxiety and dysfunctional beliefs at two-year follow-up.
A potential limitation of using these measures of outcome in a cost-effectiveness analysis is that they preclude comparison of the cost-effectiveness of CBT plus TAU for personality disorder with other interventions seeking NHS funding. Decisions concerning resource allocation often need to be taken across specialties and disease areas. If these decisions are to be informed by cost-effectiveness analysis then it is crucial that the outcome measure adopted is generic (i.e., that it has meaning outside the clinical area within which it is used). The use of a single, generic measure of health benefit enables diverse healthcare interventions to be compared, thus enabling broader questions of efficiency to be addressed (Palmer & Torgerson, 1999).
In this study the main outcome for the cost-effectiveness analysis was the quality-adjusted life year (QALY), assessed using the EuroQol (EQ-5D) instrument. The EQ-5D questionnaire is a standardized generic instrument for measuring health-related quality of life (EuroQol Group, 1990). The EQ-5D consists of 5 health dimensions: mobility, self-care, usual activities, pain/discomfort, and anxiety/depression. Each dimension has three levels of severity (no problems, moderate problems, and severe problems) that generate 245 unique health states into which a patient can be classified. Patients in this study were asked to classify themselves into one of these health states at baseline, and at 6 monthly intervals over the study period of two years.
In addition to providing a description of the health states, the EQ-5D also provides a single preference weight (also described as a utility or value) for each health state. Preference weights for the 245 unique health states, valued on a 0 (equivalent to dead) to 1 (equivalent to full health) valuation scale, were based on interviews with a representative sample of 3395 members of the U.K. general public (Dolan, Gudex, & Kind, 1995). The test-retest reliability and construct validity of the EuroQol questionnaire has been demonstrated (Van Agt, Essink, Krabbe, & Bonsel, 1994). The use of generic, validated Quality of Life (QoL) measures and general population weights in the application of cost-effectiveness analysis has been recommended for policy level decision-making and now form part of the reference case for cost-effectiveness studies submitted to the National Institute for Health and Clinical Excellence (NICE; National Institute for Clinical Excellence, 2004). These values can be used as quality-adjustment weights to turn a profile of health states over time into quality-adjusted life years (QALYs).
The measure of outcome used in the cost-effectiveness analysis was the difference between the two randomized groups based on mean QALYs over the two year study period, adjusting for baseline EQ-5D scores (Manca, Hawkins, & Sculpher, 2005). QALYs were discounted by the annual rate of 3.5% as recommended by the UK Treasury.
RESOURCE USE AND COSTS
The analysis was undertaken from a broad perspective to evaluate the impact of the treatment on a number of different parties, including patients, the National Health Service, Social Services and other providers of care.
Data on secondary health care utilization including inpatient, outpatient, day patient, and A&E services were obtained from the patient's hospital records by the research assistants. Hospital records were checked at the end of the study to ensure that the research assistants remained blind to treatment allocation. Information on hospital resource utilization was collected for two periods: baseline (covering the 6 months period before randomization) and follow-up (covering the two year follow-up period). Details of primary care and community-based services, direct non-health care costs (e.g., travel, childcare) and accommodation were obtained from patient self-report using an adapted version of the Client Service Receipt Inventory (CSRI; Knapp & Beecham, 1990). The CSRI was administered at baseline and then at 6 monthly intervals. At the baseline and subsequent follow-up assessments, information was collected on resource utilization and costs covering the 6-month period prior to the date of interview.
Unit costs of hospital services were calculated from local estimates derived from the English NHS Trust Financial Returns and NHS costs for Scotland (Chartered Institute of Public Finance and Accountancy, 2004; National Health Service in Scotland, 2004). Where local data was not available, unit cost estimates were obtained from national literature sources and databases (Netten & Curtis, 2004). All unit cost data were adjusted to 2003/2004 prices using the relevant price indices. Information related to the costs incurred by patients themselves (e.g., travel, childcare, over the counter medications, etc.) was obtained directly from the CSRI data.
The treatment costs for CBT were calculated using a detailed bottom-up costing exercise. This was based on the cost per minute taken from the mid-point of the relevant (2003/2004) salary scales for the therapists (and supervisors), including employers' contributions, and overhead costs. The additional costs of non-face to face activities (e.g., writing up notes, supervision) were also included.
The unit costs estimates were then combined with the resource utilization data to obtain a net cost per patient over the entire follow-up period for the trial. Costs were then discounted by the annual rate of 3.5% as recommended by the U.K. Treasury.
COST-EFFECTIVENESS ANALYSIS
Cost-effectiveness was undertaken by relating the differential cost per patient receiving either the intervention or the control treatment to their differential effectiveness in terms of QALYs. The incremental cost-effectiveness ratio (ICER) was calculated as the difference in mean cost divided by the difference in the mean QALYs (Drummond, O' Brien, Stoddart, & Torrance, 1997). A cost-effectiveness acceptability curve (CEAC) was used to incorporate the uncertainty around the sample estimates of mean costs and outcomes and uncertainty about the maximum (or ceiling) ICER that the NHS would consider acceptable. The curve shows the probability that the data are consistent with a true cost-effectiveness ratio falling below any particular ceiling ratio, based on the observed size and variance of the differences in both the costs and outcomes in the trial (Van Hout, Gordon, & Rutten, 1994; Fenwick, Claxton, & Sculpher, 2001). This approach to the statistical analysis of the ICER avoids the difficulties associated with the estimation of confidence intervals for the ICER (Van Hout et al., 1994).
STATISTICAL METHODS
Cost and outcome data were analyzed on an intention to treat basis from randomization to two year follow-up, or the two year notional interview date where appropriate (i.e., in cases where the patient did not attend the final follow-up assessment, medical records were examined from the date of randomization to the date that the two-year follow-up had been planned). While complete data from hospital notes were available for all patients, data from the CSRI and the EQ-5D were missing in a small number of cases. Multiple imputation was used to impute the missing cost and EQ-5D data. This imputation method offers significant advantages over simple imputation procedures (e.g., mean imputation) in that the uncertainty observed in the complete data is preserved by imputing several different values (in this analysis 5 different values were estimated) per missing data entry (Schafer, 1999). The five complete datasets were then combined to generate a single combined estimate for each parameter that formally incorporates the uncertainty in the missing data. Due to positive skew in the cost data a non-parametric approach to multiple imputation was implemented using a prediction model based on propensity scores and the approximate Bayesian bootstrap to generate the imputations.
All data were analyzed using STATA 7.0 (STATACorp, 1997). Multiple imputation was undertaken using SOLAS 3.1 (Statistical Solutions, 1999).
RESULTS
CLINICAL OUTCOMES
Table 1 reports the summary statistics for patient responses to the EQ-5D questionnaire at baseline and at each 6 month interval. On average, patients in the CBT plus TAU group reported a slightly lower quality of life than the TAU group at baseline and at all follow-up periods. The difference between the two groups appears small and did not approach conventional levels of statistical significance, regardless of whether an adjustment was made for baseline EQ-5D scores.
Table 1.
EuroQol (EQ-5D) Summary Scores and QALY Estimates
| Outcome | TAU Mean (SD) |
CBT Mean (SD) |
Adjusted Mean Difference* (95% CI) |
|---|---|---|---|
| EQ-5D scores | |||
| Baseline | 0.5233 (0.3578) | 0.4872 (0.3656) | |
| 6 Months | 0.5793 (0.3640) | 0.4916 (0.3230) | −0.0757 (−0.1918 to 0.0404) |
| 12 Months | 0.6048 (0.3737) | 0.5098 (0.4535) | −0.0763 (−0.2306 to 0.0779) |
| 18 Months | 0.6797 (0.3067) | 0.6206 (0.3304) | −0.0479 (−0.1616 to 0.0657) |
| 24 Months | 0.6550 (0.3493) | 0.6033 (0.3877) | −0.0402 (−0.1685 to 0.0880) |
| QALYs | 1.2042 (0.4724) | 1.0633 (0.5614) | −0.1082 (−0.2613 to 0.0449) |
Note. QALYs represent a quality-weighted measure of health outcome over the 2-years follow-up. EQ-5D scores at each follow-up assessment are used to quality-weight each follow-up period. Area-under curve calculations are then used to estimate QALYs. For example, an individual with perfect health would have an EQ-5D score of 1—this would translate to a QALY estimate of 2 QALYs over the 2-year follow-up.
Adjusted for baseline EQ-5D scores
Converting the EQ-5D scores into QALYs resulted in a loss of 0.11 (95% CI: 0.26 to 0.04) QALYs for the CBT plus TAU group compared to TAU. As with the individual EQ-5D scores, the overall QALY difference was minor and did not reach statistical significance. Across both treatment arms there was gradual and sustained improvement in EQ-5D scores, with some evidence that the majority of benefits in the CBT group were conferred once therapy had been completed.
BASELINE RESOURCE USE AND COSTS
Table 2 details the mean (Standard Deviation [SD]) and median (Interquartile Range [IQR]) number of contacts patients had with all services over the 6-month period prior to randomization. Use of resources varied between groups although, with the exception of inpatient utilization, no particularly large differences were observed. A higher proportion of patients were admitted for inpatient treatment in the TAU group (54% vs. 46%), resulting in a higher estimate for the mean (14.02 vs. 7.4 days) and median (1 vs. 0 days) length of stay for patients randomized to TAU. Between 89% and 94% of patients in both groups attended the outpatient department and attendance rates with the general practioner were remarkably similar (96% in both groups). Almost 50% of patients in both groups attended A&E services during this period. In addition, a relatively high proportion of patients in both groups had involvement with the criminal justice service; between 7% to 15% of patients had been arrested and/or attended court during this period.
Table 2.
Baseline Resource Utilization
| TAU |
CBT |
|||||||
|---|---|---|---|---|---|---|---|---|
| Service | Mean (SD) |
Median (I.Q.R) |
Used by (%) |
Mean (SD) |
Median (I.Q.R) |
Used by (%) |
Unit | Unit cost or range (£) |
| Hospital Services | ||||||||
| Inpatient | 14.02 (26.48) | 1 (0–13) | 54% | 7.40 (15.38) | 0 (0–5.75) | 46% | Day | 219–659 |
| Outpatient | 6.21 (10.21) | 4 (2–7.75) | 94% | 6.37 (10.07) | 4 (2–7) | 89% | Attendance | 55–148 |
| Day Case | 0.04 (0.19) | 0 (0–0) | 4% | 0.06 (0.31) | 0 (0–0) | 4% | Day | 455–567 |
| Day Hospital | 3.10 (12.17) | 0 (0–0) | 14% | 2.54 (11.27) | 0 (0–0) | 10% | Attendance | 84–86 |
| A&E | 1.31 (2.24) | 1 (0–1.75) | 52% | 1.04 (1.69) | 1 (0–1) | 46% | Attendance | 69–79 |
| Community Day Services | ||||||||
| Day care centre | 1.67 (7.81) | 0 (0–0) | 10% | 3.2 (12.75) | 0 (0–0) | 9% | Day | 36 |
| Drop-in centre | 2.03 (11.33) | 0 (0–0) | 6% | 3.54 (19.7) | 0 (0–0) | 13% | Session | 18 |
| Sheltered workshop | 0.96 (6.93) | 0 (0–0) | 2% | 0 (0) | 0 (0–0) | 0% | Attendance | 32 |
| Primary and Community | ||||||||
| GP (surgery visit) | 6.83 (6.69) | 4.5 (3–11.5) | 96% | 8.09 (7.47) | 6 (3–12) | 96% | Visit | 19 |
| GP (home visit) | 0.6 (2.55) | 0 (0–0) | 17% | 0.13 (0.48) | 0 (0–0) | 9% | Visit | 59 |
| Practice Nurse (home visit) | 0.81 (1.88) | 0 (0–1) | 31% | 2.74 (13.09) | 0 (0–1.25) | 39% | Visit | 14 |
| Counselor | 1.73 (7.18) | 0 (0–0) | 15% | 1.02 (4.21) | 0 (0–0) | 11% | Visit | 33 (per/hour) |
| District Nurse | 0.79 (5.01) | 0 (0–0) | 6% | 0.41 (2.11) | 0 (0–0) | 4% | Visit | 20 |
| CPN/Case manager | 6.27 (11.09) | 2.5 (0–6.75) | 65% | 8.33 (11.88) | 4 (0–12.25) | 69% | Visit | 28 |
| Social worker/Care manager | 5.88 (14.93) | 0 (0–3.75) | 39% | 1.78 (4.99) | 0 (0–0) | 22% | Visit | 99 (per/hour) |
| Occupational Therapist | 2.21 (14.56) | 0 (0–0) | 6% | 1 (4.64) | 0 (0–0) | 6% | Visit | 35 |
| Advocate | 0.04 (0.19) | 0 (0–0) | 4% | 0.22 (0.97) | 0 (0–0) | 7% | Visit | 20–35 |
| Home help/care worker | 2.52 (13.86) | 0 (0–0) | 9% | 3.41 (24.9) | 0 (0–0) | 4% | Visit | 7 |
| Other | 6.06 (17.54) | 0 (0–2) | 40% | 7.44 (26.98) | 0 (0–1) | 41% | Visit | 7–35 |
| Accommodation | ||||||||
| Community (non-hospital) | 15.5 (49.10) | 0 (0–0) | 12% | 3.35 (24.63) | 0 (0–0) | 2% | Day | 39–70 |
| Criminal Justice Services | ||||||||
| Arrests | 0.12 (0.32) | 0 (0–0) | 12% | 0.07 (0.26) | 0 (0–0) | 7% | Arrests | 1353 |
| Magistrate Court | 0.27 (0.93) | 0 (0–0) | 12% | 0.26 (0.83) | 0 (0–0) | 15% | Appearances | 564 |
| Crown Court | 0.08 (0.43) | 0 (0–0) | 4% | 0.06 (0.30) | 0 (0–0) | 4% | Appearances | 9214 |
| Prison services | 0.08 (0.39) | 0 (0–0) | 4% | 0 (0) | 0 (0–0) | 0% | Day | 86 |
| Patient Costs | ||||||||
| Meds/fines/childcare etc. | NA | NA | 71% | NA | NA | 70% | Various | NA |
Table 3 reports the baseline costs for each of the major types of service. Costs of hospital services (consisting of inpatient, outpatient, day, and A&E services) comprised the largest component of cost and accounted for 56% of total costs in both groups. While the percentage of total costs attributed to hospital services was identical in both groups, the absolute level of total costs incurred by patients randomized to receive TAU was higher than the CBT plus TAU group. On average, higher baseline costs were reported for the TAU group across five of the six major service areas reported. Although none of these individual areas were significantly different between the groups, when these separate elements were combined, the resulting estimate of total costs was significantly higher in the TAU group at baseline (£2621; 95% CI £81–£5214; p = 0.02). Subsequent analyses of follow-up costs were therefore adjusted to reflect this statistical imbalance of costs reported during the baseline period.
Table 3.
Baseline Costs
| TAU |
CBT |
CBT-TAU |
|||
|---|---|---|---|---|---|
| Mean (SD) (£ sterling) |
% of Total | Mean (SD) (£ sterling) |
% of Total | Mean diff (95% CI) (£ sterling) |
|
| Hospital Services | 4443 (6677) | 56% | 2914 (4179) | 56% | −1528 (−3707, 562) |
| Community Day Services | 127 (399) | 2% | 179 (569) | 3% | 52 (−121, 242) |
| Primary/Community Care | 1348 (1523) | 17% | 1107 (1018) | 21% | −241 (−699, 266) |
| Accommodation | 760 (2406) | 10% | 164 (1207) | 3% | −595 (−1327, 70) |
| Criminal Justice Services | 1023 (4257) | 13% | 758 (3216) | 14% | −265 (−1815, 997) |
| Patient Costs | 159 (347) | 2% | 116 (188) | 2% | −43 (−156, 55) |
| Total | 7860 (8284) | 100% | 5240 (5790) | 100% | −2621 (−5214, −81) |
FOLLOW-UP RESOURCE USE AND COSTS
Table 4 outlines the resource utilization over the two year follow-up period. The proportion of patients receiving inpatient treatment was very similar to the estimates reported for the period prior to randomization. While a slightly higher percentage of the CBT group received inpatient treatment (54% vs. 50%), the mean length of stay was considerably shorter compared to TAU (13.5 days vs. 32 days). This difference was largely attributed to a small number of patients in the TAU group who received lengthy inpatient care (exceeding 180 days for 2 patients). The distribution of inpatient days was highly skewed, illustrated by the similar length of stay based on the median estimate (1 vs. 0.5 for CBT plus TAU and TAU, respectively).
Table 4.
Follow-Up Resource Utilization
| TAU |
CBT |
|||||||
|---|---|---|---|---|---|---|---|---|
| Service | Mean (SD) |
Median (I.Q.R) |
Used by (%) |
Mean (SD) |
Median (I.Q.R) |
Used by (%) |
Unit | Unit cost or range (£) |
| Hospital Services | ||||||||
| Inpatient | 32 (124.17) | 0.5 (0–9.5) | 50% | 13.5 (34.47) | 1 (0–9) | 54% | Day | 219–659 |
| Outpatient | 15.4 (20.49) | 10.5 (4–19) | 96% | 15.58 (30.80) | 8 (3–15) | 85% | Attendance | 55–148 |
| Day Case | 0.1 (0.3) | 0 (0–0) | 10% | 0.25 (0.71) | 0 (0–0) | 15% | Day | 455–567 |
| Day Hospital | 4.9 (23.96) | 0 (0–0) | 15% | 8.87 (31.11) | 0 (0–0) | 12% | Attendance | 84–86 |
| A&E | 2.96 (8.26) | 0.5 (0–2.75) | 50% | 3.35 (10.74) | 1 (0–3) | 56% | Attendance | 69–79 |
| Community Day Services | ||||||||
| Day care centre | 7 (28.56) | 0 (0–0) | 14% | 1.4 (6.64) | 0 (0–0) | 8% | Day | 36 |
| Drop-in centre | 13.83 (40.26) | 0 (0–1.5) | 25% | 19.58 (58.31) | 0 (0–0) | 23% | Session | 18 |
| Sheltered workshop | 6.28 (27.25) | 0 (0–0) | 8% | 0.08 (0.47) | 0 (0–0) | 3% | Attendance | 32 |
| Primary and Community | ||||||||
| GP (surgery visit) | 17.72 (15.01) | 14.5 (8–21) | 97% | 21.1 (17.17) | 15.5 (9–27) | 98% | Visit | 19 |
| GP (home visit) | 0.28 (0.91) | 0 (0–0) | 14% | 0.65 (1.37) | 0 (0–0.75) | 25% | Visit | 59 |
| Practice Nurse (home visit) | 3.22 (4.30) | 2 (0–4.75) | 69% | 4.60 (7.00) | 2 (1–4) | 83% | Visit | 14 |
| Counselor | 2.98 (11.68) | 0 (0–0) | 9% | 4.68 (18.08) | 0 (0–0) | 9% | Visit | 33 (per/hour) |
| District Nurse | 0 (0) | 0 (0–0) | 0% | 0.05 (0.22) | 0 (0–0) | 5% | Visit | 20 |
| CPN/Case manager | 13.58 (29.49) | 0 (0–12) | 33% | 11.23 (22.70) | 0 (0–8) | 32% | Visit | 28 |
| Social worker/Care manager | 17.58 (54.32) | 0 (0–0) | 21% | 3.15 (11.79) | 0 (0–0) | 15% | Visit | 99 (per/hour) |
| Occupational Therapist | 7.35 (47.57) | 0 (0–0) | 5% | 0.43 (2.08) | 0 (0–0) | 4% | Visit | 35 |
| Advocate | 1.94 (8.86) | 0 (0–0) | 8% | 1.9 (6.36) | 0 (0–0) | 13% | Visit | 20–35 |
| Home help/care worker | 7.69 (26.95) | 0 (0–0) | 17% | 13.25 (45.96) | 0 (0–0) | 15% | Visit | 7 |
| Other | 17.40 (57.82) | 0 (0–4) | 47% | 12.76 (34.96) | 0 (0–4) | 64% | Visit | 7–35 |
| Accommodation | ||||||||
| Community (non-hospital) | 9.17 (34.37) | 0 (0–0) | 11% | 15.75 (86.20) | 0 (0–0) | 5% | Day | 39–70 |
| Criminal Justice Services | ||||||||
| Arrests | 0.11 (0.40) | 0 (0–0) | 8% | 0.18 (0.59) | 0 (0–0) | 10% | Arrests | 1353 |
| Magistrate Court | 0.75 (1.75) | 0 (0–1) | 28% | 0.23 (0.53) | 0 (0–0) | 18% | Appearances | 564 |
| Crown Court | 0.11 (0.46) | 0 (0–0) | 6% | 0.03 (0.16) | 0 (0–0) | 3% | Appearances | 9214 |
| Prison services | 0 (0) | 0 (0–0) | 0% | 0.73 (3.00) | 0 (0–0) | 10% | Day | 86 |
| Patient Costs | ||||||||
| Meds/fines/childcare etc. | NA | NA | 71% | NA | NA | 70% | Various | NA |
The proportion of patients attending outpatients and/or A&E services over the follow-up period was high in both groups. A slighlty higher number of patients in the TAU group attended outpatients (95% vs. 85%), although attendance at A&E was also marginally lower (50% vs. 56%). The mean number of attendances at both outpatients and A&E were very similar between the two groups.
Nearly the entire sample visited their GP during the follow-up period, with attendance rates between 97–98%. The mean number of GP visits (surgery and home) was slightly higher in the CBT plus TAU group, although visits from a number of other primary and community-based personnel were lower (e.g., CPN, social worker). 9% of patients in both groups visited a practice-based counselor. Finally, contact with the criminal justice service remained relatively high in both groups.
Table 5 summarizes the follow-up costs incurred by both groups over the entire follow-up period. Hospital costs comprized the largest component of costs in both groups, accounting for over 60% of costs in the TAU group and 50% for the CBT plus TAU group. Primary and community care was the next most costly resource accounting for between 17–18% of total costs in both groups. The mean total costs in the CBT plus TAU group was £12,785, compared to £18,356 for TAU. Due to the signficant cost differences reported between the two groups at baseline, the mean cost differences were adjusted for the baseline disparity using regression approaches. Adjusting for the baseline imbalance, the mean cost difference across all categories was estimated to be approximately £689 lower in the CBT plus TAU group. This difference was not statistically significant (95% CI: −£8,166 to £6,787), suggesting only minimal evidence for a cost advantage for CBT. Similarly, no statistically significant differences in costs were identified in any of the main areas of service provision and costs for patients randomized to CBT plus TAU.
Table 5.
Follow-Up Costs
| TAU |
CBT |
CBT-TAU |
|||
|---|---|---|---|---|---|
| Mean (SD) (£ sterling) |
% of Total |
Mean (SD) (£ sterling) |
% of Total |
Mean diff (95% CI)* (£ sterling)) |
|
| Hospital Services | 11041 (34558) | 60% | 6352 (10833) | 50% | −2722 (−14273, 3926) |
| Community Day Services | 590 (1690) | 3% | 325 (931) | 3% | −311 (−799, 177) |
| Primary/Community Care | 3246 (5208) | 18% | 2176 (2748) | 17% | −1012 (−2696, 671) |
| Accommodation | 428 (2735) | 2% | 562 (3542) | 4% | 647 (−504, 1798) |
| Criminal Justice Services | 2049 (7849) | 11% | 711 (3534) | 6% | −1320 (−3788, 1148) |
| Patient Costs | 574 (1085) | 3% | 686 (1301) | 5% | 145 (−278, 568) |
| CBT Costs | — | — | 1411 (488) | 11% | NA |
| Total | 18356 (38165) | 100% | £12785 (16062) | 100% | −689 (−8166, 6787) |
Adjusted mean difference (adjusted for baseline costs).
COST-EFFECTIVENESS ANALYSIS
Figure 1 presents a scatter plot of the mean differences in costs and QALYs between the groups, estimated by repeated sampling as part of the bootstrapping exercise. The x-axis and y-axis divide the graph into four quadrants. Each quandrant represents the following scenarios for CBT plus TAU in comparison with TAU (clockwise from top right): (i) more effective and more costly; (ii) more effective and less costly; (iii) less effective and less costly; and (iv) less effective and more costly. Each point represents a single bootstrap estimate of the mean cost and QALY difference. By repeatedly sampling from the trial data it is possible to reflect the resulting uncertainty for each these scenarios. The high concentration of points in quantrants (iii) and (iv) indicates that CBT appears less effective (on average) than TAU based on QALY estimates. However, the small scatter of points in quantrants (i) and (ii) indicates that there is a slight possibility that CBT is more effective than TAU. The wide dispersion of points above and below the x-axis indicates that there is considerable uncertainty about the mean differences in costs between the two interventions. A greater proportion of these points fall into quandrants (ii) and (iii) reflecting the mean cost savings previously reported for CBT.
FIGURE 1.
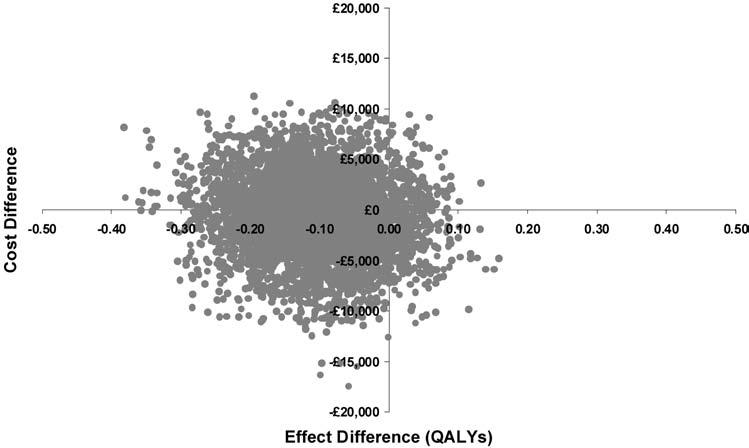
Scatter plot showing the mean difference in costs and QALYs from the trial data (differences based on CBT—TAU).
Since the CBT plus TAU group was marginally less costly (and less effective) than TAU, the calculation of the ICER was based on a comparison of the additional costs (and QALYs) for TAU compared with CBT plus TAU. In these circumstances, the issue is whether the NHS is willing to pay the implied ICER—that is, the mean difference in cost divided by the mean difference in QALYs—here £6,376 per QALY. Hence, if the NHS is prepared to pay less than £6,376 for an additional QALY, then CBT plus TAU should be considered cost-effective (and vice-versa if the NHS is prepared to pay more than this amount).
Figure 2 presents the results for the cost-effectiveness acceptability curves for CBT plus TAU and TAU alone. The curve indicates the probability that CBT plus TAU is cost-effective, compared to TAU, for a range of maximum amounts that the NHS may be willing to pay to gain an additional QALY. The curve illustrates that the probability the CBT plus TAU is cost-effective falls as the amount the NHS is assumed to be willing to pay for additional health gain rises. If the NHS is only prepared to pay £2,000 per QALY then the probability that CBT is cost-effective is 53%. At £50,000 per QALY the probability that CBT is cost-effective falls to approximately 20%.
FIGURE 2.
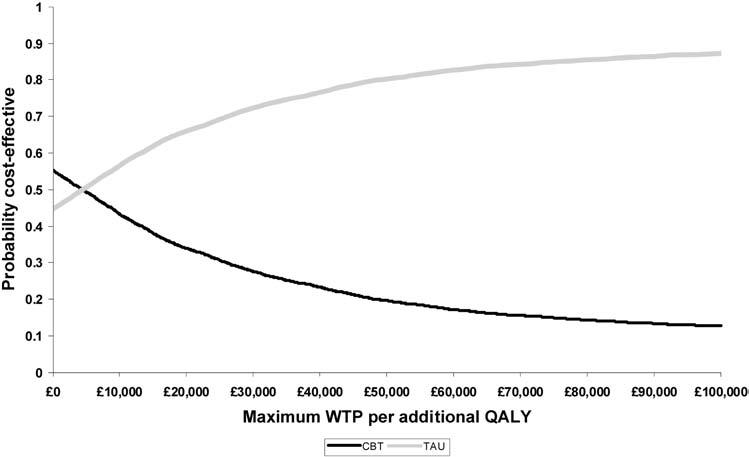
Cost-effectiveness acceptability curve showing the probability that CBT is cost-effective as a function of the threshold willingness to pay for additional health gain.
DISCUSSION
In our study, no statistically significant differences were found for either total costs or QALYs between the CBT plus TAU and TAU groups. On average, the CBT plus TAU group appeared less costly than the TAU group. The differences in the total costs were due mainly to the higher inpatient hospitalization costs incurred in the TAU group. In terms of quality of life estimates, CBT plus TAU was found to be marginally less effective than TAU (loss of 0.11 QALYs), although the observed difference was not statistically significant. The lack of a statistically significant improvement in terms of QALYs associated with the addition of CBT is not entirely surprising given that no significant differences were identified for the main clinical outcome based on a comparison of the odds ratio based on the primary composite clinical outcome reported in the accompanying clinical effectiveness paper (Davidson et al., 2006). It is also possible that the absence of a significant difference in QALYs between the groups may be due to the use of generic instrument in assessing quality of life. The EQ-5D may have simply been insensitive to changes in the quality of life of this patient group. The dimensions of the EQ-5D relate to both physical and psychological functioning and, as a result, the limited measurement of psychological functioning may mean that clinically worthwhile improvements in this aspect of health are not adequately captured. Indeed, concerns about the appropriateness of QALYs in mental health care evaluation have previously been raised (Chisholm, Healey, & Knapp, 1997). However, it may simply be the case that the use of CBT plus TAU has only a minor impact on patient quality of life in comparison with TAU alone.
Despite the lack of evidence of a significant benefit for the addition of CBT in our economic analysis, our findings do serve to highlight the severe impairment in health-related quality of life for subjects with BPD. The use of a generic outcome allows us to make meaningful comparisons with a variety of other conditions. For example, a comparison with other estimates of quality of life weights previously reported for severe mental health (including patients with severe schizophrenia/schizoaffective disorder/bipolar disorder) with a range between 0.56 and 0.65 (Tengs & Wallace, 2000), clearly highlights the poor quality of life reported by our sample of patients at baseline (range 0.49–0.52). While some of this difference may be due to the different approaches used to quantify health-related quality of life, these findings do not diminish the importance of our findings which clearly demonstrate the high economic and quality of life burden associated with BPD. In particular, the costs reported during the follow-up period were 2 to 3 times greater than the costs previously reported by Rendu et al. (2002) for primary care attendees with personality disorders.
Clearly the key question is whether CBT for borderline personality disorder provides good value for money to the NHS. As a rough guide, recent decisions and guidance from the National Institute for Clinical Excellence's Appraisal Committee suggests that a cost per QALY value of around £20,000 to £40,000 is considered value for money by the NHS (Raftery, 2001). Applying this decision rule, the use of cognitive therapy for BPD does not appear to demonstrate any significant cost-effective advantage based on the results of this study.
It is important that any conclusions that are drawn at this stage from these findings are assessed in relation to a number of possible limitations. Firstly, we have previously noted that this group of patients were difficult to engage in therapy and in our opinion may have received the minimum amount of therapy required to benefit. As such, it is clear that the results presented here may under-estimate the cost-effectiveness of CBT when it is delivered at an optimal level. Secondly, it is possible that the follow-up period was insufficient to demonstrate the long term benefits of CBT. For the purposes of cost-effectiveness analyses, it is important to consider the timeframe over which costs and benefits are likely to differ between the interventions under consideration and, in some instances, these differences may need to be accounted for over a patient's lifetime (National Institute for Clinical Excellence, 2004). As such it will be important to continue to follow this sample to ensure that the potential longer-term costs and benefits are re-assessed and are incorporated with the results presented here. Further research to confirm the validity of EQ-5D in this patient group should also be undertaken.
Footnotes
The BOSCOT Group: K. Davidson, P. Tyrer, A. Gumley, P. Tata, J. Norrie, S. Palmer, H. Millar, L. Drummond, H. Seivewright, E. Hepburn, C. Atkins, S. Iqbal, A. Langton, M. Sharp, F. Currie, M. Booker, D. Dolan, H. Murray, S. Cameron, F. Macaulay.
The research is supported by a grant from the Wellcome Trust, UK. Reference 064027/Z01/Z.
REFERENCES
- Bateman A, Fonagy P. Health service utilization costs for Borderline Personality Disorder patients treated with psychoanalytically oriented partial hospitalization versus general psychiatric care. American Journal of Psychiatry. 2003;160:169–171. doi: 10.1176/appi.ajp.160.1.169. [DOI] [PubMed] [Google Scholar]
- Bateman A, Fonagy P. Psychotherapy for borderline personality disorder: Mentalization-based treatment. Oxford: Oxford University Press; 2004. [Google Scholar]
- Chartered Institute of Public Finance and Accountancy . Health Service Financial Database. London: CIPFA; 2004. [Google Scholar]
- Chiesa M, Fonagy P, Holmes J, Drahorad C, Harrison-Hall A. Health service use costs by personality disorder following specialist and non-specialist treatment: A comparative study. Journal of Personality Disorders. 2002;16:160–173. doi: 10.1521/pedi.16.2.160.22552. [DOI] [PubMed] [Google Scholar]
- Chisholm D, Healey A, Knapp M. QALYs and mental health care. Social Psychiatry and Psychiatric Epidemiology. 1997;32:68–75. doi: 10.1007/BF00788923. [DOI] [PubMed] [Google Scholar]
- Davidson K, Tyrer P, Gumley A, Tata P, Palmer S, Miller H, et al. A randomised controlled trial of cognitive behavior therapy for borderline personality disorder: Rationale for trial, method and description of sample. Journal of Personality Disorders. 2005;20:000–000. doi: 10.1521/pedi.2006.20.5.431. [DOI] [PMC free article] [PubMed] [Google Scholar]
- Davidson K, Norrie J, Tyrer P, Gumley A, Tata P, Murray H, Palmer S. The effectiveness of cognitive behavior therapy for borderline personality disorder: Results from the BOSCOT trial. Journal of Personality Disorders. 2005;20:000–000. doi: 10.1521/pedi.2006.20.5.466. [DOI] [PMC free article] [PubMed] [Google Scholar]
- Dolan P, Gudex C, Kind P. A social tariff for EuroQol: Results from a UK general population survey. University of York: Centre for Health Economics; 1995. Report No: 138. [Google Scholar]
- Drummond MF, O'Brien B, Stoddart GL, Torrance GW. Methods for the economic evaluation of health care programmes. 2nd ed. Oxford: Oxford Medical Publications; 1997. [Google Scholar]
- EuroQol Group EuroQol—A new facility for the measurement of health related quality of life. Health Policy. 1990;19:199–208. doi: 10.1016/0168-8510(90)90421-9. [DOI] [PubMed] [Google Scholar]
- Fenwick E, Claxton KC, Sculpher M. Representing uncertainty: The role of cost-effectiveness acceptability curves. Health Economics. 2001;10:779–89. doi: 10.1002/hec.635. [DOI] [PubMed] [Google Scholar]
- First M, Spitzer R, Gibbon M, Williams J. Structured clinical interview for Axis I DSM-IV disorders—Patient Edition (with psychotic screening) SCID-I/P (W/ psychotic screen, version 2) New York: Biometrics Research Department, New York State Psychiatric Institute; 1996. [Google Scholar]
- Knapp M, Beecham J. Costing mental health services: The client service receipt inventory. Psychological Medicine. 1990;20:893–908. doi: 10.1017/s003329170003659x. [DOI] [PubMed] [Google Scholar]
- Manca A, Hawkins N, Sculpher M. Estimating mean QALYs in trial-based cost-effectiveness analysis: The importance of controlling for baseline utility. Health Econ. 2005;14:487–96. doi: 10.1002/hec.944. [DOI] [PubMed] [Google Scholar]
- National Health Service in Scotland . Scottish Health Service Costs 2004. Edinburgh: Information and Statistics Division, National Health Service in Scotland; 2004. [Google Scholar]
- National Institute for Clinical Excellence . Guidance to the methods of technology appraisal. London: National Institute for Clinical Excellence; 2004. [Google Scholar]
- Netten A, Curtis L. Unit costs of health and social care. PSSRU: University of Kent; 2004. [Google Scholar]
- Palmer S, Torgerson D. Definitions of efficiency. British Medical Journal. 1999;318:1136. doi: 10.1136/bmj.318.7191.1136. [DOI] [PMC free article] [PubMed] [Google Scholar]
- Raftery J. NICE: Faster access to modern treatments? Analysis of guidance on health technologies. British Medical Journal. 2001;323:1300–1303. doi: 10.1136/bmj.323.7324.1300. [DOI] [PMC free article] [PubMed] [Google Scholar]
- Rendu A, Moran P, Patel A, Knapp M, Mann A. Economic impact of personality disorders in UK primary care attenders. British Journal of Psychiatry. 2002;181:62–66. doi: 10.1192/bjp.181.1.62. [DOI] [PubMed] [Google Scholar]
- Schafer JL. Multiple imputation: A primer. Statistical Methods in Medical Research. 1999;8:3–15. doi: 10.1177/096228029900800102. [DOI] [PubMed] [Google Scholar]
- Smith K, Shah A, Wright K, Lewis G. The prevalence and costs of psychiatric disorders and learning disabilities. British Journal of Psychiatry. 1995;166:9–18. doi: 10.1192/bjp.166.1.9. [DOI] [PubMed] [Google Scholar]
- STATACorp . STATA Statistical Software. College Station, TX: Stata Corporation; 1997. [Google Scholar]
- Statistical Solutions . SOLAS for missing data analysis. Cork, Ireland: Statistical Solutions; 1999. [Google Scholar]
- Tengs T, Wallace A. One thousand health-related quality-of-life estimates. Medical Care. 2000;38:583–637. doi: 10.1097/00005650-200006000-00004. [DOI] [PubMed] [Google Scholar]
- Van Agt HM, Essink Bot ML, Krabbe PF, Bonsel GJ. Test-retest reliability of health state valuations collected with the EuroQol questionnaire. Social Science and Medicine. 1994;39:1537–1544. doi: 10.1016/0277-9536(94)90005-1. [DOI] [PubMed] [Google Scholar]
- Van Hout B, Gordon G, Rutten F. Costs, effects and C/E ratios alongside a clinical trial. Health Economics. 1994;3:309–319. doi: 10.1002/hec.4730030505. [DOI] [PubMed] [Google Scholar]
- Zanarini M, Frankenburg F, Hebben J, Silk K. Mental health service utilization by borderline personality disorder patients and Axis II comparison subjects prospectively followed up for 6 years. Journal of Clinical Psychiatry. 2004;65:28–36. doi: 10.4088/jcp.v65n0105. [DOI] [PubMed] [Google Scholar]