

Abstract
It has been suggested that overscheduling of upper-class youth might underlie the high distress and substance use documented among them. This assumption was tested by considering suburban 8th graders’ involvement in different activities along with their perceptions of parental attitudes toward achievement. Results indicated negligible evidence for deleterious effects of high extracurricular involvement per se. Far more strongly implicated was perceived parent criticism for both girls and boys as well as the absence of after-school supervision. Low parent expectations connoted significant vulnerability especially for boys. The findings indicate that at least among early adolescents, converging scientific and media reports may have scapegoated extracurricular involvements, to some degree, as an index of ubiquitous achievement pressures in affluent communities.
Keywords: affluence, extracurricular activities, achievement pressure, parent criticism, parent expectations
For some children, it’s an after-school pressure-cooker. . .Doctors say that some children feel so much pressure for high performance that they develop stress-related symptoms like insomnia, stomachaches, headaches, anxiety, and depression. “I think this is a significant problem, particularly in upper-middle class families that are intent on having their children involved with a lot of activities and doing them well,” said Dr. Henry J. Gault, a child and adolescent psychiatrist in Northbrook, Ill., a Chicago suburb. (Gilbert, 1999)
Youngsters growing up in upwardly mobile, wealthy communities are widely believed to suffer under the pressures of excessive involvement in extracurricular activities. National journalistic sources commonly refer to the overscheduling of children in upper socioeconomic status (SES) communities to the detriment of their psychological well-being (see Luthar & Sexton, 2004, for a review). There are similar speculations in the research literature. Clinicians have described the “intensely competitive society of the rich” (Pittman, 1985, p. 464), where successes are expected and failures are both highly visible and apparently inexplicable. In his book, The Overscheduled Child, child psychiatrist Rosenfeld noted upper SES parents’ tendencies to “cull through our Filofax schedules figuring out how to squeeze in every opportunity. If we can manage to reduce the amount of ‘wasted’ time dramatically. . .it makes perfect sense that we ought to use those salvaged minutes to stuff in just a little more that is constructive: another lesson, a family activity, tutoring, even ‘quality time’” (Rosenfeld & Wise, 2000, p. 113).
Echoing these suggestions are developmental science findings that compared with age mates of more modest means, adolescents from high-income, suburban communities can show higher symptom levels in several areas, notably substance use, anxiety, and depression (Luthar & Becker, 2002; Luthar & D’Avanzo, 1999), and these elevated symptoms, in turn, can be linked with an overemphasis on resume building toward optimal higher education (Luthar & Latendresse, 2005a; Luthar & Sexton, 2004). Luthar and Becker (2002, p. 1594) speculated that “in upwardly mobile suburban communities, there is often a ubiquitous emphasis on ensuring that children secure admission to stellar colleges. As a result, many youngsters feel highly driven to excel not only at academics but also at multiple extracurricular activities, with these pressures beginning as early as the middle school years.” The implicit suggestion is that there exists a subgroup of overscheduled youth in suburban communities and that it is these youngsters who are largely responsible for the high disturbance now documented in multiple cohorts (Luthar & Latendresse, 2005b).
In terms of underlying mechanisms, excessive involvement in extracurricular activities could plausibly heighten distress both directly (because of subjectively experienced feelings of pressure) and indirectly by compromising families’ leisure time (as reflected, e.g., by thwarting dining together as a family; see Luthar & Becker, 2002; Luthar & Latendresse, 2005b). These possibilities are exemplified in suggestions that suburban children’s needs for emotional closeness may often suffer as the demands of professional parents’ careers erode relaxed family time, and youngsters are shuttled between various after-school activities (Luthar & D’Avanzo, 1999; see also Rosenfeld & Wise, 2000; Shafran, 1992).
There is, however, another set of factors that may be more directly linked with affluent teens’ distress than extracurricular involvement, and that is adults’ inordinate emphasis on achievements. Whereas the ramifications of extracurricular involvement have not been directly tested thus far, there is some empirical evidence on perceived pressures from adults. In two different samples of high-SES suburban middle-school sixth graders, findings showed that when parents’ values tended to emphasize children’s achievements far more than their personal integrity, there were associations with multiple maladjustment indexes (Luthar & Becker, 2002; Luthar & Latendresse, 2005b). Still stronger links were found for perceived parent criticism; in both samples, this was potent in predicting various forms of maladjustment. Particularly vulnerable, therefore, was a subset of youth who felt that their parents denigrated or punished them for perceived failures.
In this study, our major goal was to disentangle these interrelated posited vulnerability processes. The central question addressed was this: When multiple aspects of families’ investment in accomplishments are considered simultaneously, is it suburban adolescents’ high participation in extracurricular activities, or aspects of perceived pressures from parents, that have greater ramifications for students’ adjustment problems? Our suggestion is that it is the latter. In other words, we expect (a) stronger associations for the proximal family processes that directly touch the child rather than the sheer number of hours spent in extracurriculars; (b) that when family dynamics are considered, any previously observed effects for extracurricular involvement will be eliminated; and (c) that high involvement in extracurriculars becomes inimical only when it co-occurs with overly exacting, critical parenting.
Operationalization of Constructs and Parameters of the Study
Involvement in extracurricular activities was assessed by means of students’ self-reports and was operationally defined as activities occurring outside of school hours, at a regular time every week, and in the presence of an adult coach, teacher, or mentor (see Eccles, Barber, Stone, & Hunt, 2003; Gilman, Meyers, & Perez, 2004). Among middle-school students, these activities commonly occur within the following domains: sports, performing or fine arts, academics, and civic activities such as volunteering (Eccles et al., 2003; Gilman et al., 2004).
The dimensions of family life we considered were several potentially overlapping indexes, all related to achievement issues and previously linked with adjustment of affluent youth. Four of these directly pertained to perceptions of parents’ emphasis on achievement (Luthar & Becker, 2002; Luthar & Latendresse, 2005b): parental criticism, generally high achievement expectations, and values that disproportionately emphasized getting ahead (as opposed to personal integrity) for both mothers and fathers. In addition, we included lack of adult supervision after school; it is plausible that for some children, the effects of extracurriculars largely overlap with those of having a supervising adult during the evening (Osgood, Anderson, & Shaffer, 2005). Finally, we included the frequency with which children ate dinner with parents, which, as previously noted speculations indicate, is compromised by overscheduling and has, in fact, shown links with maladjustment (Luthar & Latendresse, 2005b).
Measurement of adjustment outcomes entailed strategies similar to those used in our prior programmatic work, involving multiple methods and multiple respondents (Luthar & Latendresse, 2005a, 2005b; Luthar & Sexton, 2004). Self-reports were used to measure depression, anxiety, and substance use, three forms of psychopathology that have been found in elevated levels among high-SES youth (Luthar & Becker, 2002; Luthar & D’Avanzo, 1999). In addition, to ascertain implications for everyday competent behaviors (as opposed to self-reported subjective disturbance), we obtained teachers’ ratings of behaviors in the classroom as well as school grades from school records.
The impact of possible overscheduling was considered with adolescents at the end of the eighth grade—approaching 14 years of age—based on developmental considerations. Previous research has shown that before adolescence, affluent youngsters do not show elevated psychopathology in comparison with national norms. It is with the onset of the teen years (the seventh grade) that problems such as substance use, depression, and anxiety begin to escalate (Luthar & Becker, 2002; Luthar & D’Avanzo, 1999; Luthar & Latendresse, 2005a). Thus, by the age of 14 years, we anticipated adequate variation not only in degree of involvement in extracurriculars but also in self-reported adjustment problems.
In terms of data analyses, central questions were addressed using both variable- and person-based strategies, as is increasingly common in research on risk and resilience (see Luthar, 2003b; von Eye & Bergman, 2003). In the former, we assessed two models: one in which the activities were considered on their own, and the other in which they were allowed to compete with the six family variables in simultaneous regressions. This strategy allowed us to ascertain effects that were unique to specific dimensions, having partialed out the overlap shared with all other conceptually overlapping predictors (Stattin & Magnusson, 1996).
Person-based analyses, invaluable in helping identify groups that exist in reality (Magnusson, 2000; Stattin & Magnusson, 1996), were used to explore the ramifications of differing profiles depending on (a) activity involvement and (b) parenting dimensions. Theoretically, it is plausible that there does, in fact, exist a subgroup of overscheduled youth who, independent of family pressures, are especially troubled. At the same time, it is possible that high activity involvement becomes deleterious only when it occurs in overly demanding and critical family milieus. Accordingly, we derived clusters separately for activity involvement and for family dimensions, seeking to examine interactions between cluster types on both these dimensions in predicting to adolescents’ adjustment outcomes.
In sum, the major goal in this study was to explore the basis of widespread beliefs that children in upper-class communities are overscheduled and thus troubled. Our expectation was that, more than hours in activities, it would be proximal family processes around achievement that relate to maladjustment in psychological, behavioral, and academic domains. Both variable-based (regression) and person-based (cluster) analyses were used to examine these issues, and all analyses were conducted separately for girls and boys, because the ramifications of socializing influences can differ by gender (e.g., Luthar & Becker, 2002; Luthar & Latendresse, 2005b).
Method
Sample
This study is based on the New England Study of Suburban Youth (NESSY), involving a cohort of high-income suburban students first studied when they were in the sixth grade (Luthar & Latendresse, 2005b) and monitored annually ever since.1 Questions addressed in this study were based on data obtained when the cohort was in the eighth grade. When the study was initiated, participants were 314 students (150 girls and 164 boys) from the two middle schools in one affluent town. Ninety-three percent were Caucasian, less than 2% each were African American and Hispanic, 3% were Asian, and the remainder were of other ethnic backgrounds. Based on census data, the median annual family income in this township was $125,381, and 32.8% of adults had a graduate degree (Luthar & Sexton, 2004); only 3% of the students in the school sample received free or reduced lunches.
Students’ inclusion in the sample was based on passive consent procedures, because data collection was done as part of school-based initiatives on positive youth development. Before each wave of data collection, administrators sent letters to parents of all students by means of U.S. mail, describing the project, indicating that survey results would be presented only in aggregate form, and requesting notification from parents who did not want their children to participate. A second notice was mailed a few days before data collection, again offering the option to refuse consent. On days of data collection, students were informed that their participation was voluntary and, on completion of data collection, questionnaires were stored with subject numbers as identifiers.
In this wave of data collection, when students were in the eighth grade, a total of 314 students participated from an eligible pool of 337, representing a participation rate of 93.2%. (The 314 participants represented 88.3% of those who had completed the original sixth-grade assessments.) Of the 23 eighth graders who did not participate, 15 parents disallowed participation, 3 did not wish to participate, and 5 were absent on both days of data collection.
Procedure
During the 2000–2001 academic year, data for each student were collected during two 45-min English class periods on 2 separate days. To guard against biases resulting from variability in reading proficiencies, a member of the research team read each questionnaire aloud, and students marked their responses accordingly. Questionnaires were administered in the same order in all classrooms, with relatively structured, nonthreatening measures administered at the beginning and end of each session. On completion of data collection, funds to support a pizza party were given to all participating classes; teachers were given $1 for each student rated.
Measures
Extracurricular Involvement
Given the lack of existing research on children in upper-class communities, before collecting data for this study, we implemented a pilot project toward ensuring adequate measurement of extracurricular involvement (e.g., in terms of the diversity of common activities). In the preceding year (1999–2000 when the cohort was in the seventh grade), we administered an open-ended measure to explore activity involvement of students in this community. Following previous research on this construct, students were asked to identify the extracurricular activities they were currently involved in: activities that took place outside of school hours and included the presence of an adult coach or instructor (see Casey, Ripke, & Huston, 2005; Eccles et al., 2003; Gilman et al., 2004; Mahoney, Larson, Eccles, & Lord, 2005). A grid provided three columns, one labeled activity; the second, day of the week; and the third, time of day. On the first three lines of the grid, we listed the following examples across the columns: (a) baseball practice/Monday/3:30–4:30; (b) baseball practice/Wednesday/5: 30–7:30; (c) baseball game/Saturday/1–3:00. Students’ responses in these grids were found to fall in four broad categories: sports, arts, academic, and civic.2
Based on open-ended responses in these pilot data, we modified our questionnaire and used a forced-choice format to maximize efficiency for our Grade 8 data collection. To introduce the topic, children were asked questions about the number of activities they engaged in within each of the following categories: sports, art or theater (e.g., dance, art), academic activities (e.g., math club, tutoring), and civic activities (e.g., church, volunteering). These were followed by questions on the substantive issue of interest, the total level of participation: “How many hours did you spend in sports activities last week”; nine choices were provided, ranging from 0 through 8 or more. This question was repeated for art–theater, academic, and civic activities.
Evidence for the reliability of students’ responses is evident in the correlations between the Grade 8 hours spent in activities and the exploratory pilot data gathered the preceding year. Over a period of almost 12 months, correlations for hours spent in sports, arts, academics, and civic activities respectively were .55, .41, .34 (all ps < .001), and .16 ( p < .01). At Grades 7 and 8, respectively, mean hours spent were as follows for four activities : sports, 3.72 (4.22 SD) and 4.38 (2.94 SD); arts, 0.93 (2.38 SD) and 1.56 (2.27 SD); academic, 0.15 (0.57 SD) and 0.75 (1.42 SD); civic, 1.01 (2.00 SD) and 1.11 (1.59 SD).
Also ascertained in the eighth-grade questionnaire were reasons for participation. For each activity endorsed, students were asked to check off one or more of three columns representing reasons for participation: “Because it is fun,” “Because it is good for my future,” and “Because adults want me to.” To ascertain the salience of the different reasons, we computed “fun hours,” “expediency hours,” and “pressure hours” by multiplying the total number of hours in the activity by 1 or 0 depending on whether the reason was endorsed. Thus, if a child noted 4 hours per week in sports and indicated only fun as the reason for participation, he or she would have a score of 4 for sports fun hours; if the child also checked off “good for my future” as a reason, he or she would get a score of 4 for sports expediency hours as well.
Family Dimensions
Parental criticism
This dimension was assessed using a four-item subscale of the Multidimensional Perfectionism Scale (MPS; Frost, Marten, Lahart, & Rosenblate, 1990). Illustrative items are “My parents never try to understand my mistakes” and “I am punished for doing things less than perfectly,” and all items are rated on a 5-point Likert scale. Reliability coefficients were .85 and .82 among girls and boys, respectively, in this sample.
Parent expectations
This variable was assessed using the five-item Parental Expectations subscale of the MPS (Frost, et al., 1990). Illustrative items are “My parents expect excellence from me” and “My parents set very high standards for me.” Alpha coefficients in this sample were .82 and .84 among girls and boys, respectively.
Parents’ emphasis on personal character versus achievements
On the six-item Parental Values scale (Luthar & Latendresse, 2005b), students were asked to rank order the top three of the following six items based on what they believed their own (a) mother and (b) father valued the most: “that you (a) are respectful to others, (b) attend a good college, (c) try to help others in need, (d) excel academically, (e) are kind to others, and (f) have a successful career in the future.” As can be seen, half of these values are achievement oriented and half are oriented toward personal character and well-being. Scale scores were proportions derived by summing the weights of the achievement responses and dividing by the total possible weighted score (6). Adequate psychometric properties of this measure have been reported (DeCarlo & Luthar, 2000).
Dinner with parents
Students were asked about the adults with whom they typically ate dinner, and responses were coded dichotomously: with either or both parents (or parent figures, e.g., a stepparent) versus with no parent, as in prior research (Luthar & Latendresse, 2005b).
After-school supervision
Students indicated the type of supervision typically received after school based on three choices: (a) supervised by adult family member, (b) supervised by other adult (nonrelative), (c) not supervised by an adult. Following Luthar and Becker (2002), responses were categorized dichotomously—presence–absence of an adult—for use in analyses.
Child Adjustment
Internalizing symptoms
Internalizing symptoms were assessed by a composite of depressive and anxiety symptoms, with the former assessed by the Children’s Depression Inventory (CDI; Kovacs, 1992) and the latter by the Revised Children’s Manifest Anxiety Scale (R-CMAS; Reynolds & Richmond, 1985). The CDI is a 27-item, three-choice scale with good psychometric properties (Kovacs, 1992); alpha coefficients were .91 and .89 for girls and boys, respectively, in this sample. The R-CMAS is a dichotomous-choice, 37-item measure that provides subscale scores on social anxiety, physiological anxiety, and worry, a Total Anxiety score, as well as a Lie score capturing socially desirable responding. Acceptable reliability and validity have been reported (Luthar & D’Avanzo, 1999; Reynolds & Richmond, 1985). For the two scales used in this study, alpha coefficients among girls and boys, respectively, were .89 and .88 for Total Anxiety and .79 and .81 for Lie. As in past research, the depression and anxiety measures were highly correlated (rs = .71 and .72 for girls and boys, respectively), and a composite variable, internalizing distress, was derived by summing standardized scores.
Delinquency
This was assessed by the Self-Report Delinquency Checklist (SRD; Elliot, Dunford, & Huizinga, 1987), a questionnaire that includes 37 items rated on a 4-point scale, asking about the frequency of delinquent acts at home, at school, and in the community. The SRD is a reliable and valid instrument (Huizinga & Elliot, 1986), and in this study, alpha coefficients were .90 and .91 for girls and boys, respectively.
Substance use
This was measured by the Frequency of Drug Use grid used in the Monitoring the Future Study Survey (Johnston, O’Malley, & Bachman, 1984), an instrument that queries about frequency of use of several substances over the preceding year—nicotine, alcohol, marijuana, inhalants, crack, cocaine, and LSD—with ratings obtained on a 7-point scale anchored by never and 40+ times. The reliability and validity of this type of self-report have been amply documented.3 Following the approach in previous studies (Luthar & Becker, 2002; Luthar & D’Avanzo, 1999), a composite substance use variable was created by adding scores for cigarettes, alcohol, and marijuana. Alpha coefficients were .68 and .65, respectively, for girls and boys.
School grades
Data on this variable were obtained from student records. A cumulative grade point average was computed based on students’ grades across the previous two full quarters of the school year. This cumulative score was based on averaged grades in social studies, science, math, and English; letter grades were coded such that an A+ was assigned a score of 13 and an F a score of 1. For girls and boys, alpha coefficients were .95.
Teacher-rated classroom behaviors
The Teacher-Child Rating Scale (T-CRS; Hightower et al., 1986) was given to English teachers of all students. A 36-item scale, the T-CRS assesses behaviors within two domains with three scores in each: Problems (Acting Out, Learning Problems, and Shy–Anxious) and Adjustment (Frustration Tolerance, Task Orientation, Assertive Social Skills). Of these six subscales, four clearly represent positive or negative adaptation, whereas two—Shy–Anxious and Assertive Social Skills—are equivocal (Luthar, 1995); these were, therefore, excluded in operationalizing teacher-rated classroom adjustment.
The four selected T-CRS subscale scores had high internal consistencies (αs = .80–.97; Mdn = .94 among both girls and boys). The four scores were standardized to correct for differences in teachers’ stringency, after which a principal-components factor analysis with varimax rotation was performed on the subscales. Results indicated a single factor accounting for 77% of the total variance among boys and 68% among girls, respectively. Thus, a composite score on teacher-rated classroom competence was derived by adding the two positive subscale scores and subtracting from this total the two negative scores.
Results
Preliminary Data on Activity Hours
To explore the validity of our data on hours involved in extracurricular activities, we examined the four variables in question in relation to students’ self-described membership in different crowds; as Eccles et al. have demonstrated, these constructs should be significantly associated (Eccles & Barber, 1999; Eccles et al., 2003). Prior research with this suburban population demonstrated the existence of seven major crowds in middle school (Galen & Luthar, 2006): jocks, populars, rebels, brains, theater–art, left-outs, and normal groups, and we compared these seven crowds in the eighth grade on the four activity hours variables. Results revealed a significant effect in multivariate analyses of variance (MANOVA), Wilks’s Λ = .74, F(24, 947) = 3.57, p < .001, and follow-up univariate analyses were significant at p < .05 in all cases but one: civic hours (Table 1). The pattern of means was conceptually coherent; the number of hours in sports was the highest in the self-described jocks, for example, and arts activities was the highest among the theater–arts-music crowd.
Table 1.
Validating Activity Hours: Comparisons of Means Across Self-Identified Crowds
| Jocks | Populars | Brains | Theater-art | Rebels | Left-outs | Normals | F | |
|---|---|---|---|---|---|---|---|---|
| Sports hours | 6.54a | 4.74a,b | 3.00b | 3.89b | 4.77a,b | 3.25b | 3.77b | 6.25*** |
| Arts hours | 0.97a | 1.48a | 2.05a | 5.00b | 0.46a | 1.13a | 1.75a | 5.04*** |
| Academic hours | 0.73a | 1.26a | 1.21a | 0.67a | 1.08a | 0.31a | 0.55a | 2.20* |
| Civic hours | 1.38 | 1.18 | 1.37 | 1.22 | 1.08 | 0.13 | 1.20 | 1.26 |
Note. Means with the same subscript do not differ significantly in post hoc tests. Gender and Crowd × Gender were both nonsignificant in the multivariate analysis of variance.
p < .05.
p < .001.
Figure 1 displays summary data on the total number of hours in different activities and on reasons for participation for all activities considered together and then for each one separately. As shown, the total time committed to all activities was 7.5 hr/week among girls and 7.9 hr/week among boys (ranges = 0–19 and 0–21 hr/week, respectively). In terms of overall reasons for participation, the mean number of fun hours was generally greater than the mean number of expediency hours, which in turn was greater than the number of pressure hours.
Figure 1.
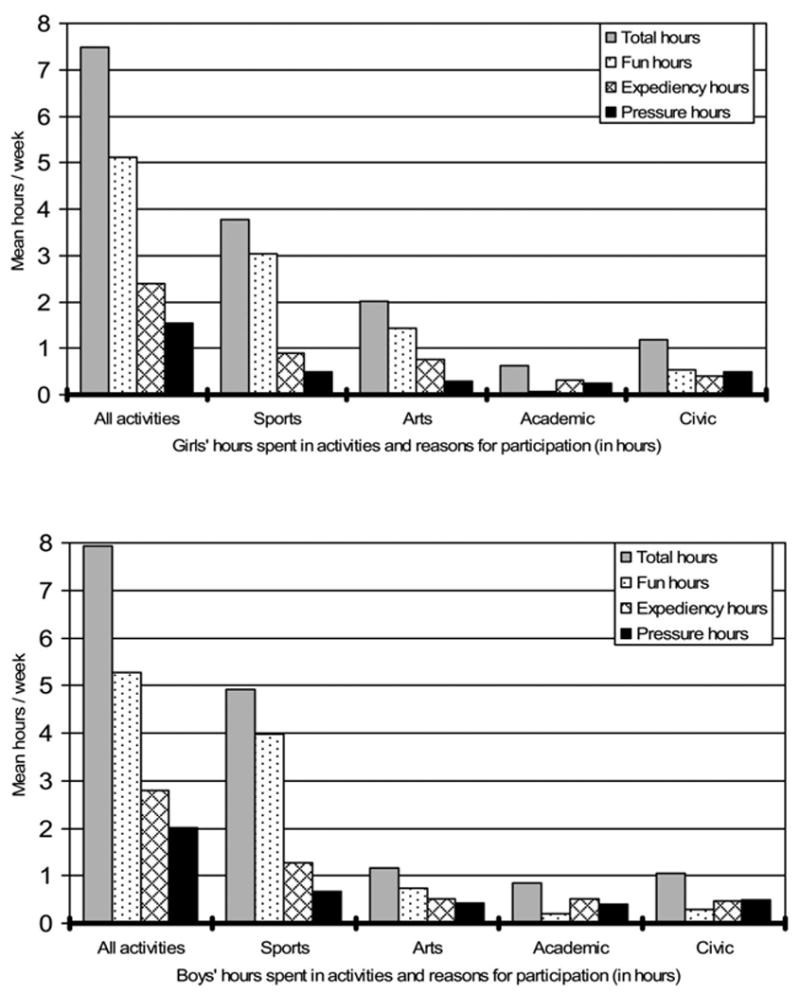
Hours spent in different activities: Total hours, and hours associated with particular reasons for participation.
Descriptive Statistics
Means and standard deviations for all variables in this study are presented by gender in Table 2. A one-way MANOVA revealed significant gender differences, Wilks’s Λ = .74, F(113, 262) = 8.57, p < .001. Follow-up univariate analyses of variance (ANOVAs) showed that, compared with boys, girls had lower scores on sports hours and delinquency; they had higher scores on arts hours, grades, and classroom competence as well as on internalizing symptoms. Simple correlations among all variables are depicted in Table 3.
Table 2.
Descriptive Data for All Variables Separated by Gender
| Girls
|
Boys
|
||||
|---|---|---|---|---|---|
| M | SD | M | SD | F | |
| Sports hours | 3.75 | 2.76 | 4.91 | 2.80 | 14.64*** |
| Arts hours | 1.98 | 2.37 | 1.16 | 1.93 | 12.37*** |
| Academic hours | 0.62 | 1.18 | 0.86 | 1.50 | 2.63 |
| Civic hours | 1.14 | 1.51 | 1.04 | 1.53 | 0.37 |
| Parent criticism | 8.20 | 3.89 | 8.67 | 3.80 | 1.25 |
| Parental expectations | 13.93 | 4.50 | 14.49 | 4.85 | 1.23 |
| Mom achievement emphasis | 2.11 | 1.56 | 2.40 | 1.86 | 2.37 |
| Dad achievement emphasis | 2.72 | 1.81 | 3.10 | 1.93 | 3.54 |
| Internalizing symptoms | 0.25 | 2.00 | −0.22 | 1.62 | 5.70* |
| Delinquency | 1.20 | 0.22 | 1.28 | 0.27 | 9.51** |
| Substance use (last year) | 1.51 | 2.52 | 1.31 | 2.20 | 0.60 |
| GPA | 9.59 | 2.08 | 8.27 | 2.44 | 28.23*** |
| Classroom competence | 0.31 | 0.66 | −0.29 | 1.13 | 34.68*** |
|
| |||||
| Categorical variables | % | % | χ2 | ||
|
| |||||
| After-school supervision (% adult present) | 66.9 | 59.7 | 0.26 | ||
| Dinner with parent (% yes) | 87.9 | 86.0 | 1.27 | ||
p < .05.
p < .01.
p < .001.
Table 3.
Simple Correlations by Gender
| Variable | 1 | 2 | 3 | 4 | 5 | 6 | 7 | 8 | 9 | 10 | 11 | 12 | 13 | 14 | 15 |
|---|---|---|---|---|---|---|---|---|---|---|---|---|---|---|---|
| 1. Sports hoursb | — | −.23** | .04 | .04 | .05 | .05 | .02 | .11 | −.12 | −.12 | −.10 | .07 | .06 | .03 | .01 |
| 2. Arts hoursb | −.05 | — | −.07* | .37*** | .17* | −.03 | .00 | −.01 | −.08 | −.11 | −.08 | −.04 | −.05 | .11 | −.00 |
| 3. Academic hoursb | .07 | .17* | — | −.12 | −.01 | −.05 | .04 | .04 | .10 | −.03 | .16* | .32*** | .24** | −.11 | −.12 |
| 4. Civic hoursb | −.10 | .16* | .13 | — | .04 | .13 | −.06 | .05 | −.12 | −.21** | −.23** | −.11 | .10 | .10 | −.00 |
| 5. After-school supervisionb | −.09 | .07 | −.02 | .00 | — | −.09 | −.12 | −.03 | −.00 | −.01 | −.18* | −.29*** | −.18* | .14 | −.06 |
| 6. Dinner with parentb | .13 | .09 | .11 | .02 | −.09 | — | −.04 | −.04 | −.07 | −.22** | −.21** | −.19* | −.06 | .07 | .08 |
| 7. Parent criticismb | −.02 | .13 | −.01 | .11 | −.11 | −.04 | — | .70*** | .36*** | .14 | .48*** | .29*** | .21** | −.26*** | −.24** |
| 8. Parental expectationsb | .05 | .32*** | .11 | .17* | .04 | .11 | .66*** | — | .39*** | .19* | .27*** | .18* | .20* | −.01 | −.05 |
| 9. Mom achievement emphasisb | −.02 | .08 | −.08 | −.02 | .17* | −.07 | .40*** | .37*** | — | .55*** | .30*** | .17* | .22** | −.30*** | −.23** |
| 10. Dad achievement emphasisb | −.06 | .03 | .00 | −.07 | .08 | −.03 | .33*** | .36*** | .66*** | — | .21** | .13 | .07 | −.17* | −.07 |
| 11. Internalizingb | −.09 | −.08 | .03 | .07 | −.19 | −.09 | .34*** | −.02 | .20** | .17* | — | .48*** | .29*** | −.29*** | −.24** |
| 12. Delinquencyb | .09 | −.10 | −.07 | .08 | −.38*** | −.08 | .04 | −.09 | −.01 | −.05 | .20** | — | .64*** | −.23** | −.23** |
| 13. Substance useb | .11 | −.11 | .11 | .07 | −.18* | −.01 | −.01 | −.24*** | −.02 | .02 | .14 | .44*** | — | −.18* | −.27*** |
| 14. Gradesa | .15* | .21** | −.11 | .07 | .06 | .11 | −.02 | .31*** | −.02 | −.06 | −.24*** | −.22** | −.37*** | — | .66*** |
| 15. Classroom competencea | .08 | .23** | −.04 | .05 | .04 | .09 | −.00 | .28*** | −.04 | −.01 | −.26*** | −.24** | −.36*** | .78*** | — |
Note. Correlations for girls are listed above the diagonal, and those for boys are listed below the diagonal.
Teacher rated.
Self-reported.
p < .05.
p < .01.
p < .001.
Clinically Significant Internalizing Symptoms
Parallel to the strategy used in other samples of upper-class suburban 10th graders (Luthar & D’Avanzo, 1999) and 6th and 7th graders (Luthar & Becker, 2002) and on this middle-school cohort when they were in the 6th grade (Luthar & Latendresse, 2005b), we computed the proportions of students who were above clinically significant symptom levels on the two measures with published normative data: the CDI and the R-CMAS. Whereas students in this sample had been well below norms in the 6th grade (Luthar & Latendresse, 2005b), in these 8th-grade assessments, the proportion of students with scores above clinical cutoffs had generally reached (and in a few cases exceeded) national normative rates, suggesting reasonable variability on these dimensions (Table 4).
Table 4.
Incidence of Clinically Significant Depressive and Anxiety Symptoms (Compared With National Norms)
| Variable | Norms: 13-year-old girls | 8th-grade affluent girls | Norms: 13-year-old boys | 8th-grade affluent boys |
|---|---|---|---|---|
| Depression | ||||
| Above average (t score > 60) | 17.0% | 15.4% | 12.0% | 5.5% |
| Much above average (t score > 65) | 7.0% | 8.7% | 7.0% | 2.4% |
| Very much above average (t score > 70) | 3.0% | 6.7% | 2.0% | 1.8% |
| Total Anxiety | ||||
| Above average (t score > 60) | 18.0% | 17.4% | 16.0% | 7.8% |
| Much above average (t score > 65) | 8.0% | 5.4% | 6.0% | 0.6% |
Note. Normative data on depressive symptoms are based on values on the Children’s Depression Inventory (CDI; Kovacs, 1992), and those for total anxiety symptoms correspond to values for Revised Children’s Manifest Anxiety Scale (R-CMAS; Reynolds & Richmond, 1985).
Multiple Regression Analyses: Dimensions of Achievement
For both girls and boys, hierarchical multiple regression analyses were conducted predicting to each of the five outcomes: internalizing symptoms, delinquency, substance use, academic grades, and classroom competence. Ethnicity was not entered as a control variable because standard collinearity diagnostics (Belsley, 1991) revealed a lack of variance in ethnicity in this sample (Luthar & Latendresse, 2005b). Similarly, because age showed little variation in this cohort, we did not include it in the regression models (although we did confirm, in a separate set of analyses, that controlling for age did not alter the results reported here).
For both gender groups, we ran two regression models, the first one containing only the four activities variables in a single block. Results are presented in the first set of columns for each outcome domain, in Table 5. As shown, this block accounted for a significant increase variance for all self-reported outcomes among girls but not for the academic indexes. By contrast, for boys, the block was significant for grades and classroom competence, not the self-reported problems.
Table 5.
Simultaneous Regressions Predicting to Adjustment Outcomes
| Internalizing
|
Delinquency
|
Substance use (year)
|
Grades
|
Classroom competence
|
||||||||||||||||
|---|---|---|---|---|---|---|---|---|---|---|---|---|---|---|---|---|---|---|---|---|
| Var. | β | R2 | β | R2 | β | R2 | β | R2 | β | R2 | β | R2 | β | R2 | β | R2 | β | R2 | β | R2 |
| Girls’ outcomes | ||||||||||||||||||||
|
| ||||||||||||||||||||
| Sports hours | −.10 | .01 | −.06 | .01 | .07 | .01 | .12 | .02 | .03 | .00 | .06 | .00 | .05 | .00 | −.03 | .00 | .01 | .00 | −.04 | .00 |
| Arts hours | −.02 | .00 | −.01 | .00 | .04 | .00 | .08 | .01 | −.08 | .01 | −.04 | .00 | .10 | .01 | .07 | .01 | .00 | .00 | −.00 | .00 |
| Academic hours | .14† | .02 | .11† | .02 | .31*** | .10 | .29*** | .10 | .25** | .06 | .22** | .05 | −.10 | .01 | −.07 | .01 | −.12 | .02 | −.09 | .01 |
| Civic hours | −.20* | .04 | −.13† | .02 | −.09 | .01 | −.04 | .00 | .16† | .02 | .16 | .03 | .05 | .00 | −.03 | .00 | −.02 | .00 | −.07 | .00 |
| After-school supervision | −.12† | .02 | −.29*** | .10 | −.17* | .03 | .10 | .01 | .03 | .00 | ||||||||||
| Dinner with parents | −.16* | .03 | −.17* | .04 | −.08 | .01 | .06 | .00 | .08 | .01 | ||||||||||
| Parent criticism | .50*** | .16 | .24* | .04 | .11 | .01 | −.42*** | .10 | −.34** | .06 | ||||||||||
| Parent expectations | −.13 | .01 | −.05 | .00 | .03 | .00 | .41*** | .09 | .29** | .04 | ||||||||||
| Mom achievement emphasis | .10 | .01 | .04 | .00 | .18† | .02 | −.29** | .06 | −.25* | .04 | ||||||||||
| Dad achievement emphasis | .04 | .00 | .06 | .00 | −.03 | .00 | −.02 | .00 | .05 | .00 | ||||||||||
| Total R2 | .08* | .36*** | .11*** | .29*** | .08* | .18*** | .03 | .22*** | .02 | .14* | ||||||||||
|
| ||||||||||||||||||||
| Boys’ outcomes | ||||||||||||||||||||
|
| ||||||||||||||||||||
| Sports hours | −.10 | .01 | −.07 | .01 | .10 | .01 | .08 | .01 | .11 | .01 | .14† | .02 | .18* | .04 | .13† | .02 | .10 | .01 | .07 | .00 |
| Arts hours | −.11 | .01 | −.04 | .00 | −.10 | .01 | −.05 | .00 | −.13† | .02 | −.02 | .00 | .24** | .06 | .12 | .02 | .24** | .06 | .15† | .02 |
| Academic hours | .04 | .00 | .09 | .01 | −.07 | .01 | −.06 | .00 | .11 | .01 | .14† | .02 | −.18* | .03 | −.22** | .06 | −.09 | .01 | −.13† | .02 |
| Civic hours | .07 | .00 | .08 | .01 | .11 | .01 | .12 | .02 | .09 | .01 | .13† | .02 | .07 | .01 | .02 | .00 | .03 | .00 | −.01 | .00 |
| After-school supervision | −.15* | .03 | −.39*** | .15 | −.13† | .02 | .02 | .00 | .01 | .00 | ||||||||||
| Dinner with parents | −.03 | .00 | −.09 | .01 | .01 | .00 | .03 | .00 | .01 | .00 | ||||||||||
| Parent criticism | .52*** | .16 | .04 | .00 | .24* | .03 | −.36*** | .08 | −.28** | .04 | ||||||||||
| Parent expectations | −.44*** | .11 | −.12 | .01 | −.48*** | .11 | .58*** | .17 | .47*** | .11 | ||||||||||
| Mom achievement emphasis | .15 | .01 | .12 | .01 | .02 | .00 | −.05 | .00 | −.13 | .01 | ||||||||||
| Dad achievement emphasis | .07 | .00 | −.06 | .00 | .12 | .01 | −.11 | .01 | −.00 | .00 | ||||||||||
| Total R2 | .02 | .27*** | .03 | .20*** | .04 | .18*** | .10*** | .27*** | .07* | .18*** | ||||||||||
Note. For each outcome domain, the first column represents beta values when the model included only hours in different activities. The second column represents values when the family variables were included as well. R2 values for individual predictors are squares of partial coefficients.
p < .10.
p < .05.
p < .01.
p < .001.
In the second set of analyses, we entered the six family variables along with the four activity variables to ascertain the unique contributions of each one in predicting to outcomes. These simultaneous regressions had statistically significant associations with all outcomes among both girls and boys; variance explained ranged from 14% to 36% among girls and 18% to 27% among boys.
Examination of individual terms within these blocks showed that of the extracurricular activities, academic hours had the strongest associations among girls, being linked with high problems in all self-reported domains. In addition, civic hours showed modest benefits in relation to internalizing symptoms. Among boys, arts hours had shown strong positive links with both grades and classroom competence when activities had been considered on their own; however, these effects became nonsignificant and marginal, respectively, when family variables were also in the equation.
Overall, these analyses showed that effects for family dimensions collectively were more strongly related to outcomes than were those for activities. In both gender groups, vulnerability effects were seen for parental criticism in relation to almost all outcomes and for lack of after-school supervision in relation to self-reported maladjustment domains. Among boys particularly, parent expectations showed strong beneficial effects for all outcome domains but delinquency. Two variables showing significant effects among girls but not boys were dinner with parents, which was related to low internalizing symptoms and delinquency, and mothers’ emphasis on achievements, which was inversely linked with grades and classroom competence and positively linked, at borderline significance, with high substance use.
Gender-Based Differences in Links
In the preceding analyses, four variables stood out as having potentially different effects among girls and boys: academic hours, parent expectations, dinner with parents, and mothers’ achievement emphasis. To determine whether the magnitude of associations was significantly different across genders, we conducted post hoc analyses using the whole sample and, following the main effects, entered interaction terms involving gender and the four variables in centered form. The block of interaction terms was statistically significant in predicting to all five outcomes at p < .05. Within blocks, the term with mothers’ emphasis on achievements did not reach statistical significance. The effect for academic hours was significant in predicting delinquency (unstandardized B = −.03, p < .002), as was Gender × Dinner With Parents in relation to internalizing symptoms (B = .24, p < .07). Gender × Parental Expectations was significant in relation to four of the five outcomes: internalizing symptoms (B = −.22, p < .02), substance use (B = −.47, p < .001), grades (B = .28, p < .03), and classroom competence (B = .15, p < .005).4
Supplementary Analyses: Examining Sources of Bias and Curvilinear Trends
Our simultaneous regressions were stringent in excising artifactual inflation of links as a result of shared method variance, critical because all predictors and three outcomes were based in self-report (Cohen et al., 2003). To further rule out biases resulting from possibly socially desirable responding (see Gilman et al., 2004), we reran the regressions with controls for the R-CMAS Lie subscale. Results were similar to those displayed in Table 5. We also explored whether hours in activities had curvilinear links with outcomes, as has been suggested by some (e.g., Cooper, Valentine, Nye, & Lindsay, 1999). Given the absence of specific hypotheses involving discrete domains and to conserve power, this question was considered in terms of the total number of activity hours, entered as a main effect and then as a quadratic (centered) term. Of the 10 analyses conducted, the quadratic term was significant in only two cases: substance use among girls ( p < .01) and grades among boys ( p < .02). Girls with very high activity involvement stood out from those with medium and low levels in showing inordinately high substance use, and boys with very low activity hours had much lower grades than boys with medium and high levels. Because these findings did not reach significance criteria with Bonferroni corrections ( p < .005, or .05/10 comparisons), interpretations for these curvilinear trends are not offered.
Cluster Analyses
For girls and boys each, we sought to determine naturally occurring clusters of (a) hours in activities and (b) family dimensions. All variables were standardized before deriving clusters. K-means cluster analyses were performed in each gender group, with requests for two and three clusters for activities and for family variables, and in all cases, two-cluster solutions best fit the data (requesting more than two clusters resulted in some groups of very small size, with only 3 or 4 students). To ascertain the robustness of the two-cluster solutions, we reran the cluster analyses in two random halves of the sample of both girls and boys, and findings paralleled those reported for the overall sample in Table 6. As shown, in terms of activity participation, we found a large normative cluster among both girls and boys. Among girls, this group reflected near-average participation in all activities but academics, and among boys, near-average participation in sports but low participation in the other three activities. Conversely, the small unique clusters consisted of girls with academic hours at 1.74 SD above the sample mean, and boys with 1.24 SD or more above the mean on arts, civics, as well as academics.
Table 6.
Clusters Based on Activity Dimensions and Family Dimensions: Defining Characteristics
| Activity dimensions
|
||||||||||||
|---|---|---|---|---|---|---|---|---|---|---|---|---|
| Girls
|
Boys
|
|||||||||||
| Cluster 1: Normativea |
Cluster 2: Academicsb |
Cluster 1: Normativec |
Cluster 2: Diverse activitiesd |
|||||||||
| Variable | Mean | SD | Mean | SD | F | η2 | Mean | SD | Mean | SD | F | η2 |
| Sports hours | −0.05 | 1.01 | 0.26 | 0.90 | 1.88 | .01 | 0.08 | 0.97 | −0.40 | 1.09 | 5.70† | .03 |
| Arts hours | 0.06 | 1.04 | −0.33 | 0.64 | 3.04 | .02 | −0.25 | 0.55 | 1.30 | 1.63 | 86.58*** | .33 |
| Academic hours | −0.31 | 0.36 | 1.74 | 1.54 | 186.74*** | .54 | −0.24 | 0.54 | 1.24 | 1.69 | 76.17*** | .30 |
| Civic hours | 0.09 | 1.05 | −0.50 | 0.47 | 6.74** | .04 | 0.24 | 0.62 | 1.25 | 1.52 | 78.17*** | .31 |
| Family dimensions
|
||||||||||||
| Cluster 1: Normativee
|
Cluster 2: Criticalf
|
Cluster 1: Normativeg
|
Cluster 2: Criticalh
|
|||||||||
| Mean | SD | Mean | SD | F | η2 | Mean | SD | Mean | SD | F | η2 | |
|
| ||||||||||||
| After-school supervision | −0.05 | 1.01 | 0.09 | 0.98 | 0.69 | .00 | 0.02 | 0.97 | −0.02 | 1.04 | .07 | .00 |
| Dinner with parents | 0.14 | 0.78 | −0.29 | 1.30 | 6.58** | .04 | −0.11 | 1.09 | 0.16 | 0.83 | 3.30 | .02 |
| Parent criticism | −0.38 | 0.73 | 0.79 | 1.03 | 68.72*** | .30 | −0.53 | 0.52 | 0.76 | 1.04 | 120.31*** | .41 |
| Parental expectations | −0.45 | 0.73 | 0.93 | 0.83 | 114.20*** | .42 | −0.52 | 0.71 | 0.75 | 0.87 | 115.00*** | .40 |
| Mom achievement emphasis | −0.41 | 0.75 | 0.84 | 0.93 | 83.00*** | .35 | −0.49 | 0.75 | 0.70 | 0.90 | 91.06*** | .34 |
| Dad achievement emphasis | −0.33 | 0.84 | 0.68 | 0.97 | 45.78*** | .23 | −0.49 | 0.80 | 0.71 | 0.82 | 94.87*** | .35 |
Note. Values in the table represent standard scores. η2 = partial eta squared;
N = 135.
N = 24.
N = 149.
N = 29.
N = 107.
N = 52.
N = 105.
N = 73.
p < .10.
p < .05.
p < .01.
p < .001.
The two-cluster solutions of family dimensions showed similar profiles for girls and boys. In both cases, a relatively large cluster was found with parent criticism and expectations below the sample mean (and in the case of girls, a greater frequency of eating dinner together). The second cluster in both cases consisted of students whose parent criticism and expectations scores were at least .70 SD above the sample mean.
To examine the possibility that the ramifications of activity participation depended on the profile of family functioning, we conducted 2 × 2 (Activity × Family Cluster) MANOVAs for both boys and girls. In both gender groups, main effects for activity were nonsignificant, and in both cases, the main effect for family was significant: for girls, Wilks’s Λ = .85, F(5, 151) = 5.30, p < .0001; for boys, Wilks’s Λ = .93, F(5, 170) = 2.56, p < .05. The interaction term achieved borderline significance among girls, Wilks’s λ = .94, F(5, 151) = 2.03, p < .07, but was nonsignificant among boys.
Results of follow-up ANOVAs are presented in Table 7. As shown, main effects for family were found on all outcomes among girls and on grades and classroom competence among boys. Additionally, for girls, interaction effects were significant for internalizing, grades, and classroom competence. In all cases, the group reflecting high academic activities along with high family criticism stood out from the others as being the most poorly adjusted (Figure 2).
Table 7.
Cluster Differences on Adjustment Indices
| Activity cluster
|
Family cluster
|
Activitye |
Family
|
A × F
|
||||||
|---|---|---|---|---|---|---|---|---|---|---|
| Variable | 1: Normativea | 2: Academicb | 1: Normativec | 2: Criticald | F | η2 | F | η2 | F | η2 |
| Girls | ||||||||||
| Internalizing | 0.17 ± 1.93 | 0.67 ± 2.30 | −0.17 ± 1.80 | 1.10 ± 2.12 | 4.78** | .03 | 20.72**** | .12 | 5.88** | .04 |
| Delinquency | 1.18 ± 0.20 | 1.27 ± 0.32 | 1.16 ± 0.20 | 1.27 ± 0.25 | 5.48** | .03 | 10.41*** | .06 | 2.36 | .02 |
| Substance use | 1.38 ± 2.39 | 2.25 ± 3.11 | 1.23 ± 2.12 | 2.11 ± 3.13 | 4.53** | .03 | 6.75*** | .04 | 2.32 | .02 |
| Grades | 9.62 ± 1.99 | 9.41 ± 2.58 | 9.80 ± 2.02 | 9.11 ± 2.13 | 1.74 | .01 | 8.67*** | .05 | 4.33** | .03 |
| Class comp | 0.33 ± 0.65 | 0.21 ± 0.69 | 0.35 ± 0.70 | 0.22 ± 0.56 | 3.14 | .02 | 6.73*** | .04 | 5.71** | .03 |
|
| ||||||||||
| 1: Normativef | 2: Diverseg | 1: Normativeh | 2: Criticali | |||||||
|
| ||||||||||
| Boys | ||||||||||
| Internalizing | −0.24 1.63 | −0.13 1.56 | −0.54 1.38 | 0.23 1.82 | 0.00 | .00 | 2.14 | .01 | 1.97 | .01 |
| Delinquency | 1.28 0.27 | 1.30 0.31 | 1.28 0.30 | 1.28 0.24 | 0.10 | .00 | 0.03 | .00 | 0.13 | .00 |
| Substance use | 1.22 1.99 | 1.79 3.09 | 1.49 2.43 | 1.05 1.82 | 2.25 | .01 | 2.62 | .02 | 0.59 | .00 |
| Grades | 8.21 2.38 | 8.47 2.76 | 7.96 2.39 | 8.71 2.50 | 0.16 | .00 | 6.00** | .03 | 2.14 | .01 |
| Class comp | −0.33 1.11 | −0.09 1.22 | −0.40 1.16 | −0.13 1.07 | 0.59 | .01 | 4.92** | .03 | 2.87 | .02 |
Note. Cluster values represent means ± standard deviation (standard scores). η2 is partial eta squared. A × F = Activity × Family.
N = 135.
N = 24.
N = 107.
N = 52.
Although activity F values are shown for descriptive purposes, they are not interpreted as the multivariate analysis of variance, and main effect for activity hours was not statistically significant.
N = 149.
N = 29.
N = 105.
N = 73.
p < .05.
p < .01.
p < .001.
Figure 2.
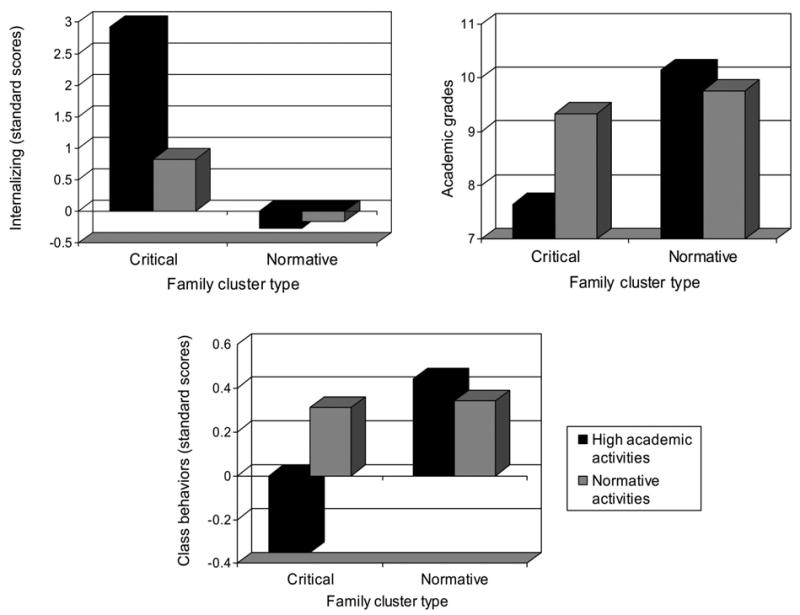
Girls’ adjustment patterns: Activity cluster by Family cluster.
Discussion
Results of this study yielded limited support for speculations that overscheduling of high-SES youth creates undue pressures and thus high psychopathology. Overall, there were modest links at best between the number of hours spent in sports, arts, academic, and civic extracurricular activities on the one hand and adjustment outcomes ranging from subjectively experienced maladjustment to academic competence on the other. Far more powerful than the number of hours spent in activities were children’s perceptions of their parents’ attitudes toward achievements; once these were considered, any previously observed links involving activities were substantially reduced in strength. Of the parent variables, particularly detrimental seemed to be perceived parental criticism for both gender groups and, to some degree, lack of after-school supervision. Low parent expectations connoted significant vulnerability especially for boys.
Time Spent in Activities
Among suburban students on the verge of high school, descriptive data showed considerable involvement in extracurricular activities but limited evidence that this stems from perceived pressure from adults. On average, girls and boys in this sample spent between 7 and 8 hr/week on structured extracurricular activities (range = 0 to ~20 hr/week). In terms of reasons for this involvement, enjoyment was mentioned for almost 5 hr/week on average, beliefs in benefits for the future for approximately 2.5 hr, and pressure from adults for 1.5 hr/week on average. In absolute terms, therefore, these early-adolescent children did not report pressure from parents as underlying inordinately high involvement in extracurriculars.
With regard to the ramifications for psychosocial adjustment, variable-based regression analyses lent scant evidence that high activity involvement contributes to disturbance. When hours in the four major activity groups—sports, arts, academics, and civics—were considered on their own, they explained a modest 2% to 11% of the variance across the various adjustment outcomes. In most instances, furthermore, the effects were positive, showing that high involvement was linked with good outcomes.
These results are consistent with prior findings of the ramifications of extracurricular participation across different contexts (Eccles, 2005). Among low- and middle-income teens, benefits have been found for both psychological adjustment and school performance via mechanisms such as acquisition of specific skills, learning to deal with challenges, and developing support networks (e.g., Barber, Eccles, & Stone, 2001; Bartko & Eccles, 2000; Eccles & Barber, 1999; Mahoney, 2000; Mahoney & Cairns, 1997; Youniss, McLellan, & Yates, 1997). Furthermore, sociological analyses suggest that the benefits of extracurriculars may be less pronounced in high- than low-income communities. In a study involving 13 schools, Guest and Schneider (2003) found that high involvement in sports was significantly linked with low- and middle-income children’s academic achievement, possibly reflecting community views that sports are part of a good student’s portfolio and promote likelihood of college admissions. On the other hand, among these wealthy students (almost all likely to attend college), participating in sports did not show such strong associations.
Of the four activity dimensions, the only one to show negative links across more than one outcome was academics hours. This was related to girls’ internalizing symptoms, delinquency, and substance use and to boys’ academic problems. These findings could reflect various possibilities, the first being that parents pressured children to do these activities and this, in turn, led to distress. However, if parent pressure did explain associations between overinvolvement in academic activities and maladjustment, then statistical consideration of parents’ achievement emphasis should have led to markedly reduced significance of academic hours, which, as our regression results indicate, it did not. Alternative explanations would entail causal links in the opposite direction. It is possible, for example, that when girls showed multiple signs of personal maladjustment or when boys performed particularly poorly at school, their parents enrolled them in extra-academic activities such as tutoring. These questions regarding directionality warrant attention in future longitudinal research.
Among boys, two activity dimensions were positively linked with academic indexes: involvement in arts and in sports. Notably, however, these associations were considerably reduced in strength when family variables were also considered in the simultaneous regressions. Collectively, the results suggest that optimal parenting around achievements, reflecting relatively high expectations but also low criticism from parents, accounted for much of the overlap between boys’ arts or sports involvement and good academic functioning.
Relative Salience of Different Family Dimensions
Of the six family dimensions we considered, two were salient for both gender groups: perceived parental criticism and lack of after-school supervision. Criticism had unique links with four of the five outcomes among both girls and boys, explaining as much as 16% of variance in their internalizing symptoms and 8% to 10% of variance in academic grades. These findings suggest the pervasive inimical effects of frequent parental criticism, although they might also partly reflect parents’ heightened frustration when their children have difficulties across diverse domains. With regard to lack of after-school supervision, this was related to all self-reported outcomes, explaining 10% and 15% of variance of delinquency scores among girls and boys, respectively. Supporting prior evidence with younger suburban children (Luthar & Becker, 2000), the present results show that even among eighth graders the absence of adult after-school supervision does not necessarily foster self-sufficiency (as is believed by many affluent parents; see Hochschild, 1997) but instead can increase risk for delinquent behaviors.
In terms of gender differences, high parent expectations were particularly beneficial for boys, uniquely explaining as much as 11% of variance in internalizing symptoms, substance use, and classroom competence and 17% of variation in their school grades. Benefits for girls were apparent only in relation to academic indexes, and the magnitude of these links were lower than those for boys. Collectively, the findings resonate with prior research showing that, during adolescence, parents’ monitoring is generally more critical for preventing problem behaviors among sons than daughters (Jacobson & Crockett, 2000; Leaper, 2002) in part because adolescent boys are more prone to risk taking and academic disengagement (Kowaleski-Jones & Duncan, 1999; Posner & Vandell, 1999).
Also consistent with prior evidence with younger suburban children (e.g., Luthar & Becker, 2000), our data showed that the adjustment status of girls covaried with a wider range of family functioning indexes, with significant effects for eating dinner with at least one parent and mothers’ emphasis on achievement in addition to criticism, after-school supervision, and parent expectations. Whereas the magnitude of these links did not always differ significantly across gender groups in the present study, it will be useful to explore, in future prospective research, whether suburban adolescent girls are, in fact, more sensitive to diverse aspects of family functioning indexes than are boys, as is suggested in theoretical views on the salience of relationships in feminine development (see Gilligan, 1982; Maccoby, 1998).
Person-Based Analyses
Cluster analyses were conducted to identify naturally occurring groups of students based on both activity involvement and family profiles and with respect to the former, results showed no evidence of a discrete overscheduled group excessively committed to multiple disparate extracurricular activities. Instead, they pointed to a small group involved in specific types of activities as opposed to a much larger normative group. In the case of girls, the unique cluster was one with very high hours in academic activities, and among boys, it was those who participated frequently in arts, academics, and civic activities. On family dimensions, conversely, a similar cluster solution was found among girls and boys, with one group characterized by high parent criticism and expectations (and in the case of girls infrequent dinners together) and the larger group with criticism and expectations below the group means.
Cluster comparisons on adjustment outcomes further supported the finding that, far more so than high activity involvement, it is adolescents’ perceptions of parents’ criticism and expectations that are linked with maladjustment. In both gender groups, even the small cluster of students with distinctive activity profiles did not differ from the larger normative cluster in terms of adjustment, whereas the two family clusters differed significantly in both cases. Among girls, we found some modest evidence of interactive trends; girls with high academic activities were, in fact, more troubled if they also fell in the cluster perceiving their parents as critical and overly achievement oriented. These findings resonate with evidence on positive youth development indicating that activities promoting skill building and support for efficacy must optimally occur in the context of supportive relationships with adults (National Research Council and Institute of Medicine, 2002).
In terms of gender differences, the family clusters explained far more variance in personal maladjustment scores of girls than boys, accounting for 12% versus 1% of variance on internalizing scores, 6% versus 0% on delinquency, and 4% versus 2% on substance use. Again, these results support prior findings, including our own variable-based ones, suggesting girls’ greater sensitivity to diverse family functioning indexes. Also consistent with variable-based analyses were findings that the cluster of boys with high parental criticism and expectations actually performed better on academic indexes than did the normative group. Aside from reflecting the previously discussed benefits of high parental expectations for boys (who tend to have low investment in academics), these results might also suggest that, more so than girls, boys perceiving parent criticism may experience some mitigating factors. As Maccoby (1998) has noted, fathers are more punitive with sons than with daughters but are also more likely to take interest in them, more often taking them, for example, to sports events. Such benefits could be reflected in the adequate achievement of boys in the high parent criticism and expectations cluster within this study.
Limitations, Implications, and Future Directions
The cross-sectional data in this study preclude any conclusions about causality, and the pattern of findings does not necessarily apply to older affluent youth. As previously indicated, it is plausible that youngsters manifesting multiple behavior problems elicited criticism from parents, and such questions about directionality need to be considered in longitudinal research. Also useful would be studies of extracurricular involvement among affluent high school students; given increasing pressures for resume building with approaching college applications, it is plausible that some deleterious effects of overscheduling may eventually emerge.
Our measure of children’s extracurricular activities did not capture week-to-week variations in this domain but rather provided a snapshot over a discrete period of 1 month from which we inferred average levels. Whereas this strategy is not unusual (e.g., the CDI, a widely used measure with good psychometrics, queries about depressive symptoms during the preceding 2 weeks), it might be useful, although logistically challenging, to attempt more intensive assessments of activities on a weekly or monthly basis throughout the academic year.
The sole reliance on self-reports to assess students’ involvement in different extracurricular activities is also a limitation, although this is the modal assessment approach in adolescent research (see Eccles et al., 2003; Gilman et al., 2004; Pedersen & Seidman, 2005). Furthermore, several factors attested to the reliability and validity of reports in this study, including the significant 1-year correlations for hours spent in different activities, the correlations with self-identified crowd membership, and the robustness of findings in spite of controls for social desirability.
Despite replication in two halves of this particular cohort, results of our cluster analyses must be interpreted with caution. Results of empirically derived classification systems such as cluster analyses invariably show some variations from one sample to another because solutions are dependent on variables chosen for inclusion, the clustering algorithm, and the number of groups chosen to extract (Everitt, 1993; Hair & Black, 2000). This caveat notwithstanding, there is, in fact, an important substantive message inherent in our cluster findings: At least among middle-school students, there is no evidence of a discrete subgroup of generally hyper-scheduled youth—excessively committed to different activities—who might account for the overrepresentation of highly depressed, anxious, and substance-using youngsters in suburban settings (cf. Luthar & Latendresse, 2005a).
Measurement of parenting dimensions via self-reports also could be seen as a limitation but was a deliberate choice in this study because our interest was in children’s subjective experiences of parental pressures and not in perceptions of the parents themselves (or those of objective observers). Our central goal was to ascertain which particular dimensions of parents’ achievement emphases, as perceived by the children themselves, stood out from the others and from hours spent in extracurriculars, in terms of being especially salient for youngsters’ distress.
It is critical to emphasize that in terms of suburban parents’ various attitudes toward achievements, the two most important variables in this study, expectations and criticism, have opposite connotations: The former are beneficial, whereas the latter is detrimental. It is by no means problematic—in fact, it is salutary—when upper-class parents (like others) hold generally high expectations of their children and let this be known. On the other hand, it is destructive when children come to feel diminished or unworthy because of failing to live up to parents’ standards. The difference here, in essence, is between parents holding generally high standards for their children on the one hand versus communicating disparagement or denigration when the latter fail to live up to lofty achievement goals.
In terms of implications for developmental theory, the findings underscore the value of heeding Garcia Coll, Ackerman, and Cicchetti’s (2000) exhortation that for all little-explored populations, applied developmental scientists must ascertain, through rigorous within-group studies, the relative salience of overlapping indexes processes within that particular context (see also Johnson, Jaeger, Randolph, Cauce, & Ward, 2003). Results showed that counter to widespread beliefs about the destructive overscheduling of wealthy youth, activity involvement generally had mild positive associations if anything; it was aspects of family dynamics that were of much more significance.
Results of this study also underscore the fact that some core developmental themes transcend socioeconomic boundaries (see Garcia Coll et al., 1996). Most importantly, they highlight the salience of family influences in adolescent development—influences that are both proximal and constant in the child’s life—over and above those in extrafamilial contexts such as involvement in extracurricular activities (Luthar & Zelazo, 2003). Chronically critical parenting can profoundly affect all children regardless of their families’ material wealth.
Notably, high parent criticism within this particular cohort does not reflect a level that is benign in absolute terms, connoting moderate elevations within a generally supportive community. In previous comparisons of this sample when they were sixth graders and a parallel sample of inner-city sixth graders (Luthar & Latendresse, 2005b), mean values on most parent dimensions were comparable. Thus, in the clusters we derived here, criticism scores of plus 1.5 SD were also well above the average levels of criticism reported by students of low-income parents, who routinely contend with stressors of life in urban poverty.5
In future research, it would be useful to explore the reasons for parenting disturbances among high-SES families. In low-income settings, it is widely accepted that parenting problems such as harshness or neglect can derive from the myriad stressors of life in poverty (Luthar, 1999). We know little about the reasons for significant parenting problems among the well-to-do, although some speculations have been offered (Luthar & Latendresse, 2005b; Luthar & Sexton, 2004): High parental criticism, for example, could reflect some parents’ excessive reliance on accomplishments for self-worth (e.g., Kasser, 2002; Miller, 1995) and the resultant stress when failures are perceived (Rosenfeld & Wise, 2000). Alternatively, third variables disrupting both family processes and children’s adaptation might be implicated, such as parents’ depression or marital conflict (Luthar, 2003a; Luthar & Sexton, 2004).
Considered broadly in terms of implications of extracurricular involvement, findings of this study have important pragmatic implications inasmuch as they refute widespread concerns about the destructive nature of overscheduling among affluent children. Fears in this regard have become increasingly rampant partly as a result of national media reports with catchphrase headlines such as “Busy Around the Clock: The Tyranny of Overscheduled Kids” (Kantrowitz, 2000) and “Rethinking Rush of After-School Activities” (Belluck, 2000). Most of these stories have included interviews with researchers and clinicians and also have cited evidence from peer-reviewed journals (cf. Luthar & Becker, 2002; Luthar & Sexton, 2004). With ease of communication by means of the Internet, these stories have proliferated quickly and widely.
Psychologists are often urged to bring to public awareness their research discoveries on what promotes well-being (Csikszentmihalyi, 1999; Lerner, Fisher, & Weinberg, 2000; McCall & Groark, 2000; Zigler, 1998), in part to circumvent “unwarranted or irresponsible assertions. . .made in the name of science” (Shonkoff, 2000, p. 181), and results of this study provide some critical clarifications warranting dissemination. It is certainly possible that, among upper-class youth, high involvement particularly in academic after-school activities, to the relative exclusion of others, can connote distress. On the whole, however, it is clear that there are many suburban middle-school students who do in fact spend several hours a week at diverse structured activities; these youngsters generally (a) enjoy their activities and do not feel pressured into them and (b) show relatively positive adjustment on psychological and academic adjustment indexes. Concerned, well-educated, high-income parents must, therefore, be disabused of the notion that promoting their children’s involvement in extracurricular activities necessarily causes the elevated distress reported in developmental studies of wealthy youth (Luthar & Latendresse, 2005b).
In conclusion, the take-home message from this study of suburban middle-school children is that high extracurricular involvement in itself is not necessarily destructive. It is much more damaging when children feel that their failures render them unworthy in their parents’ eyes or when they believe that their parents are uninvolved and uninvested in their activities and pursuits. In wealthy communities, as in all others, parenting behaviors conveying acceptance and appreciation, balanced with reasonably high standards and expectations, are critical for the healthy, adaptive development of young people.
Footnotes
Luthar and Latendresse (2005a) describe our programmatic research encompassing three different suburban cohorts we have studied over the last decade. This study reports on the third suburban cohort, the New England Study of Suburban Youth, whom we have monitored longitudinally from the sixth grade onward (see Luthar & Latendresse, 2005b).
Other studies on extracurricular activities have used similar categories (e.g., see Barber, Stone, Hunt, & Eccles, 2005; Jacobs, Vernon, & Eccles, 2005; Pedersen & Seidman, 2005).
We elected to examine interaction effects in post hoc rather than central analyses because (a) prior research shows gender differences in effects of socializing processes, indicating the value of within-gender analyses, and (b) we did not have a priori hypotheses about specific gender differences in all the present predictors. To have considered gender-based interactions in our primary analyses (using the whole sample) was inadvisable because this would have involved including 10 interaction terms in the equation, leading to considerable loss of statistical power and thus potentially obscuring main effects that did, in fact, exist in one or both gender groups (cf. Cohen, Cohen, West, & Aiken, 2003; Luthar, 2006).
In fact, the mean perceived criticism scores were not significantly different in this suburban sample and the parallel inner-city sample when they were in the 8th grade as well; mean scores were 8.5 (4.0 SD) and 8.8 (3.5 SD), respectively.
This work was supported by National Institutes of Health Grants R01-DA10726, R01-DA11498, and R01-DA14385; the William T. Grant Foundation; and the Spencer Foundation.
References
- Barber BL, Eccles JS, Stone MR. Whatever happened to the jock, the brain, and the princess? Young adult pathways linked to adolescent activity involvement and social identity. Journal of Adolescent Research. 2001;16:429–455. [Google Scholar]
- Barber BL, Stone MR, Hunt JE, Eccles JS. Benefits of activity participation: The roles of identity and peer group norm sharing. In: Mahoney JL, Larson RW, Eccles JS, editors. Organized activities as contexts of development: Extracurricular activities, after-school and community programs. Mahwah, NJ: Erlbaum; 2005. pp. 185–210. [Google Scholar]
- Bartko WT, Eccles JS. Adolescent participation in structured and unstructured activities: A person-oriented analysis. Journal of Youth & Adolescence. 2000;32:233–241. [Google Scholar]
- Belluck P. The New York Times. 2000. June 13, Parents try to reclaim their children’s time; p. A18. [Google Scholar]
- Belsley DA. Conditioning diagnostics: Collinearity and weak data in regression. New York: Wiley; 1991. [Google Scholar]
- Casey DM, Ripke MN, Huston AC. Activity participation and the well-being of children and adolescents in the context of welfare reform. In: Mahoney JL, Larson RW, Eccles JS, editors. Organized activities as contexts of development: Extracurricular activities, after-school and community programs. Mahwah, NJ: Erlbaum; 2005. pp. 65–84. [Google Scholar]
- Cohen J, Cohen P, West SG, Aiken LS. Applied multiple regression/correlation analysis for the behavioral sciences. 3. Mahwah, NJ: Erlbaum; 2003. [Google Scholar]
- Cooper H, Valentine JC, Nye B, Lindsay JJ. Relationships between five after-school activities and academic achievement. Journal of Educational Psychology. 1999;91:369–378. [Google Scholar]
- Csikszentmihalyi M. If we are so rich, why aren’t we happy? American Psychologist. 1999;54:821–827. [Google Scholar]
- DeCarlo LT, Luthar SS. Analysis of class validation of a measure of parental values perceived by adolescents: An application of a latent class model for rankings. Educational and Psychological Measurement. 2000;60:578–591. doi: 10.1177/00131640021970736. [DOI] [PMC free article] [PubMed] [Google Scholar]
- Eccles J, Barber BL. Student council, volunteering, basketball, or marching band: What kind of extracurricular involvement matters? Journal of Adolescent Research. 1999;14:10–43. [Google Scholar]
- Eccles JS. The present and future of research on activity settings as developmental contexts. In: Mahoney JL, Larson RW, Eccles JS, editors. Organized activities as contexts of development: Extracurricular activities, after-school and community programs. Mahwah, NJ: Erlbaum; 2005. pp. 353–374. [Google Scholar]
- Eccles JS, Barber BL, Stone M, Hunt J. Extracurricular activities and adolescent development. Journal of Social Issues. 2003;59:865–889. [Google Scholar]
- Elliot DS, Dunford FW, Huizinga D. The identification and prediction of career offenders utilizing self-reported and official data. In: Burchard J, Burchard S, editors. Prevention of delinquent behavior. Newbury Park, CA: Sage; 1987. pp. 90–121. [Google Scholar]
- Everitt BS. Cluster analysis. 3. London: Hodder & Stoughton; 1993. [Google Scholar]
- Frost RO, Marten P, Lahart CM, Rosenblate R. The dimensions of perfectionism. Cognitive Therapy and Research. 1990;13:449–468. [Google Scholar]
- Galen B, Luthar SS. Negative behaviors linked with middle schoolers’ popularity: A three-year longitudinal study. 2006. Manuscript submitted for publication. [Google Scholar]
- Garcia Coll C, Ackerman A, Cicchetti D. Cultural influences on developmental processes and outcomes: Implications for the study of development and psychopathology. Development & Psychopathology. 2000;12:333–356. doi: 10.1017/s0954579400003059. [DOI] [PubMed] [Google Scholar]
- Garcia Coll C, Lamberty G, Jenkins R, McAdoo HP, Crnic K, Wasik BH, et al. An integrative model for the study of developmental competencies in minority children. Child Development. 1996;67:1891–1914. [PubMed] [Google Scholar]
- Gilbert S. For some children, it’s an after-school pressure cooker. New York Times. 1999 August 3;:F-7. [Google Scholar]
- Gilligan C. In a different voice: Psychological theory and women’s development. Cambridge, MA: Harvard University Press; 1982. [Google Scholar]
- Gilman R, Meyers J, Perez L. Structured extracurricular activities among adolescents: Findings and implications for school psychologists. Psychology in the Schools. 2004;41:31–41. [Google Scholar]
- Guest A, Schneider B. Adolescents’ extracurricular participation in context: The mediating effects of schools, communities, and identity. Sociology of Education. 2003;76:89–109. [Google Scholar]
- Hair JF, Black WC. Cluster analysis. In: Grimm LG, Yarnold PR, editors. Reading and understanding MORE multivariate statistics. Washington, DC: American Psychological Association; 2000. pp. 147–205. [Google Scholar]
- Hightower AD, Work WC, Cowen EL, Lotyczewski BS, Spinell AP, Guare JC, et al. The Teacher-Child Rating Scale: An objective measure of elementary school children’s school problem behaviors and competencies. School Psychology Review. 1986;15:393–409. [Google Scholar]
- Hochschild AR. The time bind: When work becomes home and home becomes work. New York: Henry Holt; 1997. [Google Scholar]
- Huizinga D, Elliot DS. Reassessing the reliability and validity of self-report delinquency measures. Journal of Quantitative Criminology. 1986;2:293–327. [Google Scholar]
- Jacobs JE, Vernon MK, Eccles JS. Activity choices in middle childhood: The roles of gender, self-belief, and parents’ influence. In: Mahoney JL, Larson RW, Eccles JS, editors. Organized activities as contexts of development: Extracurricular activities, after-school and community programs. Mahwah, NJ: Erlbaum; 2005. pp. 235–254. [Google Scholar]
- Jacobson KC, Crockett LJ. Parental monitoring and adolescent adjustment: An ecological perspective. Journal of Research on Adolescence. 2000;10:65–97. [Google Scholar]
- Johnson DJ, Jaeger E, Randolph SM, Cauce AM, Ward J. Studying the effects of early child care experiences on the development of children of color in the United States: Toward a more inclusive research agenda. Child Development. 2003;74:1227–1244. doi: 10.1111/1467-8624.00604. [DOI] [PubMed] [Google Scholar]
- Johnston LD, O’Malley PM, Bachman JG. Drugs and American high school students: 1975–1983. DHHS (ADM) 85–1374. Washington, DC: U. S. Government Printing Office; 1984. [Google Scholar]
- Kantrowitz B. Busy around the clock. Newsweek. 2000 July 17;136:49–50. [Google Scholar]
- Kasser T. The high price of materialism. Cambridge, MA: MIT Press; 2002. [Google Scholar]
- Kovacs M. Children’s Depression Inventory Manual. New York: Multi-Health Systems; 1992. [Google Scholar]
- Kowaleski-Jones L, Duncan GJ. The structure of achievement and behavior across middle childhood. Child Development. 1999;70:930–943. [Google Scholar]
- Leaper C. Parenting girls and boys. In: Bornstein MH, editor. Handbook of parenting: Vol 3 Being and becoming a parent. Mahwah, NJ: Erlbaum; 2002. pp. 189–226. [Google Scholar]
- Lerner RM, Fisher CB, Weinberg RA. Toward a science for and of the people: Promoting civil society through the application of developmental science. Child Development. 2000;71:11–20. doi: 10.1111/1467-8624.00113. [DOI] [PubMed] [Google Scholar]
- Luthar SS. Social competence in the school setting: Prospective cross-domain associations among inner-city teens. Child Development. 1995;66:416–429. doi: 10.1111/j.1467-8624.1995.tb00880.x. [DOI] [PMC free article] [PubMed] [Google Scholar]
- Luthar SS. Poverty and children’s adjustment. Thousand Oaks, CA: Sage; 1999. [Google Scholar]
- Luthar SS. The culture of affluence: Psychological costs of material wealth. Child Development. 2003a;74:1581–1593. doi: 10.1046/j.1467-8624.2003.00625.x. [DOI] [PMC free article] [PubMed] [Google Scholar]
- Luthar S, editor. Resilience and vulnerability: Adaptation in the context of childhood adversities. New York: Cambridge University Press; 2003b. [Google Scholar]
- Luthar SS. Resilience in development: A synthesis of research across five decades. In: Cicchetti D, Cohen DJ, editors. Developmental psychopathology: Risk, disorder, and adaptation. 2. New York: Wiley; 2006. pp. 739–795. [Google Scholar]
- Luthar SS, Becker BE. Privileged but pressured: A study of affluent youth. Child Development. 2002;73:1593–1610. doi: 10.1111/1467-8624.00492. [DOI] [PMC free article] [PubMed] [Google Scholar]
- Luthar SS, D’Avanzo K. Contextual factors in substance use: A study of suburban and inner-city adolescents. Development and Psychopathology. 1999;11:845–867. doi: 10.1017/s0954579499002357. [DOI] [PMC free article] [PubMed] [Google Scholar]
- Luthar SS, Latendresse SJ. Children of the affluent: Challenges to well-being. Current Directions in Psychological Science. 2005a;14:49–53. doi: 10.1111/j.0963-7214.2005.00333.x. [DOI] [PMC free article] [PubMed] [Google Scholar]
- Luthar SS, Latendresse SJ. Comparable “risks” at the SES extremes: Pre-adolescents’ perceptions of parenting. Development and Psychopathology. 2005b;17:207–230. doi: 10.1017/s095457940505011x. [DOI] [PMC free article] [PubMed] [Google Scholar]
- Luthar SS, Sexton C. The high price of affluence. In: Kail RV, editor. Advances in child development. Vol. 32. San Diego, CA: Academic Press; 2004. pp. 126–162. [DOI] [PMC free article] [PubMed] [Google Scholar]
- Luthar SS, Zelazo LB. Research on resilience: An integrative review. In: Luthar SS, editor. Resilience and vulnerability. Adaptation in the context of childhood adversities. New York: Cambridge University Press; 2003. pp. 510–549. [Google Scholar]
- Maccoby EE. The two sexes: Growing up apart, coming together. Cambridge, MA: Belknap Press; 1998. [Google Scholar]
- Magnusson D. The individual as the organizing principle in psychological inquiry: A holistic approach. In: Bergman LR, Cairns RB, editors. Developmental science and the holistic approach. Mahwah, NJ: Erlbaum; 2000. pp. 33–47. [Google Scholar]
- Mahoney JL. School extracurricular activity participation as a moderator in the development of antisocial patterns. Child Development. 2000;71:502–516. doi: 10.1111/1467-8624.00160. [DOI] [PubMed] [Google Scholar]
- Mahoney JL, Cairns RB. Do extracurricular activities protect against early school dropout? Developmental Psychology. 1997;33:241–253. doi: 10.1037//0012-1649.33.2.241. [DOI] [PubMed] [Google Scholar]
- Mahoney JL, Larson RW, Eccles JS, Lord H. Organized activities as developmental contexts for children and adolescents. In: Mahoney JL, Larson RW, Eccles JS, editors. Organized activities as contexts of development: Extracurricular activities, after-school and community programs. Mahwah: Erlbaum; 2005. pp. 3–22. [Google Scholar]
- McCall RB, Groark CJ. The future of applied child development research and public policy. Child Development. 2000;71:197–204. doi: 10.1111/1467-8624.00134. [DOI] [PubMed] [Google Scholar]
- Miller A. The drama of the gifted child. New York: Basic Books; 1995. [Google Scholar]
- National Research Council and Institute of Medicine. Features of positive developmental settings. In: Eccles J, Gootman J, editors. Community programs to promote youth development. Washington, DC: National Academy Press; 2002. pp. 86–118. [Google Scholar]
- Osgood DW, Anderson AL, Shaffer JN. Unstructured leisure in the after-school hours. In: Mahoney JL, Larson RW, Eccles JS, editors. Organized activities as contexts of development: Extracurricular activities, after-school and community programs. Mahwah: Erlbaum; 2005. pp. 45–64. [Google Scholar]
- Pedersen S, Seidman E. Contexts and correlates of out-of-school activity participation among low-income urban adolescents. In: Mahoney JL, Larson RW, Eccles JS, editors. Organized activities as contexts of development: Extracurricular activities, after-school and community programs. Mahwah: Erlbaum; 2005. pp. 85–110. [Google Scholar]
- Pittman FS. Children of the rich. Family Process. 1985;24:461–472. doi: 10.1111/j.1545-5300.1985.00461.x. [DOI] [PubMed] [Google Scholar]
- Posner JK, Vandell DL. After-school activities and the development of low-income urban children: A longitudinal study. Developmental Psychology. 1999;35:868–879. doi: 10.1037//0012-1649.35.3.868. [DOI] [PubMed] [Google Scholar]
- Reynolds CR, Richmond BO. Revised Children’s Manifest Anxiety Scale: Manual. Los Angeles: Western Psychological Services; 1985. [Google Scholar]
- Rosenfeld A, Wise N. The overscheduled child: Avoiding the hyper-parenting trap. New York: St. Martin’s Press Griffin; 2000. [Google Scholar]
- Shafran RB. Children of affluent parents. In: O’Brien JD, Pilowsky DJ, editors. Psychotherapies with children and adolescents: Adapting the psychodynamic process. Washington, DC: American Psychiatric; 1992. pp. 269–288. [Google Scholar]
- Shonkoff JP. Science, policy, and practice: Three cultures in search of a shared mission. Child Development. 2000;71:181–187. doi: 10.1111/1467-8624.00132. [DOI] [PubMed] [Google Scholar]
- Stattin H, Magnusson D. Antisocial development: A holistic approach. Development & Psychopathology. 1996;8:617–645. [Google Scholar]
- von Eye A, Bergman LR. Research strategies in developmental psychopathology: Dimensional identity and the person-oriented approach. Development & Psychopathology. 2003;15:553–580. doi: 10.1017/s0954579403000294. [DOI] [PubMed] [Google Scholar]
- Youniss J, McLellan JA, Yates M. What we know about engendering civic identity. American Behavioral Scientist. 1997;40:620–631. [Google Scholar]
- Zigler E. A place of value for applied and policy studies. Child Development. 1998;69:532–542. [Google Scholar]