

Abstract
Macromolecular assemblies and machines undergo large-scale conformational changes as essential features of their normal function. Modern stopped-flow instrumentation and biotechnology combine to provide a powerful tool for characterizing the rates and natures of these conformational changes. Standard commercially available instruments provide extraordinary sensitivity and speed, allowing analysis of millisecond or longer timescale processes, with concentrations as low as a few nanomolar and volumes of just a few hundred microliters. One can now place specific dyes anywhere desired on a nucleic acid, and often on a protein as well. This ability allows the use of fluorescence resonance energy transfer experiments for detailed conformational analyses, even as the system is evolving rapidly over time following the initiation of a reaction. This approach is ideally suited for analysis of intrinsic properties of chromatin and of the machines that control chromatin assembly, disassembly, and function.
Keywords: Chromatin, Histones, LexA protein, DNA, Nucleosome reconstitution, FRET, Kinetics, Cy-dye labeling, Conformational dynamics, Site exposure
1. Introduction
The packaging of DNA in chromatin creates obstacles that occlude the binding of regulatory proteins to their DNA target sites, and occlude the access of polymerases, repair, and recombination enzymes to their DNA substrates. These obstacles occur with even the lowest level of chromatin organization, the wrapping of DNA locally around a histone protein octamer into a nucleosome. How these obstacles are overcome in vivo, allowing these many multi-protein complexes access to their target sites and substrates when needed, is not known.
Our laboratory has been investigating one possible answer to this question, which involves a dynamic accessibility that is intrinsic to nucleosomes themselves. Early studies using restriction enzymes as probes of accessibility of nucleosomal DNA showed that nucleosomes exist in a dynamic conformational equilibrium in which the wrapped nucleosomal DNA spontaneously partially unwraps, such that stretches of the buried DNA are constantly, but transiently, fully accessible, as though they are naked DNA. We refer to this behavior as “site exposure”. The equilibrium constant for site exposure – the fraction of time that a given stretch of DNA acts as though it is freely-accessible naked DNA – can be surprisingly large: as much as 0.01–0.1 (i.e., 1–10%) of the time (depending on the DNA sequence) for sites just inside from the end of the nucleosome, decreasing progressively to 10−4–10−5, for sites in the middle of the nucleosomal DNA. These results suggested a mechanism for site exposure in which the wrapped nucleosomal DNA spontaneously unwraps starting from one end of the nucleosome, and progressing inward, likely in steps of DNA helical turns (~10 bp). Subsequent biochemical studies proved that site exposure occurred not by nucleosome sliding, as some had imagined, but by partial unwrapping, leaving the remainder of the wrapped DNA fixed on the histone octamer. Recent studies suggest that not only is site exposure an intrinsic property of nucleosomes in vitro, but it appears to be functionally important in vivo. A remarkable cooperative binding behavior predicted by the site exposure model occurs in vivo [1]; and studies on UV photodamage repair by photolyase in vivo suggest that the rate is too fast to be consistent with remodeling factor action and must instead reflect intrinsic nucleosome dynamics [2].
Biochemical studies revealed the existence of intrinsic nucleosomal site exposure, but are unable on their own to test the hypothesis that nucleosomal DNA unwraps from an end, and they did not provide access to the rates of site exposure and re-wrapping. The fluorescence resonance energy transfer (FRET) experiment provides an ideal solution to these needs [3]. FRET represents the nonradiative transfer of energy from a fluorescence donor (D) to an acceptor (A), whose absorption spectrum must overlap partially with the emission spectrum of D. The hallmark of FRET is that when one excites D, one observes less fluorescence emission from D than would otherwise be expected (in the absence of A), and, if A is itself a fluorophore, one detects excess emission intensity from A owing to the transfer of excitation energy from D to A (“sensitized emission”). The efficiency of FRET depends on the sixth power of the actual distance (R) between D and A, relative to a characteristic transfer distance, R0 (the distance between D and A at which FRET occurs with 0.5 probability). Changes in FRET may be monitored, among other ways, by detecting changes in quenching of the donor or changes in sensitized emission of the acceptor. A beauty of the FRET experiment is that R0 values for common dye pairs are in the several nm range, and thus the FRET efficiency is a sensitive function of nm-scale changes in distance between D and A. A second important feature of FRET is that it is a nanosecond timescale process; and thus may be continuously read to report on slower timescale molecular dynamics.
In earlier work our laboratory used steady-state FRET to show that nucleosomal DNA unwraps starting from one end [4]; and we and others have used it to characterize the relative stability of nucleosomes (H.S.T. and J.W. unpublished) [5] and the conformational changes that result upon binding of a site specific DNA binding protein [4, 6]. In subsequent work we used FRET in conjunction with fluorescence correlation spectroscopy (FCS) and stopped-flow mixing, to measure the rates of unwrapping and re-wrapping of nucleosomal DNA [7]. Current studies investigate the rates of site accessibility at sites further inside the nucleosome (H.S.T. and J.W. unpublished), and the dynamic nucleosome conformational changes that are driven by ATP-dependent [8] or ATP-independent nucleosome remodeling factors and chaperones. These processes can occur on the hundreds of milliseconds to many seconds timescale, and thus may be too slow for conventional free solution FRET-FCS. However, this same timescale is ideal for analysis by stopped flow mixing coupled with FRET, which gives convenient access to timescales from a few milliseconds on up. Thus we expect that the basic procedures that others and we have developed will prove to be of broad utility in studies of nucleosome dynamics. Here we describe how to design, set up, and execute such a stopped-flow FRET study on nucleosomes.
2. Experimental design
2.1 Overall strategy
This broad approach to analysis of conformational dynamics has several requirements that must be met. One must have a way to drive the dynamics to be studied, so that there will be a significant change in the average state of the system between the beginning and end of the experiment. Moreover, it must be possible to rapidly turn on this driving force by mixing two reagents together. Finally, one must have a way of quantitatively monitoring the evolution of the system in real time, as the system progresses through the reaction.
In our case, we wish to study spontaneous nucleosome unwrapping. We create a driving force by coupling nucleosome unwrapping to the binding of a site specific DNA binding protein that would like to bind to a nucleosomal target site, but can’t – until the nucleosome unwraps to make the previously buried site accessible. This process can be initiated by mixing together two solutions, one containing the nucleosomes in buffer, the other containing the site-specific binding protein in buffer. Studies of ATP-dependent proteins can often initiate reactions by rapid addition of ATP. Again in our case, since we wish to study specific conformational changes, FRET provides an ideal real-time readout.
In the studies described here, we use the Escherichia coli repressor protein LexA as an arbitrarily chosen site specific DNA binding protein that can only bind to its target site when that stretch of DNA has been unwrapped from the surface of the histone core of the nucleosome (Fig. 1A). Even at the lowest LexA concentrations that suffice to yield a detectable FRET change (i.e., that trap and stabilize a significant fraction of nucleosomes in the unwrapped state), the LexA binding is fast and stable in comparison to DNA unwrapping-rewrapping times [7]; thus, LexA binding can be used to trap nucleosomes in a partially unwrapped conformation. At the start of the reaction, most nucleosomes have fully wrapped DNA (small equilibrium constant for unwrapping); after addition and binding of LexA at sufficient concentrations, most nucleosomes have significantly unwrapped their DNA and have been trapped in this state by LexA binding.
Fig. 1.
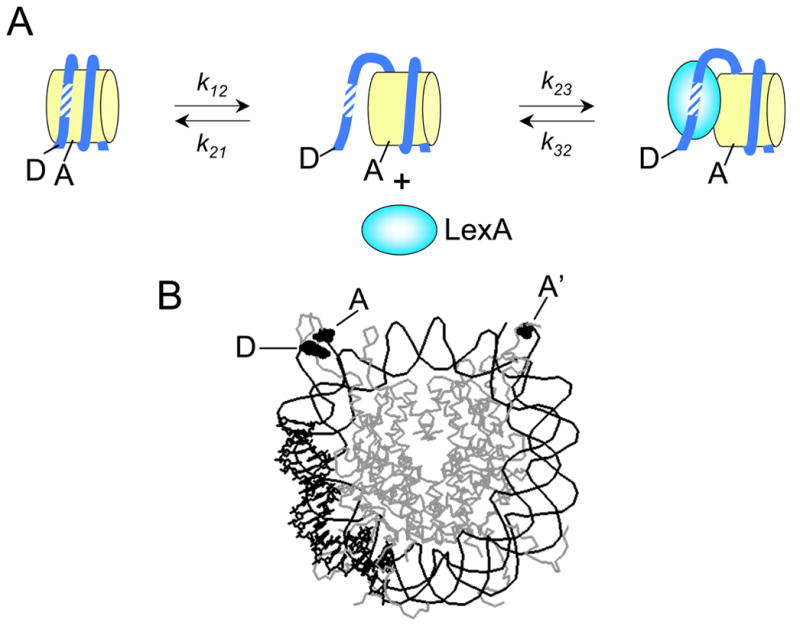
System used for analysis of nucleosome conformational dynamics. A. The site exposure model. Donor and acceptor fluorophore locations are indicated by D and A respectively. The location of a binding site for LexA protein is shown hatched. DNA unwrapping from the nucleosome must precede LexA binding, and is rate limiting. B. Crystal structure of the nucleosome [16]. Dye-labeled residues shown in space filling representation. The DNA region containing the LexA binding site is shown in bold. The FRET donor dye Cy3 (D) is attached to the DNA at the 5’ end. The FRET acceptor dye Cy5 (A) is attached to V35 of histone H3 V35C, C110A. Since there are two copies of histone H3 in the nucleosome, there are two sites of attachment of A: one close to D giving efficient FRET, and one (labeled A’) that is too far away from D to give significant FRET.
We choose locations for the FRET dyes such that the distance between D and A changes greatly when the DNA unwraps. One good choice, which we have used repeatedly, is between one end of the wrapped DNA and an adjacent region on the histone core, either histone H3 V35C or histone H2A K119C (Fig. 1B).
Routine biotechnology allows dyes to be placed anywhere desired along a nucleic acid. The protein chemistry is more constrained, with only cysteine modification being both easily accomplished and adequately specific. Therefore it is necessary to have proteins in which any exposed free cysteines have been mutated away, and a single new one introduced at a desired location. Of course, having access to sequence alignments showing phylogenetically conserved residues, and to X-ray crystallographic structures, is enormously helpful.
One other important technical detail in experimental design bears mention. The histone octamer contains two molecules each of four different histone proteins, arranged in a complex with two-fold rotational symmetry (dyad symmetry). This means that there will be two engineered cysteines in the complex, not one. In such circumstances it may be beneficial to label the protein with the acceptor dye, and the DNA with the donor. This strategy will place one of the two A’s nearby D, ensuring highly efficient FRET, while the other, (designated A’ in Fig. 1B) will be too far to exhibit any significant FRET. This strategy allows a full range of FRET efficiency, from 0–1, to be observed. Nanometer-scale increases in distance from D to the closer A will then be manifested as changes in FRET efficiency, while changes in distance to the further A will be invisible. In contrast, if one reversed the labeling (two D’s on the protein, one A on the DNA), then the highest possible FRET efficiency is only 0.5, greatly compressing the dynamic range of the experiment.
2.2 FRET Dye Pair
We generally utilize acceptors that are also fluorophores, as this allows additional ways to quantify FRET [3]. The characteristic distance for energy transfer R0 depends, among other things, on the degree of spectral overlap between the emission spectrum of D and the excitation spectrum of A. Many of the most commonly used dye pairs have R0’s of approximately ~5–6 nm. Because of the strong (sixth power) dependence of FRET efficiency on D–A separation distance (R) relative to R0, such dye pairs yield large changes in FRET efficiency if R, changes from rather less than R0 to rather greater (or vice versa). We therefore choose the locations of A on the histone octamer so as to place one of the two A’s close to D when nucleosomes are in the native state, in the expectation that a large change in D–A distance will occur when the DNA unwraps to allow binding by LexA protein.
We use the especially popular pair Cy3 (as D) and Cy5 (A), which have R0 of ~5–6 nm, because of their relatively great photostability. We attach a single Cy3 to the 5’ end of DNA. We attach the Cy5 acceptor fluorophore via maleimide chemistry to a unique cysteine mutation introduced in the solvent exposed tail of histone H3 (V35C, C110A). The double mutation in histone H3 removes a cysteine that is naturally present, replacing it with a new unique cysteine at the desired location. Alanine is chosen as the replacement for the original C110, as this mutation is unlikely to be strongly destabilizing, moreover it occurs naturally in the otherwise nearly perfectly conserved sequence of histone H3 between Xenopus and yeast. We find empirically that labeling at these sites does not detectably affect the formation or stability of reconstituted nucleosomes. From the crystal structure of the nucleosome, these labeling sites on H3 are ~2 nm or ~7 nm away from D (Fig. 1B), thus we expect ~100% efficient FRET to the near acceptor, and negligible FRET to the further dye.
2.3 Donor-labeled DNA construct
To ensure a high degree of homogeneity in the reconstituted nucleosomes, we assemble the nucleosomes on a derivative of the selected high affinity nonnatural nucleosome positioning sequence, “601” [9]. The experiments described here require the addition of a binding site for LexA protein, located at basepairs 8–27, nearby a Cy3 fluorescence donor dye attached at the DNA left-hand 5’-end (basepair 1) (Fig. 1). The detailed location of the LexA site in our nucleosomal DNA is chosen so that the face of DNA that will be occupied by LexA is oriented inward, wrapped against the histone protein core. The orientation of DNA relative to histones is known from the crystal structure of the nucleosome, while the orientation of LexA bound on its target site is known from modeling and biochemical studies. Thus the LexA target site is inaccessible to LexA until the DNA unwraps (Fig. 1). The LexA binding site does not significantly change the ability of 601 to position nucleosomes [10].
The needed DNA is constructed using two stages of PCR. In a first stage, we use PCR with a primer containing the LexA site, to change the starting 601 template DNA into the modified form containing the LexA site. To ensure good hybridization of the primer containing the LexA site, we make it long enough so that its melting temperature, calculated using only the nucleotides located 3’ of the LexA site (i.e., 3’ of any non-homology to the template DNA), is the same as for the other end primer (typically 60 °C). The resulting PCR product is gel or HPLC purified, then a small amount is cloned, and resulting clones are sequenced.
We then use a second step of PCR to create the actual dye-labeled DNA that will be used in nucleosome reconstitutions. In the experiments described here, a Cy3 dye is attached to the 5’ end of the left-hand PCR primer. The dye labeled primers are purchased commercially, supplied HPLC purified. The PCR is carried out in 100 μl volumes, typically 48 tubes per batch, aliquoted out from a master mix. (Our experience is that larger volume PCR reactions give more product per reaction, but less per unit volume, and thus are more costly in practice.) Primers are designed for a 60 °C melting temperature. For incorporation of dye labeled primers into a PCR product, the reaction conditions per 100 μl reaction are: 1 ng purified 147 bp template DNA, or alternatively 10 ng linearized plasmid containing the 147 bp template; Taq polymerase buffer (New England Biolabs); 0.25 μM each primer (one with 5’-Cy3 dye); 200 μM each dNTP; and 1 μl (5 units) Taq polymerase (New England Biolabs). This mixture yields a little less dye-labeled PCR product per reaction volume than is possible with higher primer concentrations, (e.g. with 0.5–1 μM each primer) but more product per dye-labeled primer, which is often the cost-limiting reagent. Cycle conditions are 1 minute at 94 °C, 1 minute at 60 °C, 1 minute at 72 °C. The reactions are optimized by trial “cycle titrations” over the range of 12–20 cycles, typically giving an optimum around 15–17 cycles. If the results are not satisfactory, the 60 °C annealing step of the PCR cycle is adjusted slightly up or down. With these conditions, we expect 1.5 μg dye-labeled 147 bp PCR product per 100 μl reaction.
Following PCR synthesis, the dye labeled full length DNAs are purified by reverse-phase HPLC on a Zorbax column (Agilent), using a 10–15% (v/v) gradient of acetonitrille (ACN) in 0.1 M triethanolamine acetate (TEAA), pH 7.0, at a flow rate of 1ml/min over 20 minutes. We monitor absorbance at both 260 and 550 nm to detect DNA and Cy3 respectively. ACN is removed from pooled peak fractions using a SpeedVac (Savant), and the DNA exchanged into 0.1 x (v/v) TE buffer (TE is 10 mM Tris, pH 8.0, 1 mM EDTA) using Centricon 30 filters (Amicon). Concentrations of DNA and Cy3 are measured by UV-visible absorbance spectroscopy. We obtain DNAs with stoichiometries of 1 Cy3 per DNA, within (small) experimental error, implying complete labeling of the DNA.
2.4 Histones
Histones are expressed, purified, and refolded as described [11]. Histone octamers are refolded to a final concentration of 1mg/ml (~9 μM) in 0.5ml volume of 2 M NaCl, 20 mM HEPES, pH 7.3. Refolded histone octamers are reduced with 100-fold molar excess Bond-Breaker TCEP solution (Pierce) for 10 minutes at room temperature. Cy5 maleimide (Amersham Pharmacia Biotech) comes as aliquots to label 1mg of protein, and is dissolved in 50 μl dimethylformamide (DMF; Pierce) immediately before use as recommended. The maleimide dye is sensitive to photobleaching, so we take care to reduce light exposure by working in dimmed room light, and covering the tubes with aluminum foil. Additionally, maleimide dyes are minimally soluble in aqueous solutions, and are unstable in all solutions, and should be used within hours of dissolving in DMF. Half of the resulting dye stock solution is added slowly to the reduced histones, with mixing to reduce precipitation. The reaction is incubated for 2 hours at room temperature, then overnight at 4°C, with constant gentle mixing using a Labquake shaker. The reaction is quenched by addition of 100-fold molar excess 2-mercaptoethanol. Labeled histone octamer is stored in the quenched labeling reaction at 0°C until use. In practice, we find ~70–95% labeling efficiency of maleimide dye. We have not succeeded in purifying unlabeled histone H3 or histone octamer away from labeled. Any free dye is purified away during the extensive dialyses and the sucrose gradient ultracentrifugation step used in the nucleosome reconstitution and purification (see below); thus while excess dye is used in this histone labeling reaction, the final purified nucleosomes contain no detectable free dye.
2.5 LexA protein
LexA protein was prepared from expression plasmid pJWL228 (gift of J. Little, University of Arizona, Tucson) and purified to near-homogeneity as described [12].
2.6 Nucleosome Reconstitutions
Dye labeled 601 DNA is reconstituted into nucleosomes along with a 2.5-fold (w/w) excess of salmon sperm carrier DNA, at a total DNA to histone ratio of 2.2:1 (w/w), to increase the efficiency of nucleosome formation, similar to our previous work [13]. Reconstitution reactions are carried out in a final volume of 150 μl containing 43 μg salmon sperm carrier DNA, 17 μg specific Cy3-labeled DNA and 27 μg of Cy5-labeled histone octamer in TE, 2M NaCl, plus protease inhibitors (1 mM benzamidine hydrochloride, 0.5 mM phenylmethylsulfonyl fluoride (PMSF)). Donor-only constructs were prepared using unlabeled H3 V35C C110A histone octamer. All nucleosomes are reconstituted by double salt dialysis as described [14]. Any non-nucleosomal aggregates, and histones bound to the salmon sperm DNA, are purified away from FRET dye pair labeled nucleosomes through sucrose gradient ultracentrifugation as described [9].
Purified nucleosomes at typical stock concentrations of 100–500 nM are stored in 0.5 x TE at 0 °C. In contrast to nucleosomes prepared using 5S DNA templates and many others, nucleosomes reconstituted on 601 DNA are stable for at least several weeks as concentrated (100–500 nM) stock solutions at 0 °C. Moreover they remain stable for at least several hours at room temperature even after dilution to concentrations as low as 1 nM (in the work described here we use 7 nM final concentrations). In any case it is important to confirm that the nucleosomes remain intact at the time of any given experiment. Native gel electrophoresis or sucrose gradient ultracentrifugation are suitable for this task.
3. Setting up the experiment
3.1 Equilibrium accessibility
In order to know how to set up the kinetic experiment, one must first understand the equilibrium (steady state) behavior of the system to verify the direction and magnitude of any FRET changes that are then to be monitored over time by stopped flow. For our case involving nucleosome unwrapping coupled to LexA binding, this means that we need to first characterize the FRET changes occurring during equilibrium titrations with increasing LexA in solution. Using the FRET double-labeled nucleosomes, we measure steady state fluorescence emission spectra as LexA is titrated into solution. We excite the samples at 515 nm, which directly excites Cy3, but gives little direct excitation of Cy5; we then switch the excitation wavelength to 610 nm to directly excite the Cy5 with no excitation of Cy3. (This second measurement allows for an absolute measurement of FRET efficiency even when the degree of labeling by acceptor is less than 100%.) The emitted light first passes through a 550 nm colored glass cut on filter to eliminate any scattered excitation light, and then into the emission monochrometer. We scan the emission monochrometer from 525 to 750 nm, or 625 to 750 nm, (for 515 and 610 nm excitation respectively). Fig. 2B shows the results of a titration of 7 nM nucleosomes with 0 nM to 3 μM LexA. Fig. 2A shows a control experiment in which the nucleosomes were labeled with donor only, to verify that LexA binding did not significantly alter the color or quantum yield of the Cy3 donor. The absolute FRET efficiency during the titration is plotted in Fig. 2C. This representation of the data serves to define the isotherm for binding of LexA to nucleosomal DNA, while both this plot and the raw spectra themselves give the sign and magnitude of fluorescence changes to be expected upon LexA binding in the stopped-flow experiment.
Fig. 2.
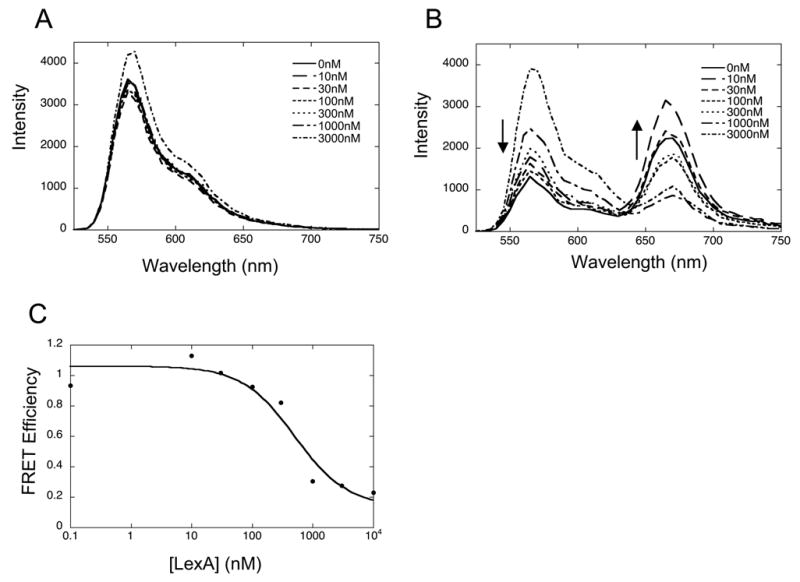
Steady state fluorescence analysis of LexA binding titrations. A. Donor only nucleosomes were titrated from 0 to 3 μM LexA. A small LexA-dependent increase in fluorescence intensity is detected at the highest LexA concentrations. B. FRET labeled nucleosomes exhibit a LexA concentration dependent decrease in sensitized acceptor fluorescence, and concomitant increase (de-quenching) of donor fluorescence. C. FRET efficiency as determined by the ratio A method [3, 4].
In fact, in some of the systems we have analyzed, there do occur significant changes in donor quantum yield (quenching or enhancement) that are not attributable to FRET, and are even observed in samples labeled with donor only. For example, binding of a protein to a dye-labeled DNA can frequently lead to increases or decreases in fluorescence emission. In that case, depending on the exact question being asked, one may not need to go to the trouble of doing the real FRET experiment, but may be able to determine key kinetic parameters in a simpler stopped-flow fluorescence intensity experiment.
3.2 Stopped-flow instrument
Our stopped-flow instrument is an Applied Photophysics model SX.18MV. The instrument can be thermostatted, but for simplicity we use it at room temperature (~23 ºC). LexA binding to nucleosomes is monitored by the resulting changes in FRET, following the decrease in sensitized emission from Cy5, and the concomitant increase (de-quenching) of Cy3 emission. The instrument is configured to excite the samples with a xenon lamp and an excitation monochrometer centered at 500 nm. The Cy3 and Cy5 fluorescence emission signals are measured using appropriate filter combinations to isolate the light from Cy3 only or Cy5 only, which then impinges on two photomultiplier tubes (PMT’s), one for each emission channel (Fig. 3). In some cases the sensitivity may be further improved by replacing the excitation monochrometer with an appropriate bandpass filter.
Fig. 3.
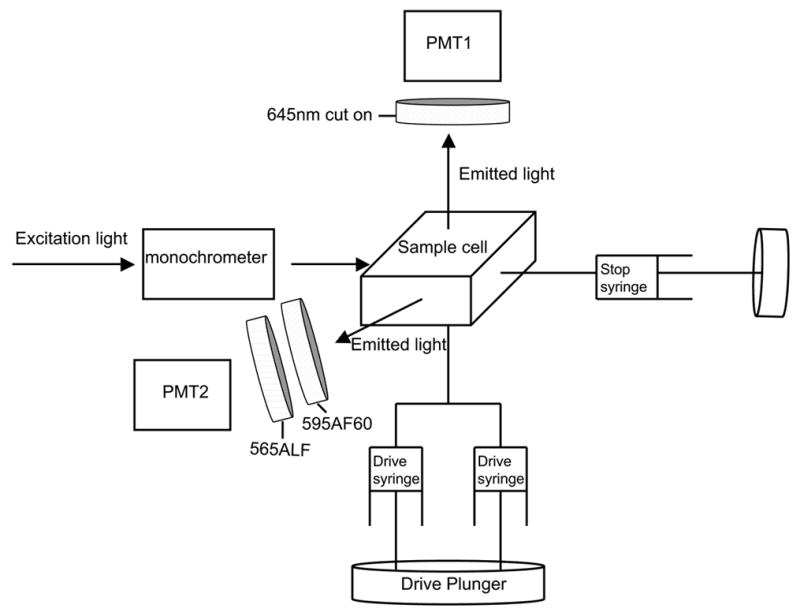
Schematic illustration of the stopped flow instrument, as set up for simultaneous recording of Cy3 and Cy5 fluorescence intensities in photomultiplier tube (PMT) 2 and 1, respectively.
3.3 Filters
It is necessary to choose filters that are capable of isolating the light emitted by the two fluorescent dyes from each other and from scattered and Raman-shifted excitation light. Otherwise, at the nM concentrations of many biochemical experiments, including ours on nucleosomes, scattered or Raman-shifted excitation light can completely overwhelm the fluorescence emission, leading to highly misleading apparent results. Scattered excitation light is centered at the same color as the excitation light itself. Unless a laser source is used, the excitation light will ordinarily have some significant spectral width, e.g., from an 8 or 16 nm bandpass in the excitation monochrometer, with significant spectral power extending out to many times this bandpass. In contrast, Raman-shifted excitation light is shifted toward the red by a constant amount of energy (the first vibrational level of the solvent), which equates to a variable number of nm shift depending on the excitation wavelength.
One must therefore choose the excitation wavelength and bandpass, and the emission filter combinations, intentionally retaining as much of the emission intensity as possible, while adequately suppressing the signals from scattered and Raman-shifted light. To measure how well this has been accomplished, one need only measure the emission signals from buffer in the absence and presence of fluorescent sample.
In our previous stopped-flow FRET experiments we analyzed emission from Cy5 only. We excited the Cy3 donor using an excitation monochrometer set at 515 nm, and collected light emitted from the Cy5 acceptor, while eliminating most Cy3 emission, and scattered and Raman-shifted excitation light, using a 645 nm cut-on (long pass) colored glass filter [7]. This setup works well, but it would be desirable to detect changes in Cy3 fluorescence at the same time. This requires a second emission channel, with a bandpass filter set chosen to pass the majority of Cy3 fluorescence, while not overlapping with either the scattered or shifted excitation light, or with Cy5 emission. For this purpose we are at present using a combination of an Omega Optical 565ALP cut-on filter and a 595AF60 bandpass filter (Fig. 3). The bandpass filter on its own effectively isolates Cy3 emission from Cy5, but allows too much scattered excitation light through. The additional cut-on filter helps to reduce this otherwise problematic non-fluorescence background (Fig. 4A). For an excitation wavelength of 500 nm, the peak of Raman-shifted light occurs at 610 nm. This falls within the bandpass region of our Cy3 emission filter, but accounts for less than 1% of the light that enters the PMT (Fig. 4B).
Fig. 4.
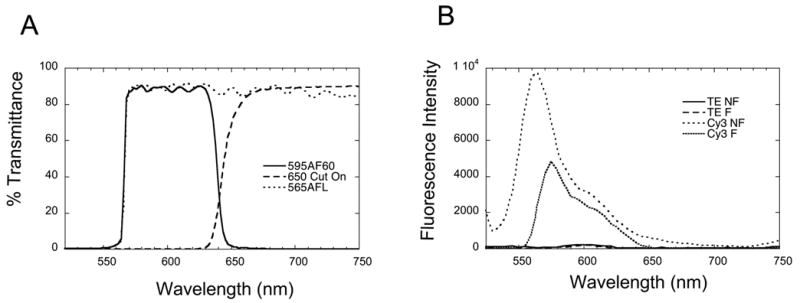
Transmission and emission spectra. A. Transmission spectra of the optical filters used for stopped-flow analysis of Cy3 and Cy5 fluorescence. Cy3 emission is isolated by a combination of 565AFL and 595AF60 filters, while Cy5 emission is isolated with a 645 nm cut-on filter. B. Steady state emission spectra recorded by a conventional fluorometer of TE buffer only, or of buffer + 7 nM Cy3 147 bp DNA, in the absence (no filter, NF) or presence (with filters, F) of the filters used in the stopped flow experiment. Note the increased emission intensity at the shortest wavelengths in the Cy3 147 bp DNA sample when filters are not used. This is the tail of the direct excitation light scattered by the sample, which degrades the signal to noise ratio. It is effectively eliminated by the filters used.
Even with these precautions, we observe a substantial background of stray excitation light in the Cy3 channel. This (time-independent) background has to be subtracted off, which leaves the remaining (time-dependent) fluorescence signal quite noisy, at nM concentrations of Cy3-labeled molecules. We continue to use the colored glass 645 nm cut on filter for Cy5 light, which provides a high signal to noise ratio even at nM concentrations.
3.4 Software
There are several important considerations when setting the software parameters for the instrument. First, if the timescale for change is unknown prior to the experiment, one needs to sample over a wide range of time. Additionally, some samples may exhibit multiphasic changes in fluorescence, in which case data must be collected over distinct time scales simultaneously. Our instrument provides both a linear and a logarithmic timebase; the latter allows one to collect rapid time points at short times, capturing any rapid processes, while still allowing longer times to be appropriately sampled in the same run. If there is only one rate, or if two rates are not widely separate, it suffices and may be better to use linear time sampling. Once one knows the timescale of the most-rapid process in the system, the signal to noise ratio may be significantly enhanced by electronic integration prior to digitization. In our studies of nucleosomes, we find that the fastest timescale in the system is of order 250 msec; we therefore set an integration time of 20 msec, which negligibly distorts the measured kinetics while greatly enhancing the signal to noise ratio compared to a 1 msec integration time. In this way, it is possible to accurately measure both the long and short timescales of FRET change.
3.5 Sample concentrations and volumes
Modern instruments are extraordinarily sensitive. In our experiments we routinely use sample concentrations as low as 7 nM final concentration of nucleosomes. We set the instrument up to mix samples 1:1 (v/v) in the sample/detection chamber, thus we prepare 2x stock solutions of LexA and of nucleosomes. When one requires measurement of Cy5 only, even lower concentrations suffice (M.G. Poirier and J.W., in preparation). We set the final LexA concentration so as to place us roughly in the middle of the binding titration (Fig. 2C). Higher concentrations give larger FRET changes, and thus more robust signals, but also showed signs of causing aggregation [4], which we wish to avoid. The volume of the reaction chamber is 20 μl (10x2x1mm), and each successive mixing reaction requires at least 77 μl of sample. Use of larger “push volumes” (volumes used per reaction) shortens the dead time, and may be required for analysis of the fastest accessible reactions (i.e., for processes occurring on a ~1–10 msec timescale). Overall in our studies of nucleosomes (which do not require the fastest possible mix times), we expect to use ~1–2 ml of sample at the stock (2x) concentration for any one series of experiments (comprising typically 5–10 individual mixes) on one sample.
3.6 Data collection
Representative raw data from our recent studies on nucleosomes are shown in Fig. 5A,B. Samples were rapidly mixed to a final concentration of 7 nM nucleosomes, with 0 nM, 200 nM, 400 nM, 1 μM, or 3 μM LexA in 0.5x TE buffer. We collected 1000 datapoints linearly spaced in time over 10 seconds, with a 20 msec integration time. Two channels were set to collect data simultaneously, one for Cy3 fluorescence, and the other for Cy5 fluorescence. With this setup, the Cy5 traces have very good signal to noise ratio despite the very low nucleosome concentrations. The Cy3 traces are usable but noisy with a 20msec sliding window binning, thus we further binned data to a final 100msec sliding window filter, which does not significantly change the fit parameters.
Fig. 5.
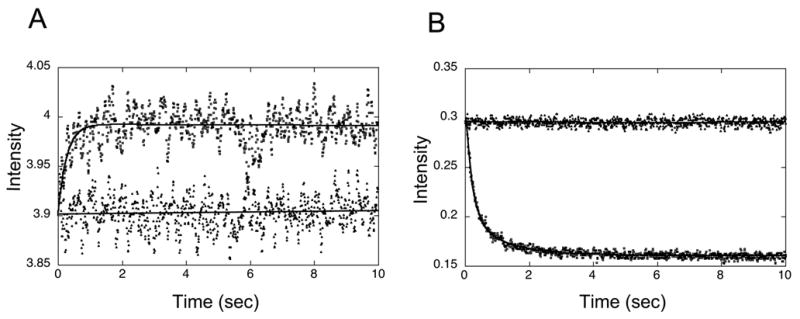
Raw stopped-flow FRET data. 7 nM FRET-labeled nucleosomes were rapidly mixed 1:1 (v/v) with buffer (0.5 x TE) only, or with 2 μM LexA protein (1 μM final concentration) in buffer, and fluorescence intensity in the Cy3 and Cy5 channels was monitored for 10 seconds with 1000 linearly spaced timepoints. A. Cy3 fluorescence data are noisy, and therefore were replaced by a moving average over 5 adjacent points to reduce the noise. Traces from rapid mixing with 0.5 x TE (▲) or 1 μM LexA ( ) were fit to linear or double exponential curves respectively (solid line). B. Cy5 fluorescence measured simultaneously with the Cy3 channels of panel (A). Traces for the buffer only (▲) or 1 μM (final concentration) LexA ( ) were fit to linear or double exponential curves (solid lines), respectively.
3.7 Data Analysis
The basic principles of data analysis from stopped-flow experiments are analogous to those of any other kinetic experiment. In our case the mechanism itself suggests that the kinetics should obey a single exponential. Behavior that is idiosyncratic to a particular system may complicate the real observed kinetics. For example, we find that for nucleosomes, site specific binding of a single LexA to a nucleosomal target site may be followed by additional cooperative nonspecific binding, seeded off the specific site, that occurs more slowly and is accompanied by an increased FRET change, perhaps due to concomitant increased DNA unwrapping [4]. Two exponentials, minimally, are required to describe such a system. We use Kalidagraph software for single or multi-exponential fitting. Global analyses over many different conditions simultaneously using software such as Origin may yield more robust determinations of parameters when the kinetic mechanism is complex. These are specialized topics that are appropriately treated elsewhere [15].
One detail bears particular mention. A usual goal of stopped-flow experiments is to analyze kinetics over a range of timescales, including times that are as short as physically possible. Thus, it is of special interest to consider whether the kinetics that are recorded during a stopped-flow experiment have captured the entire kinetic history of a reaction, or whether it is possible that there occurred some additional process, on a far faster timescale, that is simply missed in the analysis because it has gone to completion by the first few milliseconds, which is the deadtime of the stopped-flow experiment.
This question can be answered by carrying out a second stopped-flow mixing experiment for a mock reaction instead of the real reaction. Thus, for example, for the case of nucleosomes we repeat the experiment except, instead of mixing in buffer plus LexA protein, we add buffer only. The FRET signal from the real experiment includes any changes due to the kinetics, superimposed on changes due simply to dilution. The mock reaction measures the changes due only to dilution. Then, if (as in Fig. 5) one finds that the processes measured in the real experiment, extrapolate back to zero time (with the fitted single or multi-exponential function), to the same numerical value as obtained in the pure dilution experiment, then this proves that there exists no additional process on any faster timescale contributing a significant FRET change.
4. Conclusions
The stopped-flow FRET experiment is a powerful and versatile tool with which to elucidate rates and detailed conformational changes as they occur in biological macromolecular complexes and machines. This approach is ideally suited for analysis of intrinsic properties of chromatin and of the machines that control chromatin assembly, disassembly, and function.
Footnotes
Publisher's Disclaimer: This is a PDF file of an unedited manuscript that has been accepted for publication. As a service to our customers we are providing this early version of the manuscript. The manuscript will undergo copyediting, typesetting, and review of the resulting proof before it is published in its final citable form. Please note that during the production process errors may be discovered which could affect the content, and all legal disclaimers that apply to the journal pertain.
References
- 1.Miller JA, Widom J. Collaborative Competition Mechanism for Gene Activation In Vivo. Mol Cell Biol. 2003;23:1623–1632. doi: 10.1128/MCB.23.5.1623-1632.2003. [DOI] [PMC free article] [PubMed] [Google Scholar]
- 2.Bucceri A, Kapitza K, Thoma F. Rapid accessibility of nucleosomal DNA in yeast on a second time scale. Embo J. 2006;25(13):3123–3132. doi: 10.1038/sj.emboj.7601196. [DOI] [PMC free article] [PubMed] [Google Scholar]
- 3.Clegg RM. Fluorescence Resonance Energy Transfer and Nucleic Acids. Meth Enzymol. 1992;211:353–388. doi: 10.1016/0076-6879(92)11020-j. [DOI] [PubMed] [Google Scholar]
- 4.Li G, Widom J. Nucleosomes facilitate their own invasion. Nat Struct Mol Biol. 2004;11(8):763–769. doi: 10.1038/nsmb801. [DOI] [PubMed] [Google Scholar]
- 5.Park YJ, Dyer PN, Tremethick DJ, Luger K. A new fluorescence resonance energy transfer approach demonstrates that the histone variant H2AZ stabilizes the histone octamer within the nucleosome. J Biol Chem. 2004;279(23):24274–24282. doi: 10.1074/jbc.M313152200. [DOI] [PubMed] [Google Scholar]
- 6.White CL, Luger K. Defined structural changes occur in a nucleosome upon Amt1 transcription factor binding. J Mol Biol. 2004;342(5):1391–1402. doi: 10.1016/j.jmb.2004.07.080. [DOI] [PubMed] [Google Scholar]
- 7.Li G, Levitus M, Bustamante C, Widom J. Rapid spontaneous accessibility of nucleosomal DNA. Nat Struct Mol Biol. 2005;12:46–53. doi: 10.1038/nsmb869. [DOI] [PubMed] [Google Scholar]
- 8.Yang JG, Madrid TS, Sevastopoulos E, Narlikar GJ. The chromatin-remodeling enzyme ACF is an ATP-dependent DNA length sensor that regulates nucleosome spacing. Nat Struct Mol Biol. 2006 doi: 10.1038/nsmb1170. [DOI] [PubMed] [Google Scholar]
- 9.Lowary PT, Widom J. New DNA Sequence Rules for High Affinity Binding to Histone Octamer and Sequence-Directed Nucleosome Positioning. J Mol Biol. 1998;276:19–42. doi: 10.1006/jmbi.1997.1494. [DOI] [PubMed] [Google Scholar]
- 10.Thåström A, Bingham LM, Widom J. Nucleosomal Locations of Dominant DNA Sequence Motifs for Histone-DNA Interactions and Nucleosome Positioning. J Mol Biol. 2004;338:695–709. doi: 10.1016/j.jmb.2004.03.032. [DOI] [PubMed] [Google Scholar]
- 11.Luger K, Rechsteiner TJ, Richmond TJ. Preparation of nucleosome core particle from recombinant histones. Methods Enzymol. 1999;304:3–19. doi: 10.1016/s0076-6879(99)04003-3. [DOI] [PubMed] [Google Scholar]
- 12.Little JW, Kim B, Roland KL, Smith MH, Lin LL, Slilaty SN. Cleavage of LexA repressor. Methods Enzymol. 1994;244:266–284. doi: 10.1016/0076-6879(94)44022-0. [DOI] [PubMed] [Google Scholar]
- 13.Polach KJ, Widom J. Mechanism of Protein Access to Specific DNA Sequences in Chromatin: A Dynamic Equilibrium Model for Gene Regulation. J Mol Biol. 1995;254:130–149. doi: 10.1006/jmbi.1995.0606. [DOI] [PubMed] [Google Scholar]
- 14.Thåström A, Lowary PT, Widom J. Measurement of Histone-DNA Interaction Free Energy in Nucleosomes. Methods. 2004 doi: 10.1016/j.ymeth.2003.10.018. in press. [DOI] [PubMed] [Google Scholar]
- 15.Rachofsky EL, Laws WR. Kinetic models and data analysis methods for fluorescence anisotropy decay. Methods Enzymol. 2000;321:216–238. doi: 10.1016/s0076-6879(00)21196-8. [DOI] [PubMed] [Google Scholar]
- 16.Luger K, Mader AW, Richmond RK, Sargent DF, Richmond TJ. Crystal structure of the nucleosome core particle at 2.8Å resolution. Nature. 1997;389(6648):251–260. doi: 10.1038/38444. [DOI] [PubMed] [Google Scholar]