

Introduction and Summary
Currently, radiographs are the standard used to diagnose and chronicle the progression of osteoarthritis (OA); however, this current methodology lacks strong predictive abilities1. As such, the search for OA-specific biomarkers has gained much momentum. These biomarkers, once validated, could become invaluable diagnosis and disease-tracking tools for OA. Due to the number of factors that influence biomarker concentration in humans, animal models of OA, such as the Hartley guinea pig2–4, are important in that they provide a less complex system in which to validate and assess the utility of the biological markers of disease. In the current study, the levels of 18 cytokines were measured in Hartley guinea pig serum at time points ranging from 3 weeks to 18 months of age. These levels were then tested for any correlation with total histology. After all cytokines demonstrating a significant association with weight or age were excluded, IL-6 (p=0.016) and G-CSF (p=0.024) were found to correlate positively with total histological score. Models involving each of these cytokines paired independently with weight explained 43–44% of the variance in total histology.
Methods, results, and discussion
Forty six male Hartley guinea pigs were obtained from Charles River Laboratories and sacrificed at 3 weeks, 2, 4, 7, 10, 12 (N=6 per group), and 18 months (N=10) of age, at which time blood samples were obtained. Animals were kept in solid-bottom cages, and were given unlimited access to water. They were fed standard guinea pig chow (Purina Lab Diet 5024) containing Vitamin C (1 mg/g) and Vitamin D3 (3.4 IU/g). All procedures were pre-approved by the Institutional Animal Care and Use Committee.
Histological severity of knee OA was determined using a semi-quantitative grading scheme described previously4, which assessed cartilage structure abnormalities and proteoglycan loss. In accordance with that protocol, the sum of these two types of damage was computed for the tibial and femoral condyles for the medial compartment and the lateral compartment. Hence, the possible total score for each compartment ranged from 0 (normal) to 28 (severe structural damage and complete loss of toluidine blue staining), while the whole joint score for histology ranged from 0 to 56.
The following cytokines and chemokines in the serum were measured using the Bio-Plex Protein Array System (Bio-Rad, Hercules, CA) with the Bio-Plex Mouse cytokine 18-Plex Panel: IL-1α, IL-1β, IL-2, IL-3, IL-4, IL-5, IL-6, KC (a murine IL-8 homologue), IL-10, IL-12p40, IL-12p70, IL-17, granulocyte macrophage colony-stimulating factor (GM-CSF), granulocyte colony-stimulating factor (G-CSF), interferon gamma (IFN-γ), macrophage inflammation protein 1 alpha (MIP-1α), RANTES (regulated upon activation, normal T-cell expressed and secreted), and tumor necrosis factor alpha (TNF-α). All samples were analyzed as recommended by the manufacturer using a standard range of 0–3200 pg/mL and a sample dilution of 1:2; utilizing a total of 30 μL of sera.
Cytokine concentrations were log transformed to meet assumptions of normalcy. To differentiate OA-related from purely age-related effects, only the serum concentrations (pg/mL) of cytokines previously shown to significantly differ between age-matched animals (OA-prone Hartley and OA-resistant Strain 13)5 were evaluated for correlations with total histology. Similarly, all cytokines significantly associated with weight were discarded. The data were examined for correlations with total joint histological score using JMP Discovery software. Type I error was controlled using Holm step-down P values6. Afterwards, multiple-linear regression analyses were performed, and the resultant models were scrutinized.
Despite the Bio-Plex kits being designed for use in mice, measurable levels were obtained for 16 of the 18 cytokines tested. IL-1α and IL-4 levels were below the detection limit for the assay. Histological OA presented at 4 months and significantly worsened through 18 months. All 16 measurable cytokines followed similar bimodal distribution patterns characterized by a first peak occurring at 2 months of age, a nadir at 7 months of age, and a significant increase from 7 to 18 months of age (Figure 1). The 7–18 month increase corresponded to the period of histological OA development in this model system. The high serum concentrations at 2 months of age are likely associated with growth and development as opposed to pathogenesis, as cytokine levels have been shown to be elevated during childhood in healthy humans7; however, this association with growth cannot account for the later increase from 7 to 18 months of age since long bone growth ceases by approximately 4 months of age.8
Figure 1.
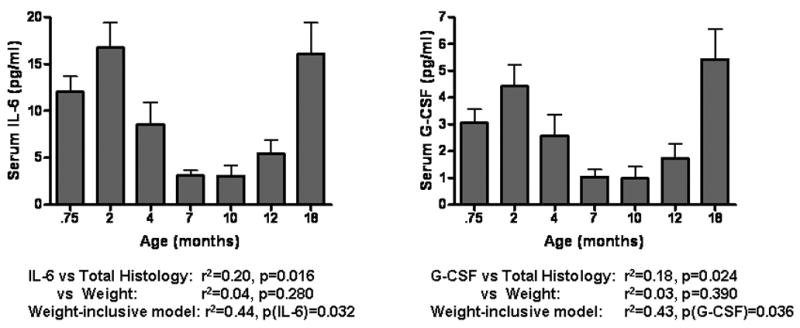
IL-6 and G-CSF serum concentrations over the entire experimental period. Note that all reported statistics refer to only the 7–18 month time period. Neither cytokine serum concentration associated significantly with weight. The p-values reported for the weight-inclusive models show that IL-6 and G-CSF significantly contribute to the models' prediction of total histology.
Of the 16 measurable cytokines, 12 were shown previously to significantly differ between age-matched Hartley and Strain 13 guinea pigs: IL-2, IL-3, IL-5, IL-6, KC, IL-12p40, IL-12p70, IL-17, GM-CSF, G-CSF, MIP-1α, and RANTES. Among these twelve cytokines, seven showed a positive, linear association with total histological severity: IL-6(p=0.016), G-CSF(p=0.024), IL-2(p=0.032), IL-12p70(p=0.036), IL-5(p=0.042), GM-CSF(p=0.044), and IL-17(p=0.047). Upon linear regression, none of the 7 demonstrating a correlation with total histology showed evidence of a significant association with weight. After correcting for multiple comparisons, two correlations remained significant (IL-6 and G-CSF) and were evaluated further with multiple linear regressions. The two resultant models pairing G-CSF and IL-6 independently with weight explained respectively 43% and 44% of the variance in total histology from 7 through 18 months of age, up from the respective 18% and 20% variance explained when weight was excluded. In contrast, weight alone explained 31% of the variance in total histology (p=0.002). Each of the two cytokines showed a significant p-value in their weight-paired models (p= 0.032 for IL-6, p=0.036 for G-CSF) though weight remained more significant in both models with a P-value of 0.004. A model utilizing the serum concentrations of both of these cytokines did not exhibit improved predictive ability.
Though the same general pattern is observed for all 16 measurable cytokines, a number of important inferences can be made (Table 1). Only one cytokine, IFN- γ, showed no difference between strains as well as no significant correlation with either weight or histology. Thus, the second rise in IFN- γ can be attributed solely to its relationship with age. Conversely, IL-1β, TNF-α, and IL-10 showed no variation between strains, yet still correlated positively with either weight (p[IL-10]=0.048) or total histological score (p[IL-1β]=0.011, p[TNF-α]=0.023). In the case of these three, more data would be necessary before attributing their pattern of variance to a primary source; however, it is likely that total histology and age (with the addition of weight in the case of IL-10) all contributed to the observed variance in serum concentration. Without being able to rule out the influence of age in these three cytokines through strain-to-strain comparison, the influence of age (and weight in the case of IL-10) is an unavoidable confound because age and weight correlate positively with total histology over the 7–18 month time period in question. For those cytokines that did not show a positive correlation with total histology or weight (IL-8, RANTES, IL-3, MIP-1α, and IL-12p40) the differences in cytokine serum concentrations between age-matched animals of the two strains (Hartley and Strain 13) can be reasonably attributed to previously uncharacterized strain variation.
Table 1.
Legend: Correlations between total histological score and tested cytokines in the Hartley guinea pig. Results are organized by likely association and statistical significance.
| Variation Between Hartley and Strain 13 Serum Concentrations | Association with Total Histology [r^2, p] | Likely Cause of Variation in Serum Concentrations |
|---|---|---|
| Significant | ||
| IL-6 | 0.20, 0.016* | OA |
| G-CSF | 0.18, 0.024* | OA |
| IL-2 | 0.16, 0.032 | OA |
| IL-12p70 | 0.17, 0.036 | OA |
| IL-5 | 0.15, 0.042 | OA |
| GM-CSF | 0.17, 0.044 | OA |
| IL-17 | 0.16, 0.047 | OA |
| IL-3 | 0.13, 0.068 | Strain Related Variation |
| IL-8 | 0.09, 0.137 | Strain Related Variation |
| MIP-1α | 0.08, 0.150 | Strain Related Variation |
| IL-12p40 | 0.09, 0.150 | Strain Related Variation |
| RANTES | 0.05, 0.270 | Strain Related Variation |
| Not Significant | ||
| IL-1β | 0.23, 0.011 | Age/OA |
| TNF-α | 0.18, 0.023 | Age/OA |
| IL-10† | 0.20, 0.031 | Weight, Age/OA |
| IFN-γ | 0.09, 0.150 | Age |
Significant according to Holm step-down p-values.
Displayed a significant correlation with Weight [0.17, 0.047]
In conclusion, only the age and weight-independent associations of IL-6 and G-CSF with histological OA were significant under the conditions imposed by the Holm step-down adjustment. Though the observed changes of these cytokine levels may be due to a correlation with age, it is highly unlikely given the significant difference between Hartley and Strain 13 age-matched cohorts.
It is encouraging that IL-6 correlated positively with total histological score because IL-6 has been shown to use trans-signaling to regulate pre-B cell colony-enhancing factor (PBEF), which is involved in the progression of OA9. Additionally, it has been reported that synovial fluid levels of IL-6 are associated with synovitis10. IL-6 is also linked to OA pathology via bone erosion, in that IL -6 triggers osteoclast development in the presence of the soluble IL-6 receptor11. Paradoxically, both pro-and anti-inflammatory properties have been ascribed to IL-612. In an experiment not measuring OA, IL-6 deficient C57 black mice have been shown to develop mature-onset obesity13 thought to be due to the loss of a central nervous system (CNS) anti-obesity effect of IL-614. On the one hand, IL-6 deficiency in IL-6 knockout (IL-6−/−) mice is associated with milder synovitis12, suggesting that IL-6 encourages joint inflammation. In contrast, IL-6−/− male mice develop significantly more severe spontaneous OA with aging15, pointing towards a protective role for IL-6; however, this study did not record mouse weight, which, if increased due to deficiency of IL-6 in the CNS, could explain these paradoxical findings. Thus, IL-6 potentially has a dual role in OA pathology inclusive of both its positive correlation with total histological score9–11 reinforced in the current study, and its apparent protective effect12 possibly mediated through weight regulation. In rat chondrocytes, G-CSF had been shown to increase production of nitric oxide16, a known OA-related inflammatory mediator17. In light of these data, further investigation into the specific mechanisms of the OA-related effects of G-CSF and IL-6 is warranted in the context of human osteoarthritis.
Acknowledgments
We would like to thank Dr. Kim Huffman for helpful discussions regarding statistical analysis.
Footnotes
Supported by the following funding sources: NIH/NIAMS grant P01 AR50245 and NIH/NIA Claude D. Pepper OAIC 2P60 AG11268
Publisher's Disclaimer: This is a PDF file of an unedited manuscript that has been accepted for publication. As a service to our customers we are providing this early version of the manuscript. The manuscript will undergo copyediting, typesetting, and review of the resulting proof before it is published in its final citable form. Please note that during the production process errors may be discovered which could affect the content, and all legal disclaimers that apply to the journal pertain.
References
- 1.Cibere J. Do we need radiographs to diagnose osteoarthritis? Best Pract Res Clin Rheumatol. 2006;20:27–38. doi: 10.1016/j.berh.2005.08.001. [DOI] [PubMed] [Google Scholar]
- 2.Bendele AM, White SL, Hulman JF. Osteoarthrosis in guinea pigs: histopathologic and scanning electron microscopic features. Lab Anim Sci. 1989;39:115–121. [PubMed] [Google Scholar]
- 3.Watson PJ, Hall LD, Malcolm A, Tyler JA. Degenerative joint disease in the guinea pig. Use of magnetic resonance imaging to monitor progression of bone pathology. Arthritis Rheum. 1996;39:1327–1337. doi: 10.1002/art.1780390810. [DOI] [PubMed] [Google Scholar]
- 4.Huebner JL, Hanes MA, Beekman B, TeKoppele JM, Kraus VB. A comparative analysis of bone and cartilage metabolism in two strains of guinea-pig with varying degrees of naturally occurring osteoarthritis. Osteoarthritis Cartilage. 2002;10:758–767. doi: 10.1053/joca.2002.0821. [DOI] [PubMed] [Google Scholar]
- 5.Huebner JL, Kraus VB. Assessment of the utility of biomarkers of osteoarthritis in the guinea pig. Osteoarthritis Cartilage. 2006;14:923–930. doi: 10.1016/j.joca.2006.03.007. [DOI] [PubMed] [Google Scholar]
- 6.Holm S. A simple sequentially rejective multiple test procedure. Scand J Stat. 1979;6:65–70. [Google Scholar]
- 7.Hoffmann F, Albert MH, Arenz S, Bidlingmaier C, Berkowicz N, Sedlaczek S, et al. Intracellular T-cell cytokine levels are age-dependent in healthy children and adults. Eur Cytokine Netw. 2005;16:283–288. [PubMed] [Google Scholar]
- 8.Zuck TT. Age order of epiphyseal union in the guinea pig. The Anatomical Record. 1938;70:389–399. [Google Scholar]
- 9.Nowell MA, Richards PJ, Fielding CA, Ognjanovic S, Topley N, Williams AS, et al. Regulation of pre-B cell colony-enhancing factor by STAT-3-dependent interleukin-6 trans-signaling: Implications in the pathogenesis of rheumatoid arthritis. Arthritis Rheum. 2006;54:2084–2095. doi: 10.1002/art.21942. [DOI] [PubMed] [Google Scholar]
- 10.Nishimura M, Segami N, Kaneyama K, Suzuki T, Miyamaru M. Proinflammatory cytokines and arthroscopic findings of patients with internal derangement and osteoarthritis of the temporomandibular joint. Br J Oral Maxillofac Surg. 2002;40:68–71. doi: 10.1054/bjom.2001.0742. [DOI] [PubMed] [Google Scholar]
- 11.Tamura T, Udagawa N, Takahashi N, Miyaura C, Tanaka S, Yamada Y, et al. Soluble interleukin-6 receptor triggers osteoclast formation by interleukin 6. Proc Natl Acad Sci U S A. 1993;90:11924–11928. doi: 10.1073/pnas.90.24.11924. [DOI] [PMC free article] [PubMed] [Google Scholar]
- 12.de Hooge AS, van De Loo FA, Arntz OJ, van Den Berg WB. Involvement of IL-6, apart from its role in immunity, in mediating a chronic response during experimental arthritis. Am J Pathol. 2000;157:2081–2091. doi: 10.1016/S0002-9440(10)64846-8. [DOI] [PMC free article] [PubMed] [Google Scholar]
- 13.Wallenius V, Wallenius K, Ahren B, Rudling M, Carlsten H, Dickson SL, et al. Interleukin-6-deficient mice develop mature-onset obesity. Nat Med. 2002;8:75–79. doi: 10.1038/nm0102-75. [DOI] [PubMed] [Google Scholar]
- 14.Wallenius K, Wallenius V, Sunter D, Dickson SL, Jansson JO. Intracerebroventricular interleukin-6 treatment decreases body fat in rats. Biochem Biophys Res Commun. 2002;293:560–565. doi: 10.1016/S0006-291X(02)00230-9. [DOI] [PubMed] [Google Scholar]
- 15.de Hooge AS, van de Loo FA, Bennink MB, Arntz OJ, de Hooge P, van den Berg WB. Male IL-6 gene knock out mice developed more advanced osteoarthritis upon aging. Osteoarthritis Cartilage. 2005;13:66–73. doi: 10.1016/j.joca.2004.09.011. [DOI] [PubMed] [Google Scholar]
- 16.Stephan S, Purcell WM, Chander CL. Colony stimulating factors regulate nitric oxide and prostaglandin E2 production in rat cartilage chondrocytes. Int J Tissue React. 1999;21:113–119. [PubMed] [Google Scholar]
- 17.Wang SJ, Guo X, Ren FL, Zhang YG, Zhang ZT, Zhang FJ, et al. Comparison of apoptosis of articular chondrocytes in the pathogenesis of Kashin-beck disease and primary osteoarthritis. Zhongguo Yi Xue Ke Xue Yuan Xue Bao. 2006;28:267–270. [PubMed] [Google Scholar]