

Abstract
BACKGROUND
Gene expression profiling of prostate carcinoma offers an alternative means to distinguish aggressive tumor biology and may improve the accuracy of outcome prediction for patients with prostate carcinoma treated by radical prostatectomy.
METHODS
Gene expression differences between 37 recurrent and 42 nonrecurrent primary prostate tumor specimens were analyzed by oligonucleotide microarrays. Two logistic regression modeling approaches were used to predict prostate carcinoma recurrence after radical prostatectomy. One approach was based exclusively on gene expression differences between the two classes. The second approach integrated prognostic gene variables with a validated postoperative predictive model based on standard variables (nomogram). The predictive accuracy of these modeling approaches was evaluated by leave-one-out cross-validation (LOOCV) and compared with the nomogram.
RESULTS
The modeling approach using gene variables alone accurately classified 59 (75%) tissue samples in LOOCV, a classification rate substantially higher than expected by chance. However, this predictive accuracy was inferior to the nomogram (concordance index, 0.75 vs. 0.84, P = 0.01). Models combining clinical and gene variables accurately classified 70 (89%) tissue samples and the predictive accuracy using this approach (concordance index, 0.89) was superior to the nomogram (P = 0.009) and models based on gene variables alone (P < 0.001). Importantly, the combined approach provided a marked improvement for patients whose nomogram-predicted likelihood of disease recurrence was in the indeterminate range (7-year disease progression-free probability, 30–70%; concordance index, 0.83 vs. 0.59, P = 0.01).
CONCLUSIONS
Integration of gene expression signatures and clinical variables produced predictive models for prostate carcinoma recurrence that perform significantly better than those based on either clinical variables or gene expression information alone.
Keywords: prostatic neoplasms/pathology/surgery, prostatectomy, gene expression profiling, treatment outcome, logistic models
Of the patients who undergo radical prostatectomy (RP) for the treatment of clinically localized prostate carcinoma, 25–40% will experience disease recurrence, manifested initially as an increasing level of prostate-specific antigen (PSA).1,2 An estimated 65% of these men will develop clinical metastases within 10 years in the absence of salvage therapy.3 There is currently no evidence that patients who develop metastatic prostate carcinoma can be cured with existing systemic therapies. However, adjuvant systemic or local therapy after RP may potentially benefit patients at risk for meta-static disease progression.
Rational application of adjuvant therapy requires accurate risk stratification models for disease recurrence. Several models have been developed based on pathologic stage, tumor grade, and PSA level to predict biochemical recurrence after RP.4–6 A postoperative nomogram was developed on 996 men treated by RP at Baylor College of Medicine (Houston, TX) between 1983 and 1997.4 It predicts the 7-year disease progression-free probability (PFP) after RP (on a continuous scale from 1% to 99%) based on serum PSA level, Gleason grade, margin status, and pathologic stage and was validated on an international cohort of 2465 patients with a concordance index (c-index) of 0.8.7 Although the nomogram is well calibrated and discriminating, the anticipated outcome for patients with predictions in the middle range (7-year PFP, 30–70%) is uncertain as the prediction is no more accurate than a coin toss. Furthermore, the c-index of the nomogram (0.8) indicates that it performs slightly better than mid-way between a model with perfect discrimination (1.0) and one with no discriminating ability (0.5).
Molecular markers offer an alternative means to determine tumor aggressiveness and may enhance the ability to predict biochemical recurrence. Several biomarkers have been demonstrated to be statistically significant predictors of prostate carcinoma progression in multivariable models that have included standard clinicopathologic variables.8–11 However, no biomarker has yet been shown to outperform or enhance the predictive accuracy of validated prognostic models based on clinical variables.
High-throughput gene expression profiling of prostate carcinoma has the potential to identify prognostic genes in an unbiased manner and several studies have identified profiles associated with a neoplastic and metastatic phenotype.8,12–16 We used oligonucleotide microarrays to identify expression profiles of prostate carcinoma associated with disease recurrence after RP and to determine if these molecular signatures can improve the accuracy of outcome prediction.
MATERIALS AND METHODS
Tissue Samples
Tissue samples were obtained from 79 patients with clinically localized prostate carcinoma treated by RP alone at Memorial Sloan-Kettering Cancer Center (MSKCC; New York, NY) between 1993 and 1999 (Table 1). Thirty-seven tissue samples from patients with 3 consecutive PSA increases > 0.1 ng/mL were classified as recurrent disease. Two of these patients have subsequently died of prostate carcinoma, 4 others developed clinical metastases, 4 progressed after salvage radiotherapy, 3 received long-term androgen-deprivation therapy, and 13 had a postrecurrence PSA doubling time < 10 months. Forty-two tissue samples from patients with an undetectable PSA level for ≥ 5 years (range, 60–108 months) were classified as non-recurrent controls. As determined by the range of postoperative nomogram predictions, the patients in our cohort represented a broad spectrum of disease severity (Fig. 1).
TABLE 1.
Baseline Patient Clinicopathologic Characteristics
| Characteristics | Recurrent patients (n = 37) (%) | Nonrecurrent patients (n = 42) (%) | P value |
|---|---|---|---|
| Mean age (yrs) (range) | 62.5 (50–73) | 59.2 (45–69) | 0.054 |
| Median PSA level (ng/mL) (range) | 9.7 (1.8–62) | 6.9 (1.5–29) | 0.08 |
| Prostatectomy Gleason sum | 0.003 | ||
| 4–6 | 3 (8) | 14 (33) | |
| 7 | 21 (57) | 24 (57) | |
| 8–10 | 13 (35) | 4 (10) | |
| Extracapsular extension | 29 (78) | 15 (36) | <0.001 |
| Positive surgical margins | 30 (81) | 20 (48) | 0.002 |
| Seminal vesicle invasion | 9 (24) | 1 (2) | 0.005 |
| Lymph node involvement | 3 (8) | 0 | 0.09 |
| Median follow-up (mos) (range) | 58 (11–110) | 78 (60–108) |
yrs: years; PSA: prostate-specific antigen; mos: months.
FIGURE 1.
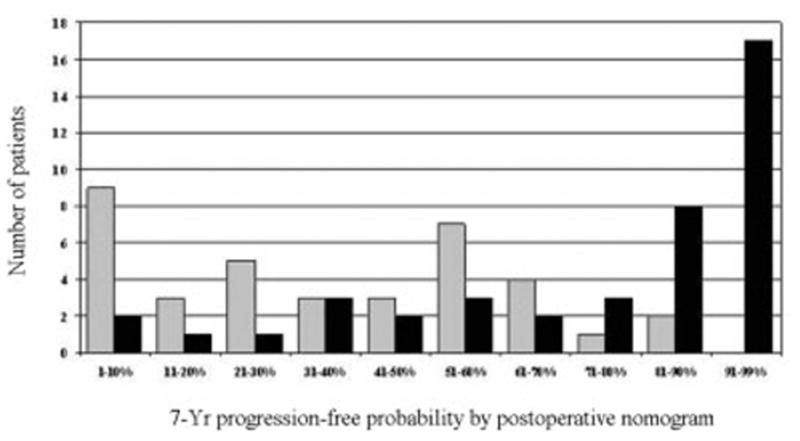
Distribution of postoperative nomogram scores (7-year progression-free probability after radical prostatectomy) for 37 patients with recurrent tumors (gray bars) and 42 patients with nonrecurrent tumors (black bars).
Tissue samples were snap frozen in liquid nitrogen and stored at −80 °C. Each tissue sample was examined histologically using hematoxylin and eosin-stained cryostat sections. The frozen blocks were manually dissected, trimming away unwanted tissue sections to ensure that samples were enriched for neoplastic epithelium with minimal contamination from benign epithelial and stromal elements. All studies were performed under institutional review board-approved protocols.
Gene Expression Analysis
RNA extraction, RNA target synthesis, and sample labeling were performed as previously described.12 Gene expression analysis was carried out using the Affymetrix U133A human gene array, which has 22,283 features for individual gene/expressed sequence tag (EST) clusters, using instruments and protocols recommended by the manufacturer. For each gene on every tissue sample, we extracted 2 response measures, the average difference and absolute call, as determined by the default settings of Affymetrix Microarray Suite 5.0. Expression values on each array were multiplicatively scaled to have an average expression of 500 across the central 96% of all genes on the array. Supervised analysis was performed to identify gene expression differences between recurrent and nonrecurrent prostate carcinoma by considering differential expression and fold change for each gene. Differential expression was evaluated by calculating the 2-sample t statistic between the disease recurrent and nonrecurrent tissue samples (after log2 transformation of expression values) and the P value was subsequently corrected for a false discovery rate of 0.05 (adjusted P value).17
Outcome Prediction Model Based on Gene Expression Profiling
To predict biochemical recurrence using molecular profiling, logistic regression models were developed. Although Cox proportional hazards regression is more appropriate to use with censored data, logistic regression is preferable in our study, which is a two-class problem. Cases and controls were selected with respect to their clinical follow-up.
Logistic regression models were developed and internally validated using leave-one-out cross-validation (LOOCV).18 In LOOCV, each of the 79 tissue samples served as an independent test case and 79 unique models were developed. At each iteration of the LOOCV, prognostic genes were selected for inclusion in the model based on their association with recurrent prostate carcinoma among the 78 tissue samples in the training set only and the performance of each model was assessed when it was applied to the “left-out” sample that was withheld from all phases of the model development.
Within the training set of each iteration of the LOOCV, a step-wise logistic procedure was used to incorporate gene variables into the model, a penalization term (the Akaike Information Criteria) was used to reduce “overfit,” and the addition of new genes to the model ceased when optimal classification was achieved within the training set.19 Genes selected for these models had to pass a 3-part filter that included a significant expression difference between the 2 classes (uncorrected P < 0.001), a fold change > 1.3, and a “present” call in > 80% of the tissue samples in either class. To reduce the potential for bias in the selection of genes, the filter was applied using only the 78 tissue samples within each training set. The gene filter was used to ensure that classifying genes were sufficiently associated with disease recurrence and that their expression levels would be reproduced in independent sample sets. This modeling method is depicted graphically in Figure 2.
FIGURE 2.
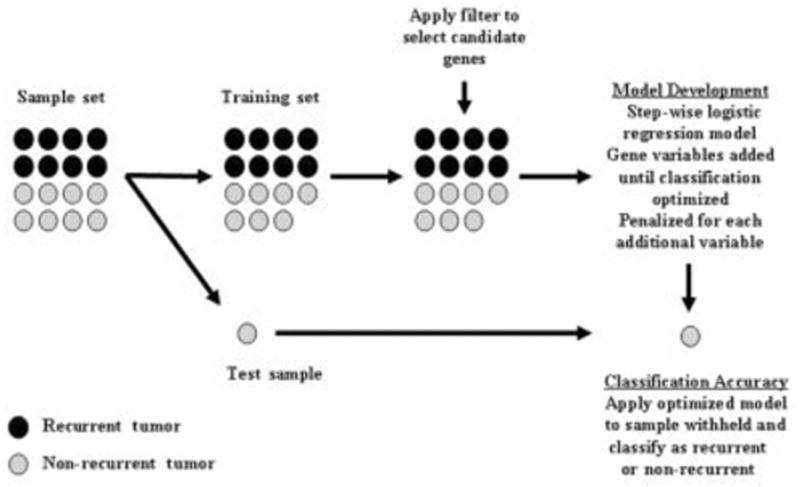
Leave-one-out cross-validation methodology used to develop and internally validate logistic regression modeling approaches incorporating gene expression variables. Black circles: recurrent tumors; gray circles: nonrecurrent tumors.
Two logistic regression modeling approaches were used to predict biochemical recurrence. One approach was based exclusively on gene expression differences between the tumor classes (gene models). A second approach combined the prognostic information of clinical variables and genes associated with disease recurrence (combined models). For the clinical information included in these models, the prediction of the postoperative nomogram was chosen given that it has been extensively validated and is currently the most widely used, disease-specific Palm software (palmOne; Milpitas, CA) prediction tool in oncology.4,20 The nomogram was chosen without a priori knowledge of its performance within our sample set. The logit transformation of the patient’s 7-year PFP calculated from the nomogram was imposed as the first variable in the stepwise logistic regression procedure of the combined models and gene variables were added until optimal classification was achieved within the training set. The performance of models developed using this combined approach was assessed by LOOCV.
PFP was estimated for each left-out sample classified as recurrent and nonrecurrent by each of the models using the Kaplan–Meier method.21 The ability of the models to discriminate among patients was quantified by measuring the c-index which can range from 0.5 (no discrimination) to 1.0 (perfectly discriminating).22 The predictive accuracy of the models was compared using a Z test based on the difference in the c-index and the standard error of the difference.
We attempted to obtain equal numbers of recurrent and nonrecurrent tumors to identify gene expression differences between the two classes. As such, our cohort is not a random sampling of the 1227 patients treated by RP during this time period at MSKCC. The 5-year PFP for all patients treated at MSKCC between 1993 and 1999 was 88% (95% confidence interval [CI], 87–90%) compared with 59% (95% CI, 49–70%) for the 79 patients in the current study. Correcting this sampling bias amounts to adjusting the constant term in the logistic regression model. The predictions were based on the adjusted model.
RESULTS
Gene Expression Analysis
Comparison of gene expression between recurrent and nonrecurrent tumors revealed 153 probe sets that exhibited significant expression differences (adjusted P < 0.05). Fifty-seven of these genes were overexpressed in recurrent tumors. An association with prostate carcinoma has been identified for several of these genes, including glutathione S-transferase classes pi (GSTP1) and M1 (GSTM1), erythrocyte membrane protein band 4.9 (EPB49), FAT tumor suppressor homolog 1 (FAT), transforming growth factor, beta 3 (TGFB3), and prostatic acid phosphatase (ACPP),13,23–27 but the majority have not been implicated in prostate carcinoma.
Gene Expression-Based Predictive Model Development
A logistic regression modeling approach based solely on gene expression differences between the two classes was used to predict biochemical recurrence. In LOOCV, a 5, 6, 7, and 8-gene model was developed in 2, 64, 12, and 1 case(s), respectively, and 46 different genes were selected. Etoposide-induced 2.4 mRNA (EI24) was chosen as the first variable in all models, EBP49 and mitogen-activated protein kinase kinase kinase kinase 4 (MAP4K4) were selected as the second and third variables in 99% of the models, and heterogeneous nuclear ribonucleoprotein C (C1/C2) (HNRPC) was the fourth variable selected in 28% of the models (Table 2). EI24 and MAP4K4 were the most highly overexpressed genes and EPB49 was the most highly underexpressed gene in recurrent tumors (based on adjusted P values).
TABLE 2.
Top 10 most Frequently Selected Genes in Leave-One-Out Cross-Validation of Modeling Approach Using Gene Expression Variables
| Gene symbol | Gene title | Modelsa | Mean expression in recurrent tumors |
|---|---|---|---|
| EI24 | Etoposide-induced 2.4 mRNA | 79 | Overexpressed |
| EPB49 | Erythrocyte membrane protein band 4.9 | 78 | Underexpressed |
| MAP4K4 | Mitogen-activated protein kinase kinase kinase kinase 4 | 78 | Overexpressed |
| GMCL | Germ cell-loss homolog (Drosophila) | 50 | Overexpressed |
| HNRPC | Heterogeneous nuclear ribonucleoprotein C (C1/C2) | 22 | Overexpressed |
| PCOLN3 | Procollagen (type III) N-endopeptidase | 22 | Underexpressed |
| SIL | TAL1 (SCL) interrupting locus | 21 | Overexpressed |
| APP | Amyloid beta (A4) precursor protein | 20 | Overexpressed |
| SSR1 | Signal sequence receptor, alpha | 13 | Overexpressed |
| BTF | Bcl-2–associated transcription factor | 9 | Overexpressed |
Number of models in which variable was selected.
In LOOCV, 59 tissue samples (75%) were correctly classified by the gene expression modeling approach, including 33 nonrecurrent and 26 recurrent tumors. The 5-year PFPs for patients classified as disease recurrent and nonrecurrent by the gene models in LOOCV were 37% (95% CI, 21–53%) and 77% (95% CI, 65–90%), respectively (P < 0.001) (Fig. 3A). However, the c-index of the gene models was inferior to the nomogram (0.75 vs. 0.84, P = 0.01). The likelihood of achieving 75% classification accuracy in LOOCV by chance using gene variables alone was evaluated by calculating the classification rate derived from a LOOCV approach whereby the class labels (disease recurrence and nonrecurrence designation) were randomly permuted among all 79 patients. The median classification accuracy of the LOOCV modeling approaches derived from 20 random permutations was 53% (range, 45–61%). Thus, the classification accuracy of our model based on gene expression variables is unlikely due to random variation between tissue samples.
FIGURE 3.
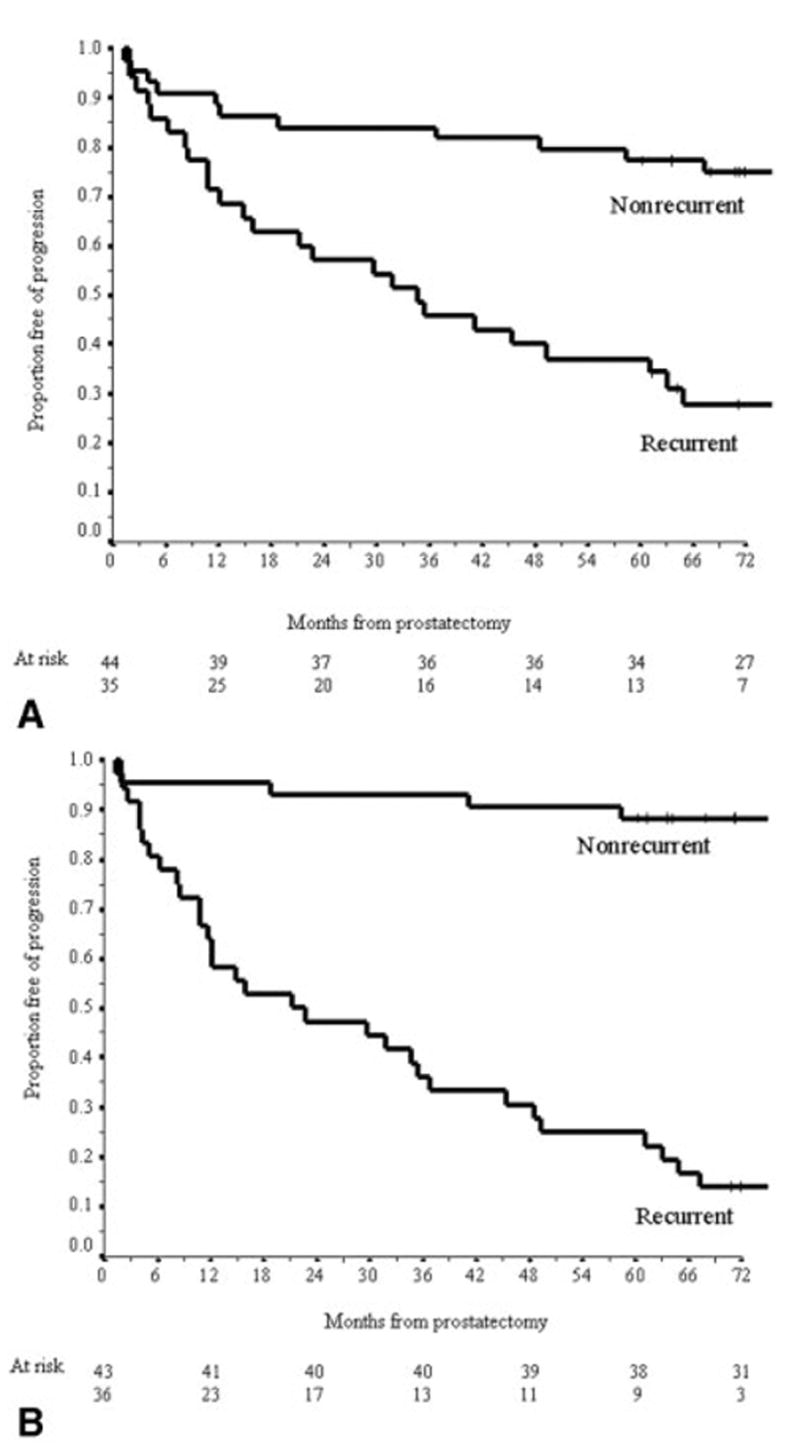
Kaplan–Meier estimates of the probability of disease recurrence for patients classified as nonrecurrent and recurrent by gene expression model (A) and combined model (B).
Combined Model for Outcome Prediction
Although the predictive accuracy of the gene models was inferior to the nomogram, this approach accurately predicted outcomes in a subset of patients that was misclassified by the nomogram, suggesting that the models were behaving in a complementary manner. In the combined models, the nomogram prediction was the first variable and then 3, 4, and 5 genes were selected in LOOCV in 2, 75, and 2 cases, respectively. A total of 24 different genes were selected for these 79 combined models and 13 (54%) were also used in the gene models. It is noteworthy that EI24 was not selected in any of the combined models. EPB49 and APP were selected as the first and second genes in 96% of the models and signal sequence receptor, alpha (SSR1) was the third gene in 66% of the models (Table 3).
TABLE 3.
Top 10 most Frequently Selected Genes in Leave-One-Out Cross-Validation of Combined Modeling Approach
| Gene symbol | Gene title | Modelsa | Mean expression in recurrent tumors |
|---|---|---|---|
| EPB49 | Erythrocyte membrane protein band 4.9 | 79 | Underexpressed |
| APP | Amyloid beta (A4) precursor protein | 78 | Overexpressed |
| SSR1 | Signal sequence receptor, alpha | 54 | Overexpressed |
| ACTA2 | Actin smooth muscle, aorta | 45 | Underexpressed |
| FXR1 | Fragile X mental retardation, autosomal homolog 1 | 17 | Overexpressed |
| PCOLN3 | Procollagen (type III) N-endopeptidase | 12 | Underexpressed |
| MYL9 | Myosin, light polypeptide 9, regulatory | 6 | Underexpressed |
| ARG2 | Arginase, type II | 4 | Underexpressed |
| ACPP | Acid phosphatase, prostate | 2 | Underexpressed |
| MAP4K4 | Mitogen-activated protein kinase kinase kinase kinase 4 | 2 | Overexpressed |
Number of models in which variable was selected.
In LOOCV, 70 tissue samples (89%) were correctly classified using the combined modeling approach, including 38 nonrecurrent and 32 recurrent tumors. For patients classified as disease recurrent and nonrecurrent by the combined models in LOOCV, the observed 5-year PFPs were 25% (95% CI, 11–39%) and 88% (95% CI, 79–98%), respectively (P < 0.001) (Fig. 3B). The c-index of models developed using the combined model (0.89) was significantly better than the nomogram (P = 0.009) and the modeling approach using gene variables alone (P < 0.001).
It is important to note that the improved classification accuracy of the combined modeling approach was particularly evident for the 27 patients with nomogram predictions in the indeterminate range (7-year PFP, 30–70%). Overall, 23 patients (85%) were correctly classified by the combined models in LOOCV, i.e., all 10 nonrecurrent patients and 13 of 17 disease recurrent patients. The c-index of the combined modeling approach for this subset of patients was markedly better than the nomogram (c-index 0.83 vs. 0.59, P = 0.01). The improvement in classification accuracy for this subset using the combined modeling approach is not solely driven by the contribution of gene variables as the c-index by the modeling approach using gene variables alone for these patients was 0.77. Thus, there is a substantial benefit to combining gene expression variables with the nomogram to enhance the accuracy of outcome prediction for patients within this range.
DISCUSSION
Gene expression profiling using oligonucleotide microarrays enables a genome-wide analysis of transcriptional profiles that are associated with specific clinical phenotypes of human malignancies. Several recent studies have identified gene expression profiles that discriminate between benign prostate epithelium and prostate carcinoma, Gleason grade, as well as primary and metastatic prostate carcinoma.8,12,13,15,16 High-throughput techniques such as oligonucleotide microarrays are potentially powerful tools to identify, in a relatively unbiased manner, molecular signatures associated with progressive prostate carcinoma after definitive local therapy. These prognostic molecular signatures may more accurately reflect tumor biology than clinicopathologic parameters and may enhance the ability to predict the outcome of patients treated by RP. However, few studies have analyzed gene expression profiles among primary tumors associated with prostate carcinoma progression.14 In a gene expression analysis of primary tumors, we used molecular signatures of 5–8 genes associated with recurrent prostate carcinoma and accurately predicted disease recurrence in 75% of tissue samples using this approach. However, the predictive accuracy of the gene models was inferior to a validated model based on standard variables currently used in clinical practice. Predictive accuracy was significantly enhanced when prognostic genes identified by molecular profiling were combined with the postoperative nomogram prediction. Validation of these modeling approaches in an independent expression data set is required to evaluate their potential clinical applicability. This novel approach of integrating clinical and molecular variables to predict cancer progression, however, may provide a new paradigm for the use of expression profiling to predict clinical outcome for all malignancies.
To identify prognostic genes for incorporation into our gene and combined models, the LOOCV procedure was used. The LOOCV reduces the likelihood of developing an overly optimistic predictive model (i.e., overfitted to the tissue samples within our cohort) by selecting genes associated with disease recurrence only within the 78 tissue samples of the training set. The validation set consists of one tissue sample that is excluded at each step of model development. Although the LOOCV procedure likely represents the optimal use of the data given the relatively small sample in our study, it is no substitute for external validation on an independent sample set. Independent validation of these models is required to more accurately assess their performance relative to the nomogram and to determine if they are suitable for incorporation into clinical practice. However, due to the difficulty in obtaining sufficient quantities of cancerous tissue from frozen prostatectomy specimens and the long-term follow-up required to determine recurrent cases, it is difficult to obtain an appropriate validation set of sufficient size and with sufficient clinical follow-up. To our knowledge, there are no publicly available prostate carcinoma gene expression data sets with the required size, clinical information, and follow-up for independent testing.
We identified 153 genes that exhibited significant expression differences between recurrent and nonrecurrent primary tumors. These expression differences are relatively few compared with the results of our previous analysis of nonrecurrent primary and meta-static tumor samples.12 In a recent study, Singh et al.14 were unable to identify any genes that exhibited significant differential expression between recurrent and nonrecurrent tumors, although their sample was considerably smaller than the sample in the current study.14
We used the differences in gene expression between the two classes to develop models that predict disease recurrence after RP with 75% accuracy in LOOCV. A final model will eventually be tested on an independent validation set. However, that EI24, EPB49, and MAP4K4 were chosen as the first 3 variables in 78 of 79 models suggests that the final model may have similar classification accuracy when applied to a validation set. It is noteworthy that 3 of the 4 most commonly selected genes in these models (EI24, MAP4K4, HNRPC) have not been previously implicated in prostate carcinoma, whereas EPB49 may have a role as a tumor suppressor gene in prostate carcinoma.27 Singh et al.14 developed a similar model for disease recurrence after RP using a supervised machine learning algorithm based on 5 genes that classified 19 of 21 tissue samples (90%) correctly in LOOCV. Although this model performed well relative to clinical variables, it was not compared with a validated multivariable model such as the nomogram. Nonetheless, these two examples illustrate that prostate carcinoma can be accurately classified with respect to outcome based exclusively on gene expression differences.
Recently, outcome prediction models have been developed for breast and lung carcinoma using molecular profiling and have been shown to perform well, independent of clinical variables.28,29 These molecular models are promising for integration into clinical practice as accurate clinical models for these cancers are lacking. Fortunately, accurate prediction models based on standard variables exist for prostate carcinoma recurrence after RP, external-beam radiotherapy, and brachytherapy.4,30,31 As we observed with our modeling approach using gene expression differences alone, outcome prediction based on molecular profiling may not significantly improve on models that are based on the optimal combination of clinical variables. Although we were able to predict outcome at a high level of accuracy using molecular profiling, this approach did not generate models that outperformed the nomogram.
To our knowledge, no previous study has attempted to integrate prognostic genes identified by molecular profiling with validated models based on clinical variables. The diverse information of clinical and molecular variables is likely to provide a broader assessment of factors that are associated with cancer progression. Based on LOOCV, the predictive accuracy of the combined modeling approach, measured by the c-index (0.89), was superior to the postoperative nomogram (0.84) and the approach using gene variables alone (0.75). This suggests that models incorporating both clinical variables and gene expression information provide greater predictive accuracy than models based on either set of variables alone.
Overall, the integration of gene expression profiling and clinical variables produced a model that had a significant but modest improvement in predictive accuracy over the nomogram. However, a substantial improvement in the classification of patients whose nomogram predictions were in the middle range (7-year PFP, 30–70%) was achieved with the combined modeling approach. The combined models accurately classified 85% of these patients (c-index 0.85) and performed significantly better than the nomogram (c-index 0.59). The nomogram is useful for discriminating among patients at the extremes of predictions, but the anticipated outcome is indeterminate for patients whose probability of disease recurrence is in this middle range. A potential clinical application of a combined model is to distinguish disease recurrent from nonrecurrent patients when the nomogram prediction is in this middle range, which represents approximately 30% of patients who undergo RP for clinically localized prostate carcinoma.
Pending the independent validation of a final combined model, the approach we have taken to integrate gene expression information with clinical variables may provide a new paradigm for the use of molecular profiling to predict clinical outcome for all malignancies. For prostate carcinoma, we believe that the optimal predictive model must be based, in part, on clinical variables. A patient’s prognosis after RP is dependent on technical factors in addition to the inherent biologic properties of his cancer (reflected by serum PSA level, Gleason grade, and pathologic stage). Surgical margins have been reported to be positive in 5–53% of patients and increase the risk of disease recurrence by up to 4-fold in multivariable analysis. Margin status is included in the postoperative nomogram.1,2,4,32 The risk of positive surgical margins in prostatectomy specimens is associated with the clinical features of prostate carcinoma as well as the technique used by individual surgeons.33 The prognostic information of molecular profiling may reflect the biologic potential of prostate carcinoma better than tumor grade, stage, and PSA level, but it does not capture the prognostic importance of technical factors.
Few of the genes that exhibited significant differences in expression in our microarray analysis of recurrent and nonrecurrent primary tumors have been previously implicated in prostate carcinoma. Nonetheless, their proposed functional properties are intriguing. Accumulating evidence suggests that oxidative genomic DNA damage is responsible for the molecular events that lead to the development and progression of prostate carcinoma.34 GSTP1 and GSTM1 are important carcinogen detoxification enzymes and both were significantly underexpressed in our recurrent tumor specimens. EI24, the most highly overexpressed gene in recurrent tumors, is believed to be a direct target of TP53 transcriptional activation and is responsible for the formation of reactive oxygen species leading to apoptosis.35,36 Uncoordinated activity of EI24 may be a potential mechanism contributing to genomic instability and prostate carcinoma progression via oxidative DNA damage or it may be a sign of uncoordinated apoptotic pathways that have been described in a number of malignancies.37 EPB49, the most highly underexpressed gene in recurrent tumors, was the most frequently selected gene in the combined models. The EPB49 gene has been localized to chromosome 8p21.1 (a region frequently deleted in prostate carcinoma) and is an actin-binding/bundling protein involved in the regulation of cell shape.27 MAP4K4 was the second most highly overexpressed gene in our recurrent tumor specimens. MAP4K4 is overexpressed in tumor cell lines and may be an upstream activator of the c-jun N-terminal kinase pathway responsible for activation of several transcription factors.38 These initial observations deserve further investigation to clarify the potential roles of these genes in prostate carcinoma progression.
Acknowledgments
The authors thank Lishi Chen, Sandra Levcovici, Muzaffar Akram, Faye Taylor, Michelle Pappas, Paul Fearn, Hee-Song Seo, and members of the Pathology and Genomics Core Facilities for technical and database assistance.
Footnotes
Supported primarily by the P50-CA92629 Specialized Programs in Research Excellence (SPORE) in Prostate Cancer grant from the National Cancer Institute (NCI) and, in part, by a gift from the Leon Lowenstein Foundation. A. J. S. is supported, in part, by the American Foundation for Urologic Disease and by a National Institutes of Health T32 training grant (CA82088). W. L. G. is supported, in part, by a Director’s Challenge grant (U01-CA84999) from the NCI. J. S. is supported, in part, by grant R01-CA098438 from the NCI.
References
- 1.Hull GW, Rabbani F, Abbas F, Wheeler TM, Kattan MW, Scardino PT. Cancer control with radical prostatectomy alone in 1,000 consecutive patients. J Urol. 2002;167(2 Pt 1):528–534. doi: 10.1016/S0022-5347(01)69079-7. [DOI] [PubMed] [Google Scholar]
- 2.Han M, Partin AW, Pound CR, Epstein JI, Walsh PC. Long-term biochemical disease-free and cancer-specific survival following anatomic radical retropubic prostatectomy. The 15-year Johns Hopkins experience. Urol Clin North Am. 2001;28:555–565. doi: 10.1016/s0094-0143(05)70163-4. [DOI] [PubMed] [Google Scholar]
- 3.Pound CR, Partin AW, Eisenberger MA, Chan DW, Pearson JD, Walsh PC. Natural history of progression after PSA elevation following radical prostatectomy. JAMA. 1999;281:1591–1597. doi: 10.1001/jama.281.17.1591. [DOI] [PubMed] [Google Scholar]
- 4.Kattan MW, Wheeler TM, Scardino PT. Postoperative nomogram for disease recurrence after radical prostatectomy for prostate cancer. J Clin Oncol. 1999;17:1499–1507. doi: 10.1200/JCO.1999.17.5.1499. [DOI] [PubMed] [Google Scholar]
- 5.Blute ML, Bergstralh EJ, Iocca A, Scherer B, Zincke H. Use of Gleason score, prostate specific antigen, seminal vesicle and margin status to predict biochemical failure after radical prostatectomy. J Urol. 2001;165:119–125. doi: 10.1097/00005392-200101000-00030. [DOI] [PubMed] [Google Scholar]
- 6.Partin AW, Piantadosi S, Sanda MG, et al. Selection of men at high risk for disease recurrence for experimental adjuvant therapy following radical prostatectomy. Urology. 1995;45:831–838. doi: 10.1016/S0090-4295(99)80091-0. [DOI] [PubMed] [Google Scholar]
- 7.Graefen M, Karakiewicz PI, Cagiannos I, et al. Validation study of the accuracy of a postoperative nomogram for recurrence after radical prostatectomy for localized prostate cancer. J Clin Oncol. 2002;20:951–956. doi: 10.1200/JCO.2002.20.4.951. [DOI] [PubMed] [Google Scholar]
- 8.Varambally S, Dhanasekaran SM, Zhou M, et al. The poly-comb group protein EZH2 is involved in progression of prostate cancer. Nature. 2002;419:624–629. doi: 10.1038/nature01075. [DOI] [PubMed] [Google Scholar]
- 9.Yang G, Truong LD, Wheeler TM, Thompson TC. Caveolin-1 expression in clinically confined human prostate cancer: a novel prognostic marker. Cancer Res. 1999;59:5719–5723. [PubMed] [Google Scholar]
- 10.Rhodes DR, Sanda MG, Otte AP, Chinnaiyan AM, Rubin MA. Multiplex biomarker approach for determining risk of prostate-specific antigen-defined recurrence of prostate cancer. J Natl Cancer Inst. 2003;95:661–668. doi: 10.1093/jnci/95.9.661. [DOI] [PubMed] [Google Scholar]
- 11.Cote RJ, Shi Y, Groshen S, et al. Association of p27Kip1 levels with recurrence and survival in patients with stage C prostate carcinoma. J Natl Cancer Inst. 1998;90:916–920. doi: 10.1093/jnci/90.12.916. [DOI] [PubMed] [Google Scholar]
- 12.LaTulippe E, Satagopan J, Smith A, et al. Comprehensive gene expression analysis of prostate cancer reveals distinct transcriptional programs associated with metastatic disease. Cancer Res. 2002;62:4499–4506. [PubMed] [Google Scholar]
- 13.Dhanasekaran SM, Barrette TR, Ghosh D, et al. Delineation of prognostic biomarkers in prostate cancer. Nature. 2001;412:822–826. doi: 10.1038/35090585. [DOI] [PubMed] [Google Scholar]
- 14.Singh D, Febbo PG, Ross K, et al. Gene expression correlates of clinical prostate cancer behavior. Cancer Cell. 2002;1:203–209. doi: 10.1016/s1535-6108(02)00030-2. [DOI] [PubMed] [Google Scholar]
- 15.Welsh JB, Sapinoso LM, Su AI, et al. Analysis of gene expression identifies candidate markers and pharmacological targets in prostate cancer. Cancer Res. 2001;61:5974–5978. [PubMed] [Google Scholar]
- 16.Luo J, Duggan DJ, Chen Y, et al. Human prostate cancer and benign prostatic hyperplasia: molecular dissection by gene expression profiling. Cancer Res. 2001;61:4683–4688. [PubMed] [Google Scholar]
- 17.Benjamini Y, Hochberg Y. Controlling the false discovery rate: a practical and powerful approach to multiple testing. J R Stat Soc [B] 1995;57:289–300. [Google Scholar]
- 18.Golub TR, Slonim DK, Tamayo P, et al. Molecular classification of cancer: class discovery and class prediction by gene expression monitoring. Science. 1999;286:531–537. doi: 10.1126/science.286.5439.531. [DOI] [PubMed] [Google Scholar]
- 19.Hosmer DW, Lemeshow S. Applied logistic regression. 2. New York: John Wiley and Sons; 2000. [Google Scholar]
- 20.Blumberg JW. PDA applications for physicians. ASCO News. 2004;16:S4–S6. [Google Scholar]
- 21.Kaplan EL, Meier P. Nonparametric estimation from incomplete observations. J Am Stat Assoc. 1958;53:457–481. [Google Scholar]
- 22.Harrell FE, Jr, Califf RM, Pryor DB, Lee KL, Rosati RA. Evaluating the yield of medical tests. JAMA. 1982;247:2543–2546. [PubMed] [Google Scholar]
- 23.Lee WH, Morton RA, Epstein JI, et al. Cytidine methylation of regulatory sequences near the pi-class glutathione S-transferase gene accompanies human prostatic carcinogen-esis. Proc Natl Acad Sci USA. 1994;91:11733–11737. doi: 10.1073/pnas.91.24.11733. [DOI] [PMC free article] [PubMed] [Google Scholar]
- 24.Perry KT, Anthony CT, Steiner MS. Immunohistochemical localization of TGF beta 1, TGF beta 2, and TGF beta 3 in normal and malignant human prostate. Prostate. 1997;33:133–140. doi: 10.1002/(sici)1097-0045(19971001)33:2<133::aid-pros7>3.0.co;2-l. [DOI] [PubMed] [Google Scholar]
- 25.Chetcuti A, Margan S, Mann S, et al. Identification of differentially expressed genes in organ-confined prostate cancer by gene expression array. Prostate. 2001;47:132–140. doi: 10.1002/pros.1056. [DOI] [PubMed] [Google Scholar]
- 26.Sakai H, Shiraishi K, Minami Y, Yushita Y, Kanetake H, Saito Y. Immunohistochemical prostatic acid phosphatase level as a prognostic factor of prostatic carcinoma. Prostate. 1991;19:265–272. doi: 10.1002/pros.2990190307. [DOI] [PubMed] [Google Scholar]
- 27.Lutchman M, Pack S, Kim AC, et al. Loss of heterozygosity on 8p in prostate cancer implicates a role for dematin in tumor progression. Cancer Genet Cytogenet. 1999;115:65–69. doi: 10.1016/s0165-4608(99)00081-3. [DOI] [PubMed] [Google Scholar]
- 28.van de Vijver MJ, He YD, van’t Veer LJ, et al. A gene-expression signature as a predictor of survival in breast cancer. N Engl J Med. 2002;347:1999–2009. doi: 10.1056/NEJMoa021967. [DOI] [PubMed] [Google Scholar]
- 29.Beer DG, Kardia SL, Huang CC, et al. Gene-expression pro-files predict survival of patients with lung adenocarcinoma. Nat Med. 2002;8:816–824. doi: 10.1038/nm733. [DOI] [PubMed] [Google Scholar]
- 30.Kattan MW, Zelefsky MJ, Kupelian PA, Scardino PT, Fuks Z, Leibel SA. Pretreatment nomogram for predicting the outcome of three-dimensional conformal radiotherapy in prostate cancer. J Clin Oncol. 2000;18:3352–3359. doi: 10.1200/JCO.2000.18.19.3352. [DOI] [PubMed] [Google Scholar]
- 31.Kattan MW, Potters L, Blasko JC, et al. Pretreatment nomogram for predicting freedom from recurrence after permanent prostate brachytherapy in prostate cancer. Urology. 2001;58:393–399. doi: 10.1016/s0090-4295(01)01233-x. [DOI] [PubMed] [Google Scholar]
- 32.Wieder JA, Soloway MS. Incidence, etiology, location, prevention and treatment of positive surgical margins after radical prostatectomy for prostate cancer. J Urol. 1998;160:299–315. [PubMed] [Google Scholar]
- 33.Eastham JA, Kattan MW, Riedel E, et al. Variations among individual surgeons in the rate of positive surgical margins in radical prostatectomy specimens. J Urol. 2003;170(6 Pt 1):2292–2295. doi: 10.1097/01.ju.0000091100.83725.51. [DOI] [PubMed] [Google Scholar]
- 34.Nelson WG, De Marzo AM, Isaacs WB. Prostate cancer. N Engl J Med. 2003;349:366–381. doi: 10.1056/NEJMra021562. [DOI] [PubMed] [Google Scholar]
- 35.Polyak K, Xia Y, Zweier JL, Kinzler KW, Vogelstein B. A model for p53-induced apoptosis. Nature. 1997;389:300–305. doi: 10.1038/38525. [DOI] [PubMed] [Google Scholar]
- 36.Gu Z, Flemington C, Chittenden T, Zambetti GP. ei24, a p53 response gene involved in growth suppression and apoptosis. Mol Cell Biol. 2000;20:233–241. doi: 10.1128/mcb.20.1.233-241.2000. [DOI] [PMC free article] [PubMed] [Google Scholar]
- 37.Kaufmann SH, Vaux DL. Alterations in the apoptotic machinery and their potential role in anticancer drug resistance. Oncogene. 2003;22:7414–7430. doi: 10.1038/sj.onc.1206945. [DOI] [PubMed] [Google Scholar]
- 38.Wright JH, Wang X, Manning G, et al. The STE20 kinase HGK is broadly expressed in human tumor cells and can modulate cellular transformation, invasion, and adhesion. Mol Cell Biol. 2003;23:2068–2082. doi: 10.1128/MCB.23.6.2068-2082.2003. [DOI] [PMC free article] [PubMed] [Google Scholar]