

Abstract
We recently reported that laminin-5, expressed by human mesenchymal stem cells (hMSC), stimulates osteogenic gene expression in these cells in the absence of any other osteogenic stimulus. Here we employ two dimensional liquid chromatography and tandem mass spectrometry, along with the Database for Annotation, Visualization and Integrated Discovery (DAVID), to obtain a more comprehensive profile of the protein (and hence gene) expression changes occurring during laminin-5-induced osteogenesis of hMSC. Specifically, we compare the protein expression profiles of undifferentiated hMSC, hMSC cultured on laminin-5 (Ln-5 hMSC), and fully differentiated human osteoblasts (hOST) with profiles from hMSC treated with well-established osteogenic stimuli (collagen I, vitronectin, or dexamethazone). We find a marked reduction in the number of proteins (e.g., those involved with calcium signaling and cellular metabolism) expressed in Ln-5 hMSC compared to hMSC, consistent with our previous finding that hOST express far fewer proteins than do their hMSC progenitors, a pattern we call “osteogenic gene focusing.” This focused set, which resembles an intermediate stage between hMSC and mature hOST, mirrors the expression profiles of hMSC exposed to established osteogenic stimuli and includes osteogenic extracellular matrix proteins (collagen, vitronectin) and their integrin receptors, calcium signaling proteins, and enzymes involved in lipid metabolism. These results provide direct evidence that laminin-5 alone stimulates global changes in gene/protein expression in hMSC that lead to commitment of these cells to the osteogenic phenotype, and that this commitment correlates with extracellular matrix production.
Keywords: Laminin-5, extracellular matrix, mesenchymal stem cells, osteogenesis
Introduction
Human mesenchymal stem cells (hMSC) are a population of multipotent cells found within the bone marrow and periosteum (Barry et al., 2004). Their ability to differentiate into at least three, and possibly as many as seven, different cell types (Pittenger et al., 2004) makes them attractive tools for tissue engineering and cellular models of development. The molecular and biochemical mechanisms governing hMSC differentiation and commitment are not well understood, especially in response to extracellular matrix (ECM) protein binding.
The laminin (Ln) family of ECM proteins are ubiquitously expressed but are especially abundant in the basement membrane of many epithelial and endothelial tissues, where they mediate cell attachment, migration, and tissue organization in conjunction with other ECM proteins (Malinda et al., 1996). Each laminin molecule is a heterotrimer, composed of an α-, β-, and γ- subunit. The subunits share homology with one another and form an asymmetric cross-like structure with one long and three short arms joined by disulfide bonds (Colognato et al., 2000). The Ln-5 isoform is composed of α3, β3, and γ2 subunits. Expression of the γ2 subunit has only been found in Ln-5, while the α3 subunit is found in both Ln-6 and Ln-7.
The role of Ln family members in osteogenic differentiation is not known (Roche et al., 1999), though expression of the γ2 chain has been previously detected in bone marrow (Siler et al., 2002). Though Ln-5 is typically only found in tissues derived from endoderm and ectoderm, we have recently discovered expression of and roles for Ln-5 in mesoderm tissues; in controlling the growth and migration of vascular smooth muscle cells (Kingsley et al., 2001;Kingsley et al., 2002a;Kingsley et al., 2002b) and in promoting an osteogenic phenotype in hMSC (Klees et al., 2005). These observations raise the question as to how Ln-5 exerts these effects in mesodermal tissues, especially with respect to changes in cellular phenotype.
Recent advances in proteomic approaches have greatly improved the ability to find new markers for cellular differentiation. In particular, two-dimensional liquid chromatography tandem mass spectrometry (2D LC-MS/MS) is a powerful approach for identifying protein constituents in cell populations. For example, mass spectrometry reveals differences in tyrosine phosphorylation of hMSC proteins in response to epidermal growth factor (EGF), platelet-derived growth factor (PDGF), and transforming growth factor β1 (TGFβ1) (Wang et al., 2004;Kratchmarova et al., 2005), and suggests that phosphatidylinositol 3-kinase is a possible control point in the osteogenic differentiation process. Mass spectroscopic profiling of proteins expressed in ECM-stimulated hMSC has thus far not been reported.
We recently used advanced proteomics and mass spectrometry to compare the protein expression profiles of undifferentiated hMSC, hMSC induced to differentiate into osteoblasts using osteogenic stimulating (OS) media, and fully differentiated human osteoblasts (hOST) (Salasznyk et al., 2005a). We found substantial changes in clusters of functionally related hMSC proteins in response to OS stimulation, and identified a set of related proteins that discriminated osteoblasts and OS-treated hMSC from undifferentiated hMSC. Here, we employ a similar strategy to compare the protein expression profile of Ln-5 treated hMSC (Ln-5 hMSC) with those treated with established osteogenic stimuli (collagen I, vitronectin, OS medium) as well as undifferentiated hMSC and hOST. We observe that Ln-5 acts to focus protein expression in hMSC to resemble an intermediate state of osteogenic differentiation, consistent with that found in cells treated with collagen I, vitronectin, or OS medium. These results confirm our observation that Ln-5 activates osteogenic gene expression directly (Klees et. al, 2005).
Results
To identify the proteins expressed during Ln-5 induced osteogenic differentiation of hMSC and compare them to the protein expression profiles of undifferentiated hMSC; hMSC stimulated by collagen I, vitronectin, or OS medium; and physiologically differentiated hOST, we performed 2D LC-MS/MS on whole-cell lysates of these cell populations. To avoid redundancy caused by counting closely related protein isoforms as distinct, we report our numeric results in terms of gene IDs, or simply “genes.” 555 unique gene IDs, corresponding to 758 distinct proteins (≥200 pmol), were identified by 2D LC-MS/MS in all six cell populations. We found that the Ln-5 hMSC genes fell into four classes, represented by the proportional Venn diagram in Figure 1A: those that were shared between Ln-5 HMSC and undifferentiated hMSC (area 1, 46 genes), those that were shared between Ln-5 hMSC and hOST (area 2, 27 genes), those found only in Ln-5 hMSC (area 3, 31 genes), and those found in all three cell populations (area 4, 125 genes). The number of genes found in these areas for the three other stimulated hMSC populations is quite similar (Figure 1B), reflecting a general trend: each stimulated hMSC population contained genes shared by either hMSC (area 1) or hOST (area 2), but the majority of genes detected were shared by all cell populations (area 4).
Figure 1.
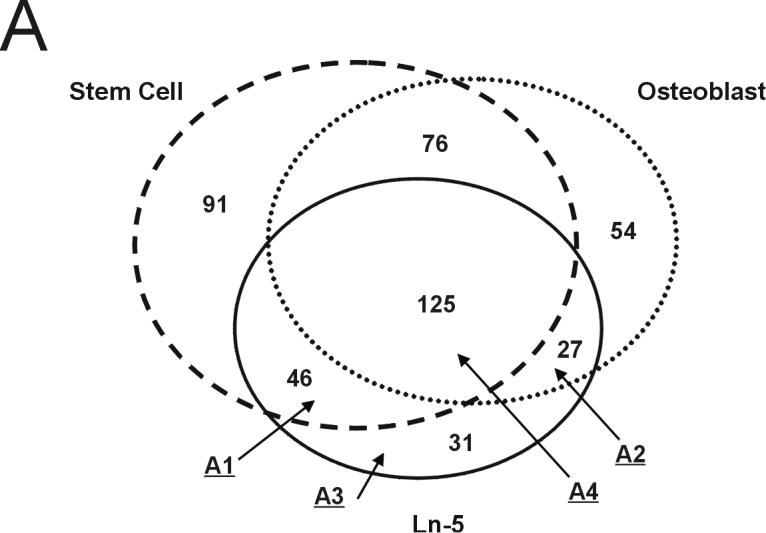
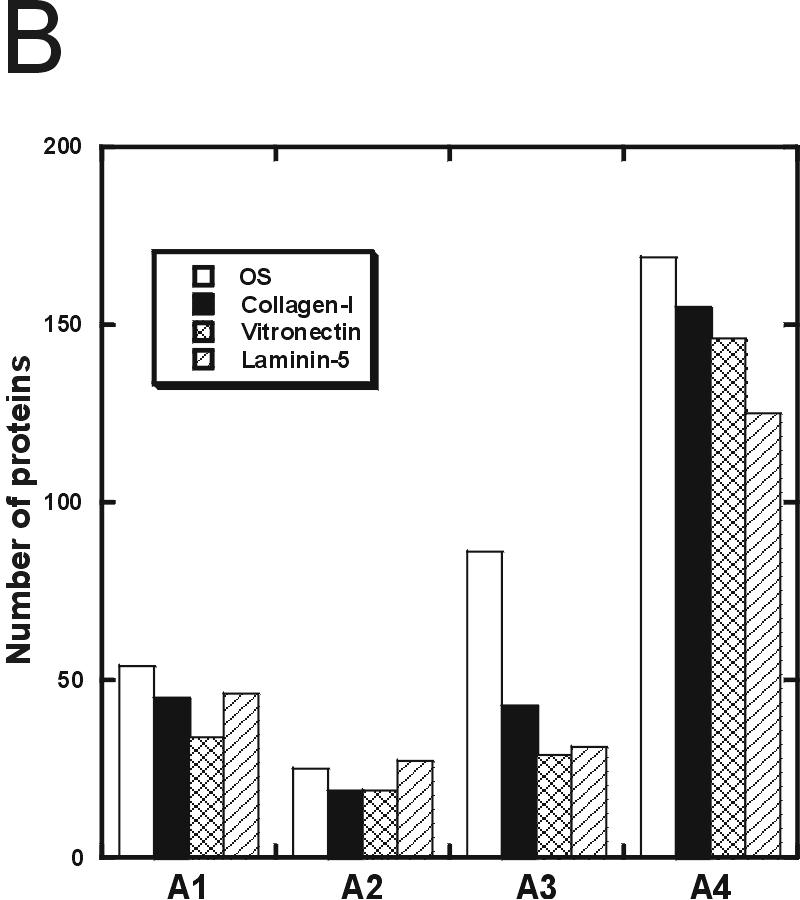
Number of Gene IDs found in hMSC, Ln-5 hMSC, and hOST. (A) Schematic representation in distribution of proteins between hMSC, Ln-5 hMSC, and hOST cell lines. Numbers indicate the quantity of distinct Gene IDs found in each area. Genes found in Ln-5 hMSC are broken down into four distinct areas: A1-found in hMSC and Ln-5 hMSC, A2-found in hOST and Ln-5 hMSC, A3-found in Ln-5 hMSC and not in hMSC or hOST, A4-found in all 3 populations. (B) Comparison of division in Gene IDs per area for OS, Col-I, Vn, and Ln-5 stimulated mesenchymal stem cells.
Table 1 lists representative genes for each area, plus annotation of which other treated populations these genes appear in (the complete list is available at http://www.rpi.edu/∼bennek/TissueEng/ln5.html). Area 1 (Ln-5 hMSC) was characterized by a number of genes encoding signaling proteins, many of which are associated with ECM-stimulated pathways, cell survival, and regulation of cell growth in non-osteoblast lineages (e.g., caldesmon [Hai et al., 2006]; calpain 2 [Westhoff et al., 2004]; beta4 associated protein [Amici et al., 2006]). Most of these genes (31 of 46) were found in Area 1 for hMSC stimulated by collagen I, vitronectin, or OS medium as well (e.g., Table 1, column 3). Area 2 (Ln-5 hMSC) contained several ECM genes, integrin beta 1, and multiple genes encoding cytoskeletal proteins; 19 of the 27 genes in Area 2 were found in Area 2 for the other stimulated hMSC populations. Area 3 (Ln-5 hMSC) contained the most heterogeneous population of genes, ranging in function from ribosomal subunits to a lysosomal ATPase/proton pump. Of these proteins, four were associated with either ECM assembly (collagen type I (alpha 2), procollagen-lysine, 2-oxoglutarate 5-dioxygenase 2) or signal transduction (S100 calcium binding protein A10, and progesterone receptor membrane component 2). All of the genes found in Ln-5 hMSC Area 3 were found in at least one other Area 3, but the majority (17 of 31) were found in Area3 of hMSC treated with OS medium. Area 4, as expected, contained genes responsible for basic cellular metabolism and function.
Table 1.
Representative Gene IDs found in areas 1-4 of Ln-5 stimulated hMSC as indicated in Figure 1. Column 3 indicates presence of chosen Gene IDs in other treated hMSC populations (abbreviations denoted in text).
| Class | Protein | Shared with |
|---|---|---|
| A1 | Rho GTPase activating protein 1 | --- |
| Caldesmon 1 | OS, Col-I, Vn | |
| Calcium/calmodulin-dependent protein kinase (CaM kinase) II delta | OS, Col-I | |
| Calpain 2, (m/II) large subunit | OS, Col-I, Vn | |
| Integrin beta 4 binding protein | Col-I | |
| LIM domain only 7 | OS | |
| Tyrosine 3-monooxygenase/tryptophan 5-monooxygenase activation protein, eta polypeptide (14-3-3) | OS, Col-I, Vn | |
| Reticulocalbin 3, EF-hand calcium binding domain | --- | |
| A2 | Collagen, type VI, alpha 2 | Col-I |
| Cathepsin B | --- | |
| Filamin A, alpha (actin binding protein 280) | Col-I, Vn | |
| Filamin B, beta (actin binding protein 278) | Col-I, Vn | |
| Filamin C, gamma (actin binding protein 280) | Col-I, Vn | |
| Fibronectin 1 | Col-I, Vn | |
| Glucan (1,4-alpha-), branching enzyme 1 | OS, Col-I, Vn | |
| Integrin, beta 1 | OS, Vn | |
| Thrombospondin 1 | --- | |
| Talin 1 | Col-I, Vn | |
| Vitronectin | --- | |
| PDZ and LIM domain 7 | Col-I, Vn | |
| A3 | Collagen, type I, alpha 2 | Vn |
| Procollagen-lysine, 2-oxoglutarate 5-dioxygenase (lysine hydroxylase) 2 | Col-I | |
| S100 calcium binding protein A10 (annexin II ligand, calpactin I, light polypeptide (p11)) | OS, Col-I, Vn | |
| Progesterone receptor membrane component 2 | OS | |
| A4 | Actin, beta | OS, Col-I, Vn |
| ATP synthase, H+ transporting, mitochondrial F1 complex, beta polypeptide | OS, Col-I, Vn | |
| Crystallin, alpha B | OS, Col-I, Vn | |
| Glyceraldehyde-3-phosphate dehydrogenase | OS, Col-I, Vn | |
| Malate dehydrogenase 2, NAD (mitochondrial) | OS, Col-I, Vn | |
| Histone 1, H2aj | OS, Col-I, Vn |
When the total gene/protein expression pattern was compared across all four populations of stimulated hMSC, a striking pattern emerged: each ECM-stimulated hMSC population expressed fewer genes than unstimulated hMSC or hOST. Specifically, hMSC and hOST expressed 338 and 282 different genes, respectively (a drop of 56 genes, or 16% reduction in gene/protein variation during osteogenic differentiation), while the number of different genes in hMSC stimulated with Ln-5 (229), collagen I (262), and vitronectin (228) were 22-32% lower than that in hMSC, and even 7-19% lower than that in hOST. In contrast, cells treated with OS medium expressed 334 different genes, nearly the same number as hMSC. These results suggest that, in general, hMSC treated with Ln-5 (as well as collagen I or vitronectin) represent a distinct, intermediate stage between hMSC and hOST. These results also confirm our previous finding that OS-treated hMSC closely resemble unstimulated hMSC (Salasznyk et al, 2005a).
To evaluate the functional significance of these differences, we accessed the GO (Gene Ontology) Chart featured by DAVID to generate the Biological Process and Molecular Function protein distributions shown in Figure 2. A detailed summary of the findings for each class of genes is presented here in graphical format, although readers are encouraged to visit http://www.rpi.edu/∼bennek/TissueEng/ln5.html for the complete listing of all reports and text files, including, when applicable: each protein's accession identification number, molecular weight, GeneCard and Entrez Gene links, links to possible function in stem cells and bone, along with a summary of the protein and its function.
Figure 2.
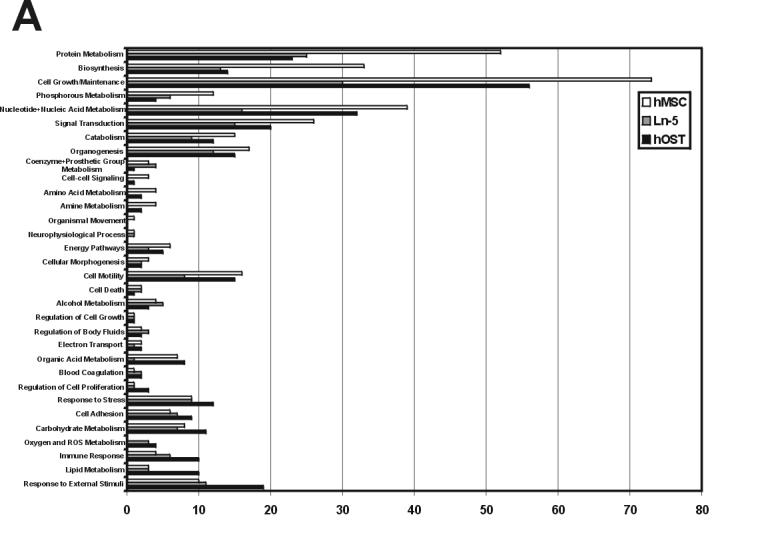
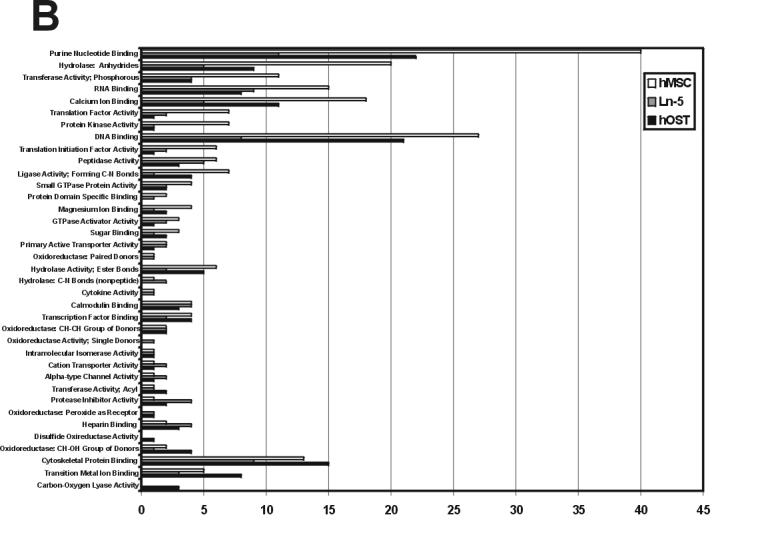
Gene ontology classification of hMSC, Ln-5 hMSC, and hOST. The Entrez Gene ID numbers of proteins in hMSC, Ln-5 hMSC, and hOST, were categorized in Biological Processes (A) and Molecular Function (B) gene ontology categories using the GO Chart feature offered by DAVID. The GO categories were determined for each data set and then joined to form a complete list. DAVID was set at intermediate coverage and specificity (Level 3) with a minimum of 4 Entrez Gene GeneIDs.
Differential expression of a sample set of proteins (β-tubulin, CaMKIIalpha, osteonectin, fibronectin, and CD81) was confirmed by western blot analyses and RT-PCR, as shown in Figures 3 and 4. With western blots, we observed a marked decrease in the amount of CaMKIIalpha in Ln-5 hMSC and an absence in hOST, as compared to undifferentiated hMSC. The well known osteogenic protein, osteonectin, was present only in Ln-5 hMSC and hOST lysates, with none detected in the undifferentiated hMSC lysate (Figure 3). Finally, levels of β-tubulin were equivalent across samples (Figure 2). RT-PCR confirmed that expression of fibronectin was higher in both Ln-5 hMSC and hOST than in hMSC (Figure 4). Expression of CD81 was higher in Ln-5 hMSC and hOST than in hMSC (Figure 4). Levels of β-tubulin did not vary between the three cell populations, consistent with both the mass spectrometry and Western blot analyses.
Figure 3.

Western blot analysis of β-tubulin, CaMK IIalpha, and Osteonectin expression in hMSC, Ln-5 hMSC, and hOST cell lines. The indicated proteins confirmed 2D LC-MS/MS results and were identified by using the antibodies described in Materials and Methods.
Figure 4.
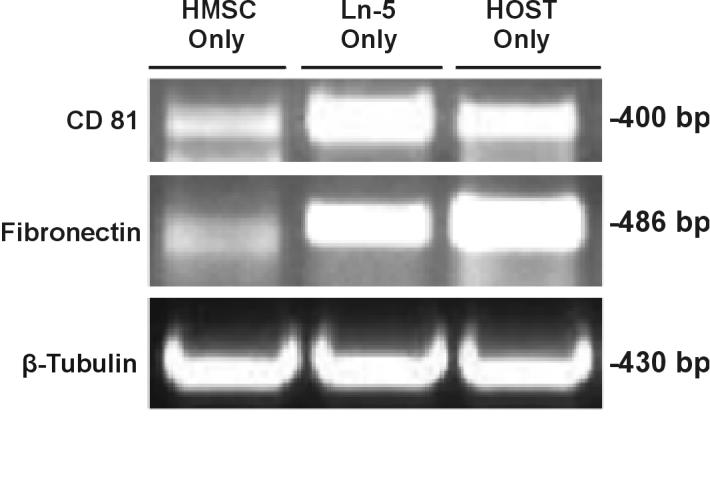
RT-PCR analysis of CD 81, Fibronectin, and β-Tubulin expression in hMSC, Ln-5 hMSC, and hOST cell lines. The indicated proteins confirmed 2D LC-MS/MS results and were identified by using the antibodies described in Materials and Methods.
Discussion
There are several important themes that arise from the comparison of these six cell populations, consistent with a significant role of extracellular matrix production during Ln-5-induced osteogenic differentiation of hMSC. The first is that ECM expression increases significantly in stem cells that have undergone complete (hOST) or even partial (Ln-5 hMSC) osteogenic differentiation. Amazingly, we did not detect any of these proteins in undifferentiated hMSC in this study. We used the NH4OH extraction method developed by Gospodarowicz for isolating insoluble extracellular matrix (Gospodarowicz, 1984) from cultures of hMSC, and failed to detect any ECM proteins or integrins using 2D LC-MS/MS (R. Klees, unpublished results), confirming this striking finding. In fact, one report suggests that ECM is deposited by these cells only when they are grown in three-dimensional scaffolds (Grayson et al., 2004). hMSC stimulated with OS media likewise uncovered no ECM proteins (Salasznyk et. al, 2005a). OS media, which contains ascorbic acid-2-phosphate, β-glycerophosphate, and the synthetic glucocorticoid dexamethasone, has long been the benchmark for a pro-osteogenic stimulus driving hMSC osteogenesis in vitro (Jaiswal et al., 2000;Pittenger et al., 1999), but the absence of ECM proteins in OS-treated cells underscores our earlier observation that in some ways, these cells resemble undifferentiated hMSC more than their differentiated counterparts, Ln-5 hMSC and hOST. The absence of detectable amounts of insoluble ECM may therefore be a defining characteristic of the undifferentiated state in hMSC.
Collagen I, collagen VI, fibronectin, vitronectin, and osteonectin/SPARC were detected in the Ln-5 hMSC population, and these proteins play an important role in bone formation. Collagen I comprises 90-95% of the organic matrix of bone, (Datta et al., 2006), is absolutely essential for bone formation (Plotkin, 2004), and associates tightly with collagen VI. Collagen VI is necessary for collagen I production in osteoblast like cells (Harumiya et al., 2002) and interlukin-4-dependent mineralization of human periosteal cells (Ishibashi et al., 1999). Likewise fibronectin, which supports attachment and spreading of hMSC and osteoblasts (Salasznyk et al., 2004b;Ogura et al., 2004;Pistone et al., 1996), is secreted by osteoblasts early in development, and may act to help organize the osteoid matrix by binding to collagen I in mature bone tissue (Nordahl et al., 1995). Damsky and colleagues have demonstrated that osteoblast/fibronectin interactions supply a necessary regulatory signal essential for osteogenic gene expression, with fibronectin possibly playing a role in the recruitment of osteoblast precursor cells (Globus et al., 1995;Moursi et al., 1996;Globus et al., 1998). Finally, osteonectin/SPARC is one of the most abundant noncollagenous proteins found in bone, and it binds strongly to hydroxyapatite (Romberg et al., 1985;Romberg et al., 1986) and collagen I (Kelm, Jr. et al., 1991). Null mutations in osteonectin result in a reduced number of osteoblasts and poor bone maturation, as well as a reduction in matrix production and assembly (Boskey et al., 2003;Delany et al., 2003). Vitronectin, detected in both Ln-5 hMSC and hOST, promotes commitment of hMSC to an osteogenic lineage (Salasznyk et al., 2004a). Collectively, these results illustrate that Ln-5 is a potent inducer of several pro-osteogenic ECM proteins, and that expression of these proteins is an important hallmark of commitment to the osteogenic lineage in hMSC.
These results suggest the possibility that Ln-5 knockout mice would exhibit a bone phenotype, yet no such phenotype is reported in laminin alpha3 chain knockout mice, which cannot produce Ln-5, -6, or -7 (Ryan et al., 1999). These findings are not as disappointing as they may appear at first. Instead, how Ln-5 and other laminins function in vivo may be far more complicated than our in vitro studies suggest. For example, it is now well accepted that focal adhesion kinase plays a significant a role in cell migration in vitro, yet there are no differences in healing of skin wounds in either keratin 14-Cre (McLean et al., 2004) or keratin 5-Cre (Essayem et al., 2006) keratinocyte-specific focal adhesion kinase knockout mice. Moreover, focal adhesion kinase-null keratinocytes do not survive in vitro, but are quite viable in these animals. Thus, as-yet-unknown, functionally redundant signaling mechanisms may be able to accommodate Ln-5 knockout in some tissues, including bone.
The second theme of our findings is that ECM stimulation induces “focusing” of hMSC gene/protein expression. This focusing is characterized by two patterns: a generalized drop in the number of different proteins/genes expressed during hMSC differentiation to form osteoblasts, and a gain of expression in a subset of functionally related proteins/genes (Salasznyk et al., 2005a, 2005b). These patterns are reflected in Figure 2: first, the length of the hMSC bars is generally longer than either Ln-5 hMSC or hOST, especially at the top of each panel. Second, the length of the hOST bars is greater in a small subset of the ontologies, especially at the bottom of each panel. The fact that all three of our ECM-stimulated hMSC populations expressed fewer genes than either hMSC or hOST suggests that shutting down gene expression may represent the first phase of this focusing. Using the gene ontology analysis provided by DAVID, we readily observe both patterns of this focusing in our ECM-treated cells. For example, Ln-5 stimulation induces a reduction in genes/proteins involved in control of cell proliferation, catabolism, and protease inhibitor activity, but also induces a substantial increase in the number of proteins/genes involved in protein kinase activity, cell-cell signaling, and cell motility. In particular, there is a reduction in genes/proteins belonging to the relatively generalized calcium signaling ontology, but there is an increase in the number of genes/proteins belonging to the more specific calmodulin binding ontology: several isoforms of calmodulin, CamKII, reticulocalbin, and caldesmon are detected in hMSC but not in Ln-5 hMSC or hOST, yet S100 A10, calpastatin, caldesmon, myosin heavy chain, and spectrin are found in Ln-5 hMSC but not undifferentiated hMSC. These differences may also account for the large disparity of protein kinase activity seen in the gene ontologies of the three populations.
Our results also show strong evidence that Ln-5 hMSC, as well as the other stimulated hMSC populations, represent intermediate states between undifferentiated hMSC and fully differentiated hOST. Because the protein/gene expression profiles of stimulated cells overlap with both hMSC and hOST, yet do not exactly replicate these differentiation end points, we suggest that they represent a stage of partial differentiation along the osteogenic lineage. For example, both hMSC and Ln-5 hMSC share numerous neural and muscle cell genes (e.g., puromycin-sensitive aminopeptidase) not found in mature hOST. To our knowledge, this is the first proteomic profiling of such an intermediate state of stem cell differentiation. Furthermore, because the profiles of the four intermediate populations we studied are not identical, this suggests that they might even represent differing degrees of differentiation.
Of particular interest to us is the set of proteins shared by Ln-5 hMSC and hOST, as they may suggest how Ln-5 promotes osteogenesis in hMSC. Our gene ontology analysis shows that a considerably higher number of genes belonging to the catabolism and lipid metabolism ontologies are expressed in both Ln-5 hMSC and hOST conditions relative to hMSC, with a concomitant loss of genes involved in metabolism of phosphorous, amines, and amino acids. hOST and Ln-5 hMSC thus appear to rely more upon lipid metabolism for energy consumption than their undifferentiated counterparts, hMSC. These shifts may also signify an important, though generally overlooked, characteristic of the osteogenic phenotype. Ln-5 hMSC and hOST also express a smaller collection of mRNA transcription factors than hMSC, yet retain NFAT, which may play a role in activation of the master bone gene osterix. This trend may be a direct result of the focusing described above.
Another feature of the data raises an important question: why are so many genes in both hOST and Ln-5 hMSC being classified under the immune response category? The answer is still unclear, but recent evidence suggests a crosstalk of interactions between human T-cells and hOST due to the expression of molecules involved in immune interactions by osteoblasts (Stanley et al., 2006). As mentioned above, interlukin-4 can induce mineralization of human preosteoblastic cells (Ueno et al., 1992) and is one of many cytokines produced by T-lymphocytes (Riancho et al., 1995). NFAT, a T-cell transcription factor which is dephosphorylated by calcineurin (a protein that is activated by calmodulin) is also present in the Ln-5 hMSC culture. Once dephosphorylated, NFATs are transciptionally active, though their exact role in osteoblast differentiation is not clear (Zayzafoon, 2006). Recent work done by Koga and colleagues suggests that NFAT transcription factors play an important transcriptional role in osteoblasts. Their work postulates a cooperative role for NFAT and osterix (Koga et al., 2005). By forming a complex with osterix and binding to DNA, NFATs are able to regulate osterix transcriptional activity and control osteoblast bone formation.
In summary, our data demonstrate that Ln-5 stimulation alone is sufficient to induce the transdifferentiation of hMSC to an osteogenic phenotype, and that this transition is defined by two significant changes in protein expression: an upregulation of pro-osteogenic ECM proteins, and a focusing of numerous related protein families, including those involved in calcium signaling. These changes may represent new markers for the ECM-induced differentiation of stem cells.
MATERIALS AND METHODS
Standard cell culture materials were purchased as previously described (Salasznyk et. al, 2005b). Mouse monoclonal IgG antibodies against anti-tubulin beta III (catalog # MAB1637) and calmodulin-dependent protein kinase II (CaMKII) (catalog # MAB3119) were purchased from Chemicon International (Temecula, CA). Rabbit polyclonal IgG antibody against anti-osteonectin (catalog #499255) was purchased from EMD Biosciences (San Diego, CA). Horseradish peroxidase (HRP)-conjugated goat anti-mouse IgG and HRP-conjugated goat anti-rabbit IgG secondary antibodies were obtained from Jackson Immuno Research (West Grove, PA). Reverse transcriptase-polymerase chain reaction (RT-PCR) primers were purchased from IDT Technologies (Coralville, Iowa). RT-PCR kit (catalog #HTRT-400RF) was obtained from MCLAB (San Francisco, CA). The protein assay kit was purchased from Pierce (Rockford, IL).
Culture of hMSC and human osteoblasts
Cryopreserved hMSC and hOST were routinely passaged as previously described (Salasznyk et al., 2005b). Ln-5 was obtained by growing 804G rat bladder carcinoma cells as previously described (Gospodarowicz, 1984).
2D LC-MS/MS
Preparation of hMSC, Ln-5-hMSC, and hOST whole cell lysates (collected after 16 days in culture) for 2D LC-MS/MS was adapted as described (Salasznyk et al., 2005a) from an earlier protocol (Corsini et al., 1999). Protein concentration was measured by the Bradford method (Bradford, 1976). Briefly, protein pellets were dissolved in 100 mM Tris-HCl, pH 8.5, 5 mM tributyl phosphine, and 6.4 M urea. The protein mixtures were incubated for 30 min at 37°C followed by the alkylation in 15 mM iodoacetamide. Reactants were then diluted six-fold and subjected to tryptic digestion overnight at 37°C. The reaction was stopped with the addition of 90% formic acid, and the resultant peptides were then concentrated with C18 cartridges and exchange into 5% acetonitrile, 0.4% formic acid, and 0.005% heptafluorobutylic acid (HFBA). Samples (120 μg protein) were analyzed in duplicate using an analytical system consisting of a CapLC autosampler, CapLC pumps, stream selector, Z-spray probe, and a quadruple time-of-flight mass (TOF) spectrometer. The setup was configured with a polysulfoethyl strong cation exchange (SCX) column (320 μm ID X 80 mm, packed with 20 μm POROS 20 HS from Applied Biosystems) in series with a desalting column (300 μm ID X 5 mm, packed with a C18 stationary phase from Therom Quest Inc.) and a reverse-phase C18 column (75 μm ID X 110 mm, packed with BetaBasic C18 resin from ThermoHypersil Keystone) for two-dimensional separations. For elution, solvent A9 consisted of 3% CH3CN, 0.4% acetic acid, and 0.005% HFBA; solvent B was 90% CH3CN, 0.4% acetic acid, and 0.005% HFBA. Tryptic digests were loaded onto the 2D LC-MS/MS system under pressure. Peptides in 10 mM NaCl solution were first absorbed onto the SCX column; the peptides in the flow through were washed onto the reverse-phase peptide-trapping column where they were concentrated and desalted. First-stage separation was achieved by eluting the SCX column with 20 μl each of 0, 10, 20, 30, 40, 50, 60, 70, 80, 90, 100, 120, 140, 150, 160, 200, 250, 300, 500, and 830 mM KCl. For second-stage separation, each of the eluates was separated on a reverse-phase column by the application of a series of mobile phase-B gradients (1–10% B in 5 min, 10–15% B in 25 min, 15–20% B in 15 min, 20–45% B in 10 min, 45–80% B in 5 min). The separated peptides were characterized by their mass and sequence data (MS/MS). To load samples, a picofrit column was connected directly to a Q-TOF 2 Zsprayer. Approximately 2,100 volts were applied to the spray tip. Approximately 5 psi of nebulizing gas was introduced around the spray tip to aid the electrospray process. A splitter gave a resultant flow through the analytical column of 200 nl/min with the pump programmed to deliver a flow of 6.5 μl/min. The mass spectrometer was operated in a data-dependent acquisition mode whereby, following the interrogation of MS data, ions were selected for MS/MS analysis based on their intensity and charge state. The detection threshold for this instrument is 200 pmol per protein. Collision energies were chosen automatically based on the m/a and charge-state of the selected precursor ions. Ion data were compared to the National Center for Biotechnology Information (NCBI) nonredundant human sapiens database using the Proteinlynx 1.1 Global Server program.
Data sorting
945 different proteins were identified by 2D LC MS/MS; 765 different proteins were identified with accession numbers (in Ensemble, Refseq, or Trembl format) and a protein name. Each protein was also matched to its gene ID at Entrez Gene at NCIBIB (http://www.ncbi.nih.gov/entrez/query.fcgi?db=gene), if available, by accessing the European Bioinformatics Institute (http://www.ebi.ac.uk/IPI/IPIhelp.html), downloading the ipi.HUMAN.xrefs.gz IPI dataset (ftp.ebi.ac.uk/pub/databases/IPI/current/), and matching each accession number to its corresponding gene ID number. Proteins that were not assigned a gene ID using this method were searched by hand using the online search function (IPI Quick Search) and the search feature located at Entrez Gene by entering available accession numbers and the protein name.
A given protein as identified by the gene ID was considered to be present in a sample if at least one accession number corresponding to that protein was found in that sample. To control for the fact that the Ln-5 hMSC proteomic analysis was identified with a slightly more complete database than the earlier analysis of hOST, hMSC, OS medium hMSC, collagen hMSC and vitronectin hMSC, we restricted the analysis of Ln-5 hMSC to proteins with the gene IDs found in at least one of hOST, hMSC, collagen hMSC, OS medium hMSC, and vitronectin hMSC samples. There are 555 such gene IDs, corresponding to 758 proteins. (The 110 gene IDs unique to Ln-5 and previously unseen in the other samples are given on the website. In addition, there were 16 proteins unique to Ln-5 that could not be linked to a gene ID.)
To determine protein functional relationships within and between each data set, we used the Database for Annotation, Visualization and Integrated Discovery (DAVID) (located at http://apps1.niaid.nih.gov/david/). DAVID is a Web-based, client/server application that allows users to access a relational database of functional annotation. Through DAVID, proteins identified with a gene ID can be annotated with gene ontologies. The gene ID of proteins in the six samples were categorized in Biological Process and Molecular Function gene ontology categories using the GO (Gene Ontology) Chart feature offered by DAVID 1.0 (http://www.geneontology.org/GO.nodes.html). The GO categories were determined for each data set and then unioned to form a complete list. DAVID was set at intermediate coverage and specificity [Level 3] with a minimum of 4 gene IDs. This setting was found to best balance coverage and specificity, but not all of the proteins were assigned to a GO category. To facilitate deeper investigation, each gene ID was assigned a gene symbol, gene name, and a summary using DAVID 2.0's Annotation tool.
A relational database management system (DBMS) was used to develop both the gene ontology analysis and the further protein classifications. The DBMS used was Microsoft Access 2000, and the database itself consists of 16 tables (comprising over 16000 records), 148 queries, 12 reports, two macros, and two programming modules. Reports and queries were written and generated, using the DBMS facilities and additional programming, to help produce the statistics reported in this paper and on the web site. In addition, the database was programmed to produce HTML reports in a format suitable for public use, as well as to generate other supporting reports, information, and statistics used in our analysis.
To analyze the relationships of these gene IDs to the six cell types, we first used the DBMS to divide them into (overlapping) sets of gene IDs, one for each of the six cell types. The natures of the overlaps were then determined (again using the DBMS) by creating, for the four cell types other than hMSC and hOST, sets of gene IDs characterizing the overlap between that cell type, hMSC, and hOST, while ignoring whether that gene ID participated in any of the other three cell types. For example, for collagen hMSC four sets of gene IDs were derived: one set of gene IDs in collagen hMSC (and possibly in vitronectin hMSC or OS medium hMSC or Ln-5 hMSC) and hMSC and hOST (155 gene IDs); one set in collagen hMSC (and possibly in one or more of the other three) and hMSC but not hOST (45 gene IDs); one set in collagen hMSC (and possibly in one or more of the other three) and hOST but not hMSC (19 gene IDs); and one set in collagen hMSC (and possibly in one or more of the other three) but neither hOST nor hMSC (43 gene IDs). Similar classifications were performed for Ln-5 hMSC, vitronectin hMSC, and OS medium hMSC.
A more detailed analysis was performed for Ln-5 hMSC: in addition to the above, sets of gene IDs in the following classifications were also generated using the DBMS: those in hMSC and hOST (and possibly one or more of collagen hMSC, vitronectin hMSC, or OS medium hMSC) but not in Ln-5 hMSC (76 gene IDs); those in hMSC (and possibly one or more of the other three) but in neither Ln-5 hMSC nor hOST (91 gene IDs); and those in hOST (and possibly one or more of the other three) but in neither Ln-5 hMSC nor hMSC (54 gene IDs). This enables a complete Venn diagram for the relationships between Ln-5 hMSC, hMSC, and hOST to be generated. To derive the data behind Table 1, information about specific gene IDs common to areas of the Venn diagram for Ln-5 hMSC and the corresponding areas of the Venn diagrams for collagen hMSC, OS medium hMSC, and vitronectin hMSC was needed. Gene ID sets previously computed were merged then joined with more identifying information for the gene ID (name, symbol, etc.). This was also done within the DBMS.
For the gene ontology analysis, the DBMS was used to store, link, and analyze the annotated proteins, annotated gene IDs, and gene ontology categories. The database was used to categorize the proteins (and their associated gene symbols, gene IDs, external links, and functional summaries) into the groups described here, and to generate one report per group. The web-based reports are dynamic in the sense that links are provided for each protein that automatically launch a PubMed query (http://www.ncbi.nlm.nih.gov/entrez/query.fcgi) based on the protein name and key words or phrases such as “bone” and “stem cell”, among others. There are also links, for each protein, to its GeneCard and Entrez Gene entries. The report allows the biologist to rapidly examine all proteins that belong to a specific GO category, observe how they were distributed in the data sets, and analyze the functionality of the proteins.
Text files containing all of our raw data, a list of Ln-5 gene IDs not found in any of the other five samples, and more complete data supporting Table 1, are all available at the paper's web page, http://www.rpi.edu/∼bennek/TissueEng/ln5.html. The GO analysis and the associated web-based reports are also available by following the “gene ontology analysis” link on the paper's home page.
Westernblotting and RT-PCR
Cells grown for 16 days were extracted with RIPA buffer, suspended in 4X Laemmli buffer, and subsequently denatured at 100°C for 5 min. Denatured extracts were resolved by 8% SDS-PAGE and transferred to nitrocellulose. Membranes were blocked with 5% nonfat dried milk and 0.2% Tween-20 for 1 h and then probed with indicated primary antibodies (1:500) overnight at 4°C. After three washes with phosphate-buffered saline (PBS) containing 0.2% Tween-20, membranes were incubated with horseradish peroxidase (HRP)-conjugated secondary immunoglobulin G (IgG) (1:10,000) for 1 h, after which they were washed three times and detected by enhanced chemiluminescence.
RNA was isolated after 16 days in culture for all conditions using the RNeasy mini kit (Qiagen, Valencia, CA). RT-PCR was performed with the OneStep RT-PCR Kit (MCLAB) and a 96 well thermal cycler (MJ Research, Waltham, MA) using the following primers designed by the Lasergene v5.0 program (DNASTAR, Madison, WI): CD-81 forward 5′-GCCCCCGCGCCCCTTTCTTC-3′ reverse 5′-GGATTCCTGGATGGCCCCGTAGCA-3′; β-tubulin forward 5′-CCGGGAGGCAGATGGTAGTGACAG-3′ reverse 5′-GAGCCGTGGGGTGGGAATGAGC-3′; fibronectin forward 5′-TCTGTAGGCCGTTGGAAGGAAG-3′ reverse 5′-AGGCGCTGTTGTTTGTGAAGTAGA-3′. 100 ng of template RNA was used per reaction. The reverse transcription step ran for 30 min at 50°C, followed by PCR activation for 15 min at 95°C. Thirty amplification cycles were run, consisting of 1 min denaturation at 94°C, 1 min of annealing at 60°C, and 1 min of extension at 72°C. Final extension was allowed to run 10 min at 72°C. Reaction products were separated by gel electrophoresis using a 1% agarose gel. Bands were visualized by UV illumination of ethidium-bromide-stained gels and captured using a ChemiImager 4400 Gel imaging system (Alpha Innotech, San Leandro, CA).
Footnotes
Publisher's Disclaimer: This is a PDF file of an unedited manuscript that has been accepted for publication. As a service to our customers we are providing this early version of the manuscript. The manuscript will undergo copyediting, typesetting, and review of the resulting proof before it is published in its final citable form. Please note that during the production process errors may be discovered which could affect the content, and all legal disclaimers that apply to the journal pertain.
Reference List
- 1.Amici SA, Dunn WA, Jr, Murphy AJ, Adams NC, Gale NW, Valenzuela DM, Yancopoulos GD, Notterpek L. Peripheral myelin protein 22 is in complex with alpha6beta4 integrin, and its absence alters the Schwann cell basal lamina. J Neurosci. 2006;26(4):1179–89. doi: 10.1523/JNEUROSCI.2618-05.2006. [DOI] [PMC free article] [PubMed] [Google Scholar]
- 2.Barry FP, Murphy JM. Mesenchymal stem cells: clinical applications and biological characterization. Int.J.Biochem.Cell Biol. 2004;36:568–584. doi: 10.1016/j.biocel.2003.11.001. [DOI] [PubMed] [Google Scholar]
- 3.Boskey AL, Moore DJ, Amling M, Canalis E, Delany AM. Infrared analysis of the mineral and matrix in bones of osteonectin-null mice and their wildtype controls. J.Bone Miner.Res. 2003;18:1005–1011. doi: 10.1359/jbmr.2003.18.6.1005. [DOI] [PubMed] [Google Scholar]
- 4.Bradford MM. A rapid and sensitive method for the quantitation of microgram quantities of protein utilizing the principle of protein-dye binding. Anal.Biochem. 1976;72:248–254. doi: 10.1016/0003-2697(76)90527-3. [DOI] [PubMed] [Google Scholar]
- 5.Colognato H, Yurchenco PD. Form and function: the laminin family of heterotrimers. Dev.Dyn. 2000;218:213–234. doi: 10.1002/(SICI)1097-0177(200006)218:2<213::AID-DVDY1>3.0.CO;2-R. [DOI] [PubMed] [Google Scholar]
- 6.Corsini A, Farnsworth CC, McGeady P, Gelb MH, Glomset JA. Incorporation of radiolabeled prenyl alcohols and their analogs into mammalian cell proteins. A useful tool for studying protein prenylation. Methods Mol.Biol. 1999;116:125–144. doi: 10.1385/1-59259-264-3:125. [DOI] [PubMed] [Google Scholar]
- 7.Datta N, Pham P, Sharma U, Sikavitsas VI, Jansen JA, Mikos AG. In vitro generated extracellular matrix and fluid shear stress synergistically enhance 3D osteoblastic differentiation. Proc.Natl.Acad.Sci.U.S.A. 2006 doi: 10.1073/pnas.0505661103. [DOI] [PMC free article] [PubMed] [Google Scholar]
- 8.Delany AM, Kalajzic I, Bradshaw AD, Sage EH, Canalis E. Osteonectin-null mutation compromises osteoblast formation, maturation, and survival. Endocrinology. 2003;144:2588–2596. doi: 10.1210/en.2002-221044. [DOI] [PubMed] [Google Scholar]
- 9.Essayem S, Kovacic-Milivojevic B, Baumbusch C, McDonagh S, Dolganov G, Howerton K, Larocque N, Mauro T, Ramirez A, Ramos DM, Fisher SJ, Jorcano JL, Beggs HE, Reichardt LF, Ilic D. Hair cycle and wound healing in mice with a keratinocyte-restricted deletion of FAK. Oncogene. 2006;25:1081–1089. doi: 10.1038/sj.onc.1209130. [DOI] [PMC free article] [PubMed] [Google Scholar]
- 10.Globus RK, Doty SB, Lull JC, Holmuhamedov E, Humphries MJ, Damsky CH. Fibronectin is a survival factor for differentiated osteoblasts. J.Cell Sci. 1998;111(Pt 10):1385–1393. doi: 10.1242/jcs.111.10.1385. [DOI] [PubMed] [Google Scholar]
- 11.Globus RK, Moursi A, Zimmerman D, Lull J, Damsky C. Integrin-extracellular matrix interactions in connective tissue remodeling and osteoblast differentiation. ASGSB.Bull. 1995;8:19–28. [PubMed] [Google Scholar]
- 12.Gospodarowicz D. Preparation of extracellular matrices produced by cultured bovine corneal endothelial cells and PF-HR-9 endodermal cells: Their use in cell culture. In: Barnes DW, Sirbasku DA, Stau GH, editors. Methods for Preparation of Media, Supplements, and Substrata. Alan R. Liss, Inc.; New York: 1984. pp. 275–293. [Google Scholar]
- 13.Grayson WL, Ma T, Bunnell B. Human mesenchymal stem cells tissue development in 3D PET matrices. Biotechnol.Prog. 2004;20:905–912. doi: 10.1021/bp034296z. [DOI] [PubMed] [Google Scholar]
- 14.Hai CM, Gu Z. Caldesmon phosphorylation in actin cytoskeletal remodeling. Eur. J. Cell Biol. 2006;85:305–9. doi: 10.1016/j.ejcb.2005.08.008. [DOI] [PubMed] [Google Scholar]
- 15.Harumiya S, Gibson MA, Koshihara Y. Antisense suppression of collagen VI synthesis results in reduced expression of collagen I in normal human osteoblast-like cells. Biosci.Biotechnol.Biochem. 2002;66:2743–2747. doi: 10.1271/bbb.66.2743. [DOI] [PubMed] [Google Scholar]
- 16.Ishibashi H, Harumiya S, Koshihara Y. Involvement of type VI collagen in interleukin-4-induced mineralization by human osteoblast-like cells in vitro. Biochim.Biophys.Acta. 1999;1472:153–164. doi: 10.1016/s0304-4165(99)00115-4. [DOI] [PubMed] [Google Scholar]
- 17.Jaiswal RK, Jaiswal N, Bruder SP, Mbalaviele G, Marshak DR, Pittenger MF. Adult human mesenchymal stem cell differentiation to the osteogenic or adipogenic lineage is regulated by mitogen-activated protein kinase. J.Biol.Chem. 2000;275:9645–9652. doi: 10.1074/jbc.275.13.9645. [DOI] [PubMed] [Google Scholar]
- 18.Kelm RJ, Jr., Mann KG. The collagen binding specificity of bone and platelet osteonectin is related to differences in glycosylation. J.Biol.Chem. 1991;266:9632–9639. [PubMed] [Google Scholar]
- 19.Kingsley K, Carroll K, Huff JL, Plopper GE. Photobleaching of arterial autofluorescence for immunofluorescence applications. Biotechniques. 2001;30:794–797. doi: 10.2144/01304st05. [DOI] [PubMed] [Google Scholar]
- 20.Kingsley K, Huff JL, Rust WL, Carroll K, Martinez AM, Fitchmun M, Plopper GE. ERK1/2 mediates PDGF-BB stimulated vascular smooth muscle cell proliferation and migration on laminin-5. Biochem.Biophys.Res.Commun. 2002a;293:1000–1006. doi: 10.1016/S0006-291X(02)00331-5. [DOI] [PubMed] [Google Scholar]
- 21.Kingsley K, Rust WL, Huff JL, Smith RC, Plopper GE. PDGF-BB enhances expression of, and reduces adhesion to, laminin-5 in vascular smooth muscle cells. Biochem.Biophys.Res.Commun. 2002b;294:1017–1022. doi: 10.1016/S0006-291X(02)00592-2. [DOI] [PubMed] [Google Scholar]
- 22.Klees RF, Salasznyk RM, Kingsley K, Williams WA, Boskey A, Plopper GE. Laminin-5 induces osteogenic gene expression in human mesenchymal stem cells through an ERK-dependent pathway. Mol.Biol.Cell. 2005;16:881–890. doi: 10.1091/mbc.E04-08-0695. [DOI] [PMC free article] [PubMed] [Google Scholar]
- 23.Koga T, Matsui Y, Asagiri M, Kodama T, de Crombrugghe B, Nakashima K, Takayanagi H. NFAT and Osterix cooperatively regulate bone formation. Nat.Med. 2005;11:880–885. doi: 10.1038/nm1270. [DOI] [PubMed] [Google Scholar]
- 24.Kratchmarova I, Blagoev B, Haack-Sorensen M, Kassem M, Mann M. Mechanism of divergent growth factor effects in mesenchymal stem cell differentiation. Science. 2005;308:1472–1477. doi: 10.1126/science.1107627. [DOI] [PubMed] [Google Scholar]
- 25.Malinda KM, Kleinman HK. The laminins. Int.J.Biochem.Cell Biol. 1996;28:957–959. doi: 10.1016/1357-2725(96)00042-8. [DOI] [PubMed] [Google Scholar]
- 26.McLean GW, Komiyama NH, Serrels B, Asano H, Reynolds L, Contri F, Hodivala-Dilke K, Metzger D, Chambon P, Grant SG, Frame MC. Specific deletion of focal adhesion kinase suppresses tumor formation and blocks malignant progression. Genes Dev. 2004;18:2998–3003. doi: 10.1101/gad.316304. [DOI] [PMC free article] [PubMed] [Google Scholar]
- 27.Moursi AM, Damsky CH, Lull J, Zimmerman D, Doty SB, Aota S, Globus RK. Fibronectin regulates calvarial osteoblast differentiation. J.Cell Sci. 1996;109(Pt 6):1369–1380. doi: 10.1242/jcs.109.6.1369. [DOI] [PubMed] [Google Scholar]
- 28.Nordahl J, Mengarelli-Widholm S, Hultenby K, Reinholt FP. Ultrastructural immunolocalization of fibronectin in epiphyseal and metaphyseal bone of young rats. Calcif.Tissue Int. 1995;57:442–449. doi: 10.1007/BF00301948. [DOI] [PubMed] [Google Scholar]
- 29.Ogura N, Kawada M, Chang WJ, Zhang Q, Lee SY, Kondoh T, Abiko Y. Differentiation of the human mesenchymal stem cells derived from bone marrow and enhancement of cell attachment by fibronectin. J.Oral Sci. 2004;46:207–213. doi: 10.2334/josnusd.46.207. [DOI] [PubMed] [Google Scholar]
- 30.Pistone M, Sanguineti C, Federici A, Sanguineti F, Defilippi P, Santolini F, Querze G, Marchisio PC, Manduca P. Integrin synthesis and utilization in cultured human osteoblasts. Cell Biol.Int. 1996;20:471–479. doi: 10.1006/cbir.1996.0062. [DOI] [PubMed] [Google Scholar]
- 31.Pittenger MF, Mackay AM, Beck SC, Jaiswal RK, Douglas R, Mosca JD, Moorman MA, Simonetti DW, Craig S, Marshak DR. Multilineage potential of adult human mesenchymal stem cells. Science. 1999;284:143–147. doi: 10.1126/science.284.5411.143. [DOI] [PubMed] [Google Scholar]
- 32.Pittenger MF, Martin BJ. Mesenchymal stem cells and their potential as cardiac therapeutics. Circ.Res. 2004;95:9–20. doi: 10.1161/01.RES.0000135902.99383.6f. [DOI] [PubMed] [Google Scholar]
- 33.Plotkin H. Syndromes with congenital brittle bones. BMC.Pediatr. 2004;4:16. doi: 10.1186/1471-2431-4-16. [DOI] [PMC free article] [PubMed] [Google Scholar]
- 34.Riancho JA, Gonzalez-Marcias J, Amado JA, Olmos JM, Fernandez-Luna JL. Interleukin-4 as a bone regulatory factor: effects on murine osteoblast-like cells. J.Endocrinol.Invest. 1995;18:174–179. doi: 10.1007/BF03347799. [DOI] [PubMed] [Google Scholar]
- 35.Roche P, Rousselle P, Lissitzky JC, Delmas PD, Malaval L. Isoform-specific attachment of osteoprogenitors to laminins: mapping to the short arms of laminin-1. Exp.Cell Res. 1999;250:465–474. doi: 10.1006/excr.1999.4518. [DOI] [PubMed] [Google Scholar]
- 36.Romberg RW, Werness PG, Lollar P, Riggs BL, Mann KG. Isolation and characterization of native adult osteonectin. J.Biol.Chem. 1985;260:2728–2736. [PubMed] [Google Scholar]
- 37.Romberg RW, Werness PG, Riggs BL, Mann KG. Inhibition of hydroxyapatite crystal growth by bone-specific and other calcium-binding proteins. Biochemistry. 1986;25:1176–1180. doi: 10.1021/bi00353a035. [DOI] [PubMed] [Google Scholar]
- 38.Salasznyk RM, Klees RF, Hughlock MK, Plopper GE. ERK signaling pathways regulate the osteogenic differentiation of human mesenchymal stem cells on collagen I and vitronectin. Cell Commun.Adhes. 2004a;11:137–153. doi: 10.1080/15419060500242836. [DOI] [PubMed] [Google Scholar]
- 39.Salasznyk RM, Klees RF, Westcott AM, Vandenberg S, Bennett K, Plopper GE. Focusing of gene expression as the basis of stem cell differentiation. Stem Cells Dev. 2005a;14:608–620. doi: 10.1089/scd.2005.14.608. [DOI] [PubMed] [Google Scholar]
- 40.Salasznyk RM, Westcott AM, Klees RF, Ward DF, Xiang Z, Vandenberg S, Bennett K, Plopper GE. Comparing the protein expression profiles of human mesenchymal stem cells and human osteoblasts using gene ontologies. Stem Cells Dev. 2005b;14:354–366. doi: 10.1089/scd.2005.14.354. [DOI] [PubMed] [Google Scholar]
- 41.Salasznyk RM, Williams WA, Boskey A, Batorsky A, Plopper GE. Adhesion to Vitronectin and Collagen I Promotes Osteogenic Differentiation of Human Mesenchymal Stem Cells. J.Biomed.Biotechnol. 2004b;200424:34. doi: 10.1155/S1110724304306017. [DOI] [PMC free article] [PubMed] [Google Scholar]
- 42.Siler U, Rousselle P, Muller CA, Klein G. Laminin gamma2 chain as a stromal cell marker of the human bone marrow microenvironment. Br.J.Haematol. 2002;119:212–220. doi: 10.1046/j.1365-2141.2002.03800.x. [DOI] [PubMed] [Google Scholar]
- 43.Stanley KT, VanDort C, Motyl C, Endres J, Fox DA. Immunocompetent properties of human osteoblasts: interactions with T lymphocytes. J.Bone Miner.Res. 2006;21:29–36. doi: 10.1359/JBMR.051004. [DOI] [PubMed] [Google Scholar]
- 44.Ueno K, Katayama T, Miyamoto T, Koshihara Y. Interleukin-4 enhances in vitro mineralization in human osteoblast-like cells. Biochem.Biophys.Res.Commun. 1992;189:1521–1526. doi: 10.1016/0006-291x(92)90248-j. [DOI] [PubMed] [Google Scholar]
- 45.Wang D, Park JS, Chu JS, Krakowski A, Luo K, Chen DJ, Li S. Proteomic profiling of bone marrow mesenchymal stem cells upon transforming growth factor beta1 stimulation. J.Biol.Chem. 2004;279:43725–43734. doi: 10.1074/jbc.M407368200. [DOI] [PubMed] [Google Scholar]
- 46.Westhoff MA, Serrels B, Fincham VJ, Frame MC, Carragher NO. SRC-mediated phosphorylation of focal adhesion kinase couples actin and adhesion dynamics to survival signaling. Mol Cell Biol. 2004;24:8113–33. doi: 10.1128/MCB.24.18.8113-8133.2004. [DOI] [PMC free article] [PubMed] [Google Scholar]
- 47.Zayzafoon M. Calcium/calmodulin signaling controls osteoblast growth and differentiation. J.Cell Biochem. 2006;97:56–70. doi: 10.1002/jcb.20675. [DOI] [PubMed] [Google Scholar]