Abstract
Transition path sampling has been applied to the molecular dynamics of the alanine dipeptide in vacuum and in aqueous solution. The analysis shows that more degrees of freedom than the traditional dihedral angles, φ and ψ, are necessary to describe the reaction coordinates for isomerization of this molecule. In vacuum, an additional dihedral angle is identified as significant. In solution, solvent variables are shown to play a significant role, and this role appears to be more specific than can be captured by friction models. Implications for larger molecules are discussed.
This paper concerns the dynamical variables relevant to kinetics of biomolecular isomerization. The backbone dihedral angles ψ and φ do serve well as order parameters characterizing the stable isomeric states of polypeptides (1). This fact does not, however, imply that ψ and φ are satisfactory for describing the dynamics of transitions between these states. Indeed, for large enough molecules, clustering of hydrophobic units can lead to drying (2, 3). The nucleation of this phenomenon manifestly involves motion of solvent. On the smaller length scales characterizing side-chain motions, effects from solvent are apparent as well (4). On these scales, it often is assumed that the dynamical role of secondary variables can be captured implicitly, through the mean forces on angles like ψ and φ and through friction and random local forces (5). We test this idea in this paper through the analysis of trajectories of the alanine dipeptide in vacuum and aqueous solution. We establish that other variables in addition to φ and ψ are important. Most significantly, we find that solvent degrees of freedom are relevant components to the reaction coordinates for isomerization. Although the dipeptide is a relatively simple molecule, our findings would seem to carry over to the small-length scale motions of more complex biopolymers. Specifically, our results suggest the inadequacy of implicit solvent models for treating the dynamical effects of solvation. Although implicit solvent models can be used to calculate averaged solvent effects, such models are not able to describe a possibly important rearrangement of individual solvent molecules occurring during a transition correctly.
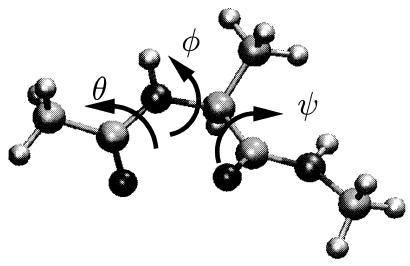
Fig. 1 illustrates the ball and stick model and the important dihedral angles of the alanine dipeptide. This molecule often is studied in theoretical work (6–13) because it is among the simplest systems to exhibit some of the important features common to biomolecules. It has the basic elements of a polypeptide backbone with more than one long-lived conformational state. It forms hydrogen bonds with water in aqueous solution. This bonding or solvation in general is responsible for the stability of one of the conformers. The molecule in vacuum has two stable conformers: the C7eq state with φ ≈ −86° and ψ ≈ 68° and the Cax state with φ ≈ 50° and ψ ≈ −50°. In solution, these positions shift slightly, for instance, the C7eq state is located around φ ≈ −80° and ψ ≈ 160°. In addition, two other states, αR and αL, become stable. The former state, αR, is one of the states considered here. It is located near φ ≈ −80° and ψ ≈ −30°.
Figure 1.
Schematic representation of the alanine dipeptide molecule (CH3-CONH-CHCH3-CONH-CH3). The backbone dihedral angles are labeled φ and ψ. The additional variable θ is the torsional angle O−C−N−Cα and is not to be confused with the dihedral angle ω Cα−C−N−Cα.
Transitions between these stable conformers are relatively rare events. For example, simulations indicate the time scale for the transition from C7eq to αR in solution is about a nanosecond (see below, and also refs. 12 and 13). Therefore, harvesting many examples of these transitions requires very long trajectories or some form of importance sampling. We have chosen the latter strategy. In particular, we have used the method of transition path sampling (14–16). This procedure is a Monte Carlo sampling of trajectory space. It is specifically designed to sample ensembles of trajectories connecting one basin of attraction to another. Transition path sampling can be applied to perform importance sampling in conjunction with any molecular dynamics routine (15, 17). Using it, no computational effort is wasted on the most common trajectories that simply move within one basin of attraction. In the studies reported on here, we have used transition path sampling in conjunction with the amber 5.0 simulation package (18). We have combined this sampling with statistical procedures to illuminate the nature of the transition states and reaction coordinates.
The most important of these procedures is the analysis of the commitment probability and its distribution (21). Every point in configuration space has a commitment probability or “committor.” For transitions from stable state A to stable state B, the committor PB is the probability that short trajectories initiated from that configuration with randomly chosen initial moments will reach state B. The transition state surface for A → B transitions are configurations where PB = PA ≈½ (19, 20). After harvesting, say, N trajectories from transition path sampling, the committor values can be computed for the configurations these trajectories visit. Each trajectory will pass through the PB ≈½ surface (the separatrix) one or more times. (For the alanine dipeptide, multiple crossings are common, as discussed below.) Thus, N trajectories provide N or more examples of transition state configurations, N or more members of the transition state ensemble.
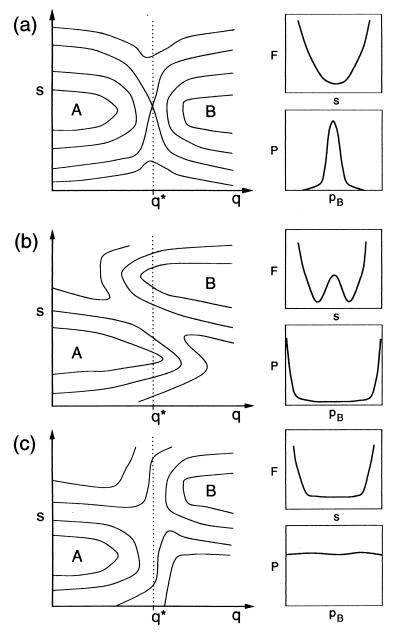
The concept of the committor is especially useful for high-dimensional systems where it is generally difficult to characterize the transition state surface with a few simple dynamical variables. In that case, computing the distribution of PB can test a hypothetical characterization (21). An accurate characterization will have a narrow distribution peaked near PB = ½. Fig. 2 illustrates this point and what can be inferred from different shapes of commitment probability distributions. Fig. 2 depicts three examples of an energy or free energy landscape V(q,s) and corresponding committor distributions. Here, q represents the coordinate(s) chosen as order parameter(s) to characterize stable states. For the alanine dipeptide, it would represent the dihedral angles φ and ψ. The variable s denotes other coordinates that may affect the dynamics of transitions but are unknown or unspecified. For the alanine dipeptide, s would correspond to configurations of the solvent and to the angle θ shown in Fig. 1. In each case, the reduced free energy as a function of only q has a maximum at q*. When the order parameters also serve as reasonable reaction coordinates, this maximum will coincide with the transition state for A → B transitions. The case shown in Fig. 2a illustrates this situation. In that case, V(q*,s) has a single narrow minimum as a function of s. For an ensemble of configurations constrained at q = q*, the resulting commitment probability distribution, P(PB), is peaked at PB = ½. Transitions on such a free energy landscape can be accurately modeled by assuming that q evolves according to a Langevin equation where the other degrees of freedom create friction and provide the activation energy necessary to cross the barrier.
Figure 2.
Three different potential or free energy landscapes, V(q,s), and their corresponding committor distributions, P(pB) leading to qualitatively different distributions of pB.
In contrast, Fig. 2b illustrates the case where V(q*,s) is a bistable function of s. Here, the transition requires activation of s as well as q. In this case, a configuration with q = q* is most likely to be committed to one or the other of the stable states. Therefore, the distribution of PB will have two peaks, one at PB = 0 and the other at PB = 1. Such behavior has been found for the dissociation of an ion pair in water, where the order parameter q was taken as the separation between ions and the other coordinates, s, involved reorganization of neighboring solvent (21). A similar perspective is adopted in the so-called “frozen bath assumption” in which the position and the height of the barrier are modulated by solvent fluctuations (see e.g., refs. 22–24). However, when frozen, the solvent has no opportunity to reorganize during the transition, as opposed to the behavior found in our case.
Another contrasting possibility is shown in Fig. 2c. In this case, a relatively broad free energy ridge separates states A and B for q = q*. Here, motion involving s will be diffusive and largely unbiased so that PB changes linearly with the distance from the basin of attraction of B. This behavior leads to a uniform distribution of PB. Depending on conditions, both the behavior in Fig. 2 b and c have been found but not that in Fig. 2a, where φ and ψ alone serve well as reaction coordinates.
Alanine Dipeptide in Vacuum
System and Simulation Details.
In this case, the system studied in our calculations consists of the full atom representation of an alanine dipeptide molecule modeled with the amber 94 force field (18, 25). Molecular dynamics simulations were performed with several modules of the amber 5.0 (18) package by using the amber force field (18, 25). For the path sampling simulation we developed an interface with the spasms (25) module of the amber package. Straightforward molecular dynamics and equilibration was done with the sander module (25). Potential of mean force calculations were performed with the gibbs module (25). We used a time step of 1 fs. All bonds involving hydrogen were constrained to a fixed length by using the shake or rattle algorithm (26, 27) with a relative tolerance of 10-6. The simulations mentioned in this section took about 700 h of computer time on a single processor workstation.
Stable States and Transition Path Lengths.
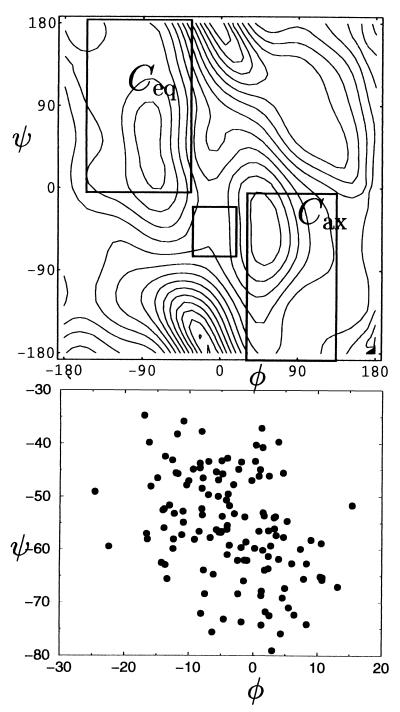
Fig. 3 shows the energy landscape as a function of the usual backbone dihedral angles φ and ψ. The two basins of attraction, corresponding to the two stable states, C7eq and Cax, are separated by two saddle points. Our transition path sampling calculations suggest a plateau time slightly above 1 ps for the pathways from C7eq and Cax. The plateau time is the time needed for the reactive flux correlation function to reach its exponential behavior, in the sense discussed in ref. 15. This finding implies that two state unimolecular kinetics governs conformational relaxation for time scales greater than 1 ps. Further, trajectories of 1 ps in length are sufficiently long to capture the characteristics of pathways connecting the stable states. We chose to focus our study on the transition paths passing near the saddle point at φ = 0°, ψ = −60° (7). The configuration space corresponding to the C7eq state is taken to be −150° < φ < −30° and 0° < ψ < 180°. The space corresponding to the Cax state is taken to be 30° < φ < 130° and −180° < ψ < 0°. The energy of the saddle point relative to the minimum of the C7eq is about E = 6.66 kcal/mol. The relative minimum energy of the Cax state is about E = 1.47 kcal/mol.
Figure 3.
Potential energy landscape of alanine dipeptide in vacuum as a function of the dihedral angles φ and ψ as constructed from the amber force field (18) by constraining φ and ψ and minimizing the energy. The contours are drawn at multiples of 2 kcal/mol above the C7eq minimum. The large rectangles indicate the stable states. (Lower) The transition state ensemble for the pathways from Cax to C7eq is shown as an enlargement of the square region at the saddle point region (Upper).
Path Sampling.
We studied the dynamics of the isomerization in vacuum by sampling transition paths with the shooting and shifting algorithm described in refs. 14 and 15. To ensure that the generating probability in a shooting move is symmetric with respect to creating a new path from an old one, and the reverse move, we chose the momentum displacements from a Gaussian distribution. This choice is complicated by constraints imposed on the system, such as constant total energy, constant total linear momentum, and fixed bond lengths. The method we used for implementing the choice of new momenta, where detailed balance is obtained without violating the constraints, is similar to that detailed in ref. 28. In the present work, a shooting move first augments the velocities of all particles by a small random vector selected from a Gaussian distribution with width σi∝ 1/ , where mi is the mass of particle i. This choice is imposed by the fact that the microcanonical distribution is isotropic in mass weighted velocity space but not in momentum space. Next, we performed the velocity update step of the rattle procedure (26), which removes velocity components along the bonds with fixed length. The last step is to remove the center of mass motion and rescale the velocities to obtain the original kinetic energy of the system. This operation conserves the isotropic distribution of the velocity displacement, and thus satisfies detailed balance. To improve sampling, we limited the choice of points on the path from which shooting can take place to configurations that lie outside both C7eq and Cax. The bias introduced in this way is accounted for in acceptance criteria to ensure detailed balance.
An initial path was created starting from a configuration close to the saddle point and running trajectories in forward and backward time directions. By carrying out this step at relatively high temperature, the trajectories were undeterred by barriers associated with variables other than φ and ψ, and thus an initial trajectory connecting the stable states was quickly obtained. During the subsequent random walk through trajectory space, momenta gradually were adjusted to reach ensembles with kinetic energy corresponding to 300 K. An ensemble of transition pathways of 1 ps in length then was collected. The state of the system (positions and velocities of all particles) was stored every 10 fs during the calculation of a molecular dynamics trajectory, resulting in 100 time slices. In total, 100,000 shooting moves were attempted. To get an acceptance ratio of about 50% the maximum change in the mass weighted velocity of a particle during a shooting move was  Δv = 0.4 Å ps-1⋅amu1/2. After 100 trial moves a path was considered uncorrelated and was saved for later analysis. A total of 1,000 uncorrelated paths were collected in this way.
Transition State Ensemble.
Typically, complex systems are dense in saddle points. Therefore, it is usually not practical and generally not useful to identify and enumerate all saddle points on the potential energy surface. For complex systems, transition states are not necessarily identified with such saddle points. Instead, one should consider ensembles of transition states. As indicated earlier, this transition state ensemble can be computed from the ensemble of harvested transition paths by determining the committor for configurations visited by a transition trajectory. We have done so by starting 100 1-ps trajectories from every stored time slice on 100 paths. A configuration for which the commitment probability, PCax, is ½ is considered a member of the transition state ensemble. The resulting ensemble is plotted in the φ,ψ plane in Fig. 3. The breadth of the distribution indicates that there is an additional degree of freedom important in this particular transition.
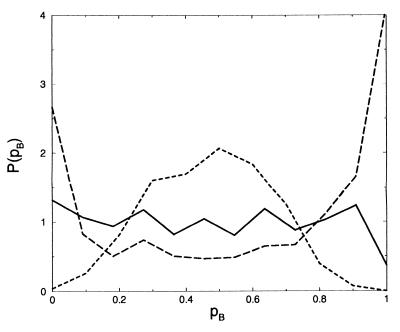
To investigate the extent to which another variable might be important, we computed the commitment probability distribution for constrained ensembles. The constrained ensembles were obtained with the gibbs module of the amber package, in which the constraint was imposed by using the shake algorithm. The total energy was equal to that of an equilibrium system at T = 298 K. First, we constrained only the dihedral angle φ to a value of φ = 0°, corresponding to the top of its free energy barrier. For this ensemble, the committor distribution is shown in Fig. 4. The distribution is rather uniform, indicating diffusive behavior along another degree of freedom (compare Fig. 2c). Constraining the other major backbone dihedral angle ψ as well to its free energy maximum, ψ = −40°, gave a similarly flat distribution. Lowering the total energy of the system to the corresponding temperature T ≈ 50 K makes the committor distribution have two peaks, one around pCax = 0 and the other pCax = 1. This bimodal distribution reveals an additional small barrier orthogonal to φ and ψ. At the temperature of 300 K, this barrier is of negligible height and is crossed diffusively.
Figure 4.
Commitment probability distributions for constrained ensembles of the alanine dipeptide in vacuum. The solid line corresponds to the distribution for φ = 0° and ψ = −40° for total energy with an average kinetic energy corresponding to T = 300 K, the dotted line for φ = 0° and ψ = −40 for T = 50 K, and the dashed line for φ = 0°, ψ = −40°, and θ = 3.6° at T = 300 K.
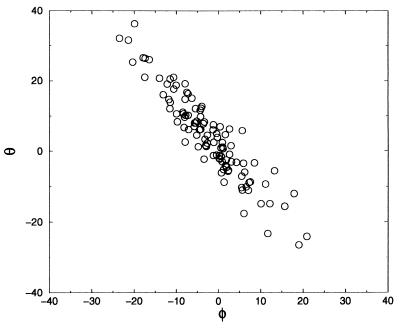
The constrained ensemble with φ = 0 can be partitioned into three sub-ensembles, one corresponding to those configurations with pCax near 0, another with pCax near ½, and another with pCax near 1. Comparing structures in these three sub-ensembles can reveal other important variables (21). This variable is the O-C-N-Cα torsional angle, denoted as θ in Fig. 1. For θ ≈ −12° ± 5°, we found that the system is committed to stable state C7eq; for θ ≈ 20° ± 6°, we found that the system is committed to the Cax stable region. On the other hand, θ ≈ 3.6° ± 4° coincides with pCax = 0.5. When constraining all three important dihedrals, φ = 0°, ψ = −40°, and θ = 3.6, the committor distribution is peaked around 0.5 (see Fig. 4), proving that the barrier separating C7eq from Cax involves a systematic, albeit small, change of the dihedral angle θ. In Fig. 5 the transition state ensemble is shown as a function of the dihedral angles φ and θ. It falls roughly on a straight line that can be approximately identified with the dividing surface. As a corollary to this finding, the dihedral angle ψ plays a minor role in the transition in vacuum.
Figure 5.
The transition state ensemble in vacuum plotted in the φ-θ plane.
These results shows that for an isomerization in vacuum, the usual order parameters ψ and φ are insufficient for predicting the dynamic pathways of the transition. On the other hand, the angles φ and θ provide a reasonable approximation to the reaction coordinate.
Alanine Dipeptide in Water
System and Simulation Details.
As in the previous section, the system consists of the full atom representation of an alanine dipeptide molecule modeled with the amber 94 force field (18, 25), except now the alanine dipeptide is solvated by 198 TIP3P water molecules (29) in a periodic box. Unless otherwise stated, the simulation details are identical to those described in the previous section. A solvated configuration was prepared at lower density, slowly heated to 300 K, and compressed to 1 g/ml followed by equilibration for 100 ps. After compression, the cubic box had side lengths of about 18.4 Å. We used a cutoff distance of 8.5 Å for the nonbonded interactions together with a switch function to conserve energy. More accurate, but more expensive, Ewald summations were not used because we believe the treatment of long-range forces are not important for the qualitative dynamical issues of interest in this work. The computer time spent to obtain the results mentioned in this section was around 2,000 processor hours for the transition path sampling, 4,000 processor hours for the rate constant calculation, 4,000 processor hours for the transition state ensemble, and 1,000 processor hours for the constrained ensemble (Cray-T3E).
Stable States and Potential of Mean Force.
The alanine dipeptide exhibits more than two stable states when dissolved in water, the two most stable being the C7eq and αR states cite (7–12). The backbone dihedral angles φ and ψ continue to serve as discriminating order parameters for these states. In the present work, we focus on the transition between the two most stable states.
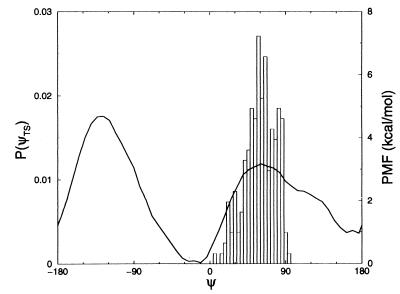
With straightforward molecular dynamics simulation, we located the αR and C7eq configurations, which are centered at ψ ≈ −30°, φ ≈ −80°, and ψ ≈ 160°, φ ≈ −80°, respectively. Subsequently, we calculated the potential of mean force as a function of the dihedral angle ψ. We calculated the force on the dihedral angle ψ for 50 values, equally spaced over the range from −180° to 180°. During the whole simulation the angle φ stayed in the range −180° < φ < 0°. For every value of ψ, we equilibrated the system for 4 ps after which 46 ps of data collection followed. Integration of the average force yields the potential of mean force plotted in Fig. 6.
Figure 6.
Potential of mean force (PMF) of alanine dipeptide in water as a function of dihedral angle ψ. The two minima at ψ = −20° and ψ = 165° correspond to the αR and C7eq stable states, respectively. The histogram represents the distribution of ψ in the transition state ensemble.
The two stable states are separated by a barrier of about 4 kcal/mol at ψ = −130° and a lower barrier of about 2 kcal/mol at ψ = 60°. Although these results are similar to those reported in the literature (8–10), there are two significant differences. First, we find that the free energy of state C7eq is 1 kcal/mol higher than that of αR, whereas previous studies found the opposite result. Second, the minima of the potential of mean force are shifted to higher values by about 30° with respect to those in the literature. Presumably, these relatively small differences are caused by the fact that we use a full atom model instead of the united atom representation and use the amber force field instead of the charmm force field site (30).
Path Sampling.
We define the stable state αR region with the boundaries −150° < ψ < 0°, −180° < φ < 0°; similarly, we define the stable state C7eq region with the boundaries 100° < ψ < 180°, −180° < φ < 0°. Taking a configuration corresponding to the top of the potential of mean force barrier, we started trajectories with randomized velocities and integrating forward and backward in time. A trajectory that connected the two regions thus was obtained and taken as an initial trajectory for transition path sampling. The length of the trajectories sampled in this way was 3 ps. By calculating the frequency factor ν(t), defined in refs. 14 and 15, we established that the time required to reach the plateau regime of a reactive flux correlation function is about 2 ps. The state of the system (positions and velocities of all particles) was stored every 30 fs during the calculation of a molecular dynamics trajectory, resulting in 100 time slices. To obtain a reasonable acceptance ratio, when performing shooting moves, the maximum change in the mass weighted particle velocities was  Δv = 0.01 Å ps−1⋅amu1/2. This value is far smaller than in the vacuum case, indicating that trajectories in solution are more likely to recross the dividing surface than those in vacuum, and the motion in solution is more diffusive than that in vacuum.
The total system energy was chosen such that the average kinetic energy corresponds to a temperature of approximately 300 K. The total number of attempted shooting moves was 25,600, 30 of which were accepted. After 100 trial moves a path was considered uncorrelated and was saved for later analysis. A total of 256 uncorrelated paths were collected. Using the methods described in detail in refs. 15 and 16 we calculated the rate constant, k, for transitions from C7eq to αR and obtained k = 10 ns−1.
Transition State Ensemble.
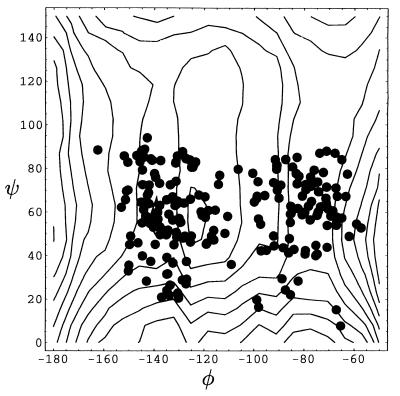
Configurations from the transition state ensemble determined from 120 paths for the transition from C7eq to αR are projected onto the φ-ψ plane in Fig. 7. We shall see that the broadness of the ensemble indicates an important role of solvent dynamics in the transitions. This fact is also evident in Fig. 6, where the distribution of ψ at the transition state is superimposed onto the potential of mean force. Transition states exist even in regions far from the top of the free energy barrier at ψ = 60°. Fig. 7 shows a clustering of transition state configurations in two reasonably distinct sets. Thus, transitions occurs via two different pathways, characterized by the average dihedral angles of (φ,ψ) ≈ (−135°, 60°) and (φ,ψ) ≈ (−80°, 60°). Similar pathways were inferred in ref. 7 from a free energy landscape.
Figure 7.
Location of transition states in the φ-ψ plane. The lines represent the equipotential of mean force lines in the transition state region and are drawn at 0.25-kcal/mol intervals.
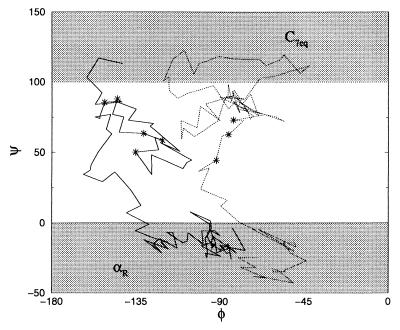
More than 30% of the trajectories obtained from the path sampling exhibit three or more crossings of the transition state surface (where the committor, pC7eq, is ½). Recrossings on a single trajectory are separated by as much as 0.8 ps. In Fig. 8, we show two of the paths with more than one transition state. One of the 120 trajectories crossed seven times. In contrast, only 5% of the transition paths collected for the dipeptide in vacuum exhibited recrossings, and these recrossings were separated by less than 80 fs. Clearly, relative to its behavior in vacuum, the transition dynamics in solution is highly diffusive.
Figure 8.
Two typical pathways plotted in the φ-ψ plane. The transition states are indicated by *. The jaggedness of the paths is caused by the fact that we kept only information from a discrete number of time slices.
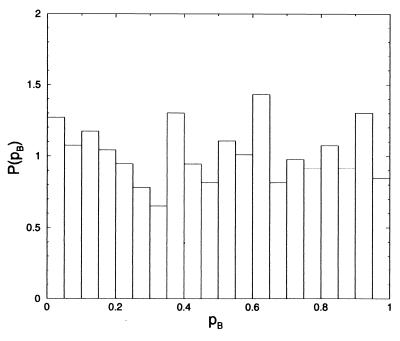
To further assess the role of solvent, we computed the commitment probability distribution for the ensemble of states confined to the free energy barrier top at ψ = 60°. Specifically, a constrained molecular dynamics simulation with ψ fixed at 60° was carried out with the gibbs module of the amber package, where the constraint was imposed by using shake. Every picosecond a configuration was saved. For each of these configurations pB was calculated by shooting off 50 1-ps trajectories with random momenta selected from an appropriate distribution at constant energy, as described in the previous section and in ref. 28. The resulting distribution of pC7eq is shown in Fig. 9. It is almost uniform, indicating a configuration on the top of the ψ free energy barrier is as likely to be committed to one of the stable states (pC7eq = 0 or pC7eq = 1) as it is to be a transition state (pC7eq = 0.5). Thus, the dihedral angle ψ is not adequate for describing the isomerization dynamics because a good reaction coordinate would lead to a distribution of pC7eq peaked at ½, as we showed in Fig. 2. After the procedure used when facing a similar finding for the dipeptide in vacuum, we partitioned the constrained ensemble into three sub-ensembles, with pC7eq near 0, 0.5, and 1, respectively. Unlike the vacuum case, however, these ensembles exhibited no significant differences in the distributions for the other two dihedral angles, φ and θ. We also found no significant differences in distributions of bond and torsional angles. The only reasonable conclusion is that the other variables, s in Fig. 2c, coincide with solvent motion. In other words, relevant solvent dynamics occurs on the same time scale as the isomerization. Interestingly, these motions are not simply correlated to either the number of hydrogen bonds or the solvent coordination number. We found that the three sub-ensembles have virtually identical distributions for these variables.
Figure 9.
Commitment probability distribution for configurations with ψ = 60°.
The implications of our findings for stochastic models of isomerization transitions in the dipeptide and more complex biomolecules seem sobering. Even in vacuum, an appropriate reaction coordinate is multidimensional and different from the traditional dihedral angles, φ and ψ. In solution, solvent degrees of freedom must be incorporated into the reaction coordinate. The identity of pertinent solvent variables, however, remains to be discovered. Using a single reaction coordinate in a stochastic description will not lead to the commitment probability distributions shown here. In fact, if there is only one reaction coordinate, a stochastic equation will lead to a single value of the committor and not a distribution. Coupling of additional degrees of freedom to the principal reaction coordinate is necessary to obtain the dynamical behaviors found in this study.
Acknowledgments
We thank Martin Karplus for encouraging us to search for reaction coordinates other than ψ and φ. This research was initiated with a Laboratory Directed Research and Development Program/National Energy Research Scientific Computing Center research grant at the Lawrence Berkeley National Laboratory, administered by the laboratory's Division of Chemical Sciences. It was completed with the support of U.S. Department of Energy Grant DE-FG03-99ER14987. Many of the calculations were performed on the National Energy Research Scientific Computing Center Cray-T3E at the Lawrence Berkeley National Laboratory.
Footnotes
Article published online before print: Proc. Natl. Acad. Sci. USA, 10.1073/pnas.100127697.
Article and publication date are at www.pnas.org/cgi/doi/10.1073/pnas.100127697
References
- 1.Flory P J. Statistical Mechanics of Chain Molecules. New York: Interscience; 1969. [Google Scholar]
- 2.Kauzmann W. Adv Protein Chem. 1959;14:1–63. doi: 10.1016/s0065-3233(08)60608-7. [DOI] [PubMed] [Google Scholar]
- 3.Lum K, Chandler D, Weeks J D. J Phys Chem B. 1999;103:4570–4577. [Google Scholar]
- 4.Northrup S H, Pear M R, Lee C, McCammon J A, Karplus M. Proc Natl Acad Sci USA. 1982;79:4035–4039. doi: 10.1073/pnas.79.13.4035. [DOI] [PMC free article] [PubMed] [Google Scholar]
- 5.Roux B, Simonson T. Biophys Chem. 1999;78:1–20. doi: 10.1016/s0301-4622(98)00226-9. [DOI] [PubMed] [Google Scholar]
- 6.Pettitt B M, Karplus M. Chem Phys Lett. 1985;121:194–201. [Google Scholar]
- 7.Apostolakis J, Ferrara P, Caflisch A. J Chem Phys. 1999;110:2099–2108. [Google Scholar]
- 8.Scarsi M, Apostolakis J, Caflisch A. J Phys Chem B. 1998;102:3637–3641. [Google Scholar]
- 9.Lazaridis T, Tobias D J, Brooks C L, Paulaitis M E. J Chem Phys. 1991;95:7612–7625. [Google Scholar]
- 10.Marrone T J, Gilson M K, McCammon J A. J Phys Chem. 1996;100:1439–1441. [Google Scholar]
- 11.Bartels C, Karplus M. J Comput Chem. 1997;18:1450–1462. [Google Scholar]
- 12.Smith P E. J Chem Phys. 1999;111:5568–5579. [Google Scholar]
- 13.Smith P E, Pettitt B M. J Phys Chem. 1993;97:6907–6913. [Google Scholar]
- 14.Dellago C, Bolhuis P G, Csajka F S, Chandler D. J Chem Phys. 1998;108:1964–1977. [Google Scholar]
- 15.Bolhuis P G, Dellago C, Chandler D. Faraday Discuss Chem Soc. 1998;110:421–436. [Google Scholar]
- 16.Dellago C, Bolhuis P G, Chandler D. J Chem Phys. 1999;110:6617–6625. [Google Scholar]
- 17.Geissler, P. L., Dellago, C., Chandler, D., Huter, J. & Parrinello, M. (2000) Chem. Phys. Lett., in press.
- 18.Case D A, Pearlman D A, Caldwell J W, Cheatham T E, III, Ross W S, Simmerling C L, Darden T A, Merz K M, Stanton R V, Cheng A L, et al. amber 5. San Francisco: Univ. of California; 1997. [Google Scholar]
- 19.Du R, Pande V S, Grosberg A Y, Tanaka T, Shaknovic E S. J Chem Phys. 1998;108:334–350. [Google Scholar]
- 20.Klosek M M, Matkowsky B J, Schuss Z. Ber Bunsenges Phys Chem. 1991;95:331–337. [Google Scholar]
- 21.Geissler P L, Dellago C, Chandler D. J Phys Chem B. 1999;103:3706–3710. [Google Scholar]
- 22.Rosenberg R O, Berne B J, Chandler D. Chem Phys Lett. 1980;75:162–168. [Google Scholar]
- 23.Gertner B J, Wilson K R, Hynes J T. J Chem Phys. 1989;90:3537–3558. [Google Scholar]
- 24.Neria E, Karplus M. Chem Phys Lett. 1997;267:23–30. [Google Scholar]
- 25.Pearlman D A, Case D A, Caldwell J W, Ross W S, Cheatham T E, DeBolt S, Ferguson D M, Seibel G, Kollman P. Comp Phys Commun. 1995;91:1–41. [Google Scholar]
- 26.Andersen H C. J Comput Phys. 1983;52:24–34. [Google Scholar]
- 27.Ryckaert J P, Ciccotti G, Berendsen H J C. J Comput Phys. 1977;23:327–341. [Google Scholar]
- 28.Geissler P L, Dellago D, Chandler D. Phys Chem Chem Phys. 1999;1:1317–1322. [Google Scholar]
- 29.Jorgensen W L, Chandrasekhar J, Madura J D, Impey R W, Klein M L. J Chem Phys. 1983;79:926–935. [Google Scholar]
- 30.Brooks B R, Bruccoleri R E, Olafson B D, States D J, Swaminathan S, Karplus M. J Comput Chem. 1983;4:187–217. [Google Scholar]


