

Abstract
The major structural elements of retroviruses are contained in a single polyprotein, Gag, which in human immunodeficiency virus type 1 (HIV-1) comprises the MA, CA, spacer peptide 1 (SP1), NC, SP2, and p6 polypeptides. In the immature HIV-1 virion, the domains of Gag are arranged radially with the N-terminal MA domain at the membrane and C-terminal NC-SP2-p6 region nearest to the center. Here, we report the three-dimensional structures of individual immature HIV-1 virions, as obtained by electron cryotomography. The concentric shells of the Gag polyprotein are clearly visible, and radial projections of the different Gag layers reveal patches of hexagonal order within the CA and SP1 shells. Averaging well-ordered unit cells leads to a model in which each CA hexamer is stabilized by a bundle of six SP1 helices. This model suggests why the SP1 spacer is essential for assembly of the Gag lattice and how cleavage between SP1 and CA acts as a structural switch controlling maturation.
Keywords: electron cryotomography, Gag, human immunodeficiency virus type 1 (HIV-1), spacer peptide 1 (SP1)
Introduction
Human immunodeficiency virus type 1 (HIV-1) assembly initiates when the viral Gag polyprotein begins to multimerize at the plasma membrane of an infected cell. Following assembly, the viral particle is released from the cell as a spherical, immature particle surrounded by a lipid bilayer (Freed, 1998). The unprocessed Gag polyprotein is composed of a series of distinct polypeptide segments, termed MA, CA, spacer peptide 1 (SP1), NC, SP2, and p6 that are arranged radially, with the N-terminal MA region at the membrane and the C-terminal NC-SP2-p6 region nearest to the center (Fuller et al, 1997; Wilk et al, 2001). As the virus buds, the viral protease (PR) is activated, leading to cleavage between each of the major domains of Gag (MA, CA, and NC), and resulting in the major structural changes referred to as ‘maturation.' During maturation, MA presumably remains bound to the membrane, while the processed CA subunits condense to form a central conical capsid that encases NC, the RNA genome, and other viral enzymes.
Much is already known about the structures, functions, and arrangements of the individual Gag domains within immature and mature virions. MA is cotranslationally myristoylated and serves to anchor Gag to the membrane (Massiah et al, 1994; Hill et al, 1996; Saad et al, 2006). MA helps to stabilize the Gag shell and recruit Env, but is not absolutely essential for viral assembly or even for replication in some contexts (Reil et al, 1998). CA is subdivided structurally into two domains (CA NTD and CA CTD). Like MA, the CA NTD is not absolutely required for assembly, whereas the CA CTD, SP1 spacer, and NC regions play essential roles in immature particle formation (Kräusslich et al, 1995; Borsetti et al, 1998; Accola et al, 2000; Alfadhli et al, 2005; Ako-Adjei et al, 2005). Electron microscopic projection images of immature virions have shown that the CA layers within the immature Gag lattice contain hexagonal order with a characteristic spacing of ∼8.0 nm (Nermut et al, 1998; Mayo et al, 2003; Briggs et al, 2004, 2006b). After maturation, CA again forms a hexagonal lattice, but this time within a conical capsid closed by 12 ‘pentamers,' and with a larger unit cell spacing (Li et al, 2000; Briggs et al, 2003; Ganser-Pornillos et al, 2004). SP1 plays an essential role in stabilizing the immature HIV-1 Gag lattice (Kräusslich et al, 1995; Accola et al, 1998; Gay et al, 1998; Liang et al, 2002). Analogous spacer peptides in other retroviral Gag proteins also play essential roles in immature particle assembly, indicating that the essential role of SP1 is likely to be conserved (Craven et al, 1993; Guo et al, 2004). In addition to its importance for immature particle assembly, SP1 also appears to function as a maturation ‘switch,' as the presence or absence of SP1 can dictate whether Gag constructs assemble into immature (SP1 present) or mature (SP1 absent) lattices (Accola et al, 1998; Gross et al, 2000). The HIV-1 SP1 polypeptide has been modeled as an α-helix (Accola et al, 1998; Morellet et al, 2005), although this model remains to be tested rigorously. The NC polypeptide encompasses two retroviral zinc-fingers and adjacent basic residues (D'Souza and Summers, 2005). NC again plays an essential role in immature particle assembly, and appears to help Gag subunits associate via RNA-mediated ‘tethering' interactions, and also possibly direct protein–protein interactions (Zhang et al, 1998; Accola et al, 2000; Cimarelli et al, 2000; Sandefur et al, 2000; Alfadhli et al, 2005). Finally, p6 binds cellular factors that facilitate viral release (Bieniasz, 2006), but is not required for viral assembly (Campbell et al, 2001).
A major challenge in HIV structural biology is that each virion is unique, so that while they all assemble with similar architectures, they have different sizes, numbers of Gag molecules, and detailed ultrastructures. Thus, crystallographic techniques are not applicable to intact viruses, and our present understanding of virion organization is therefore derived from standard electron microscope projection images of stained or frozen-hydrated samples. The advent of electron cryotomography has now made it possible, however, to obtain full three-dimensional reconstructions of unique, asymmetric objects such as HIV-1 (Lucic et al, 2005). Tomographic analyses of mature HIV-1 particles have previously been reported by our group and by others (Benjamin et al, 2005; Briggs et al, 2006a). Here, we report three-dimensional reconstructions of immature HIV-1 particles, as obtained by electron cryotomography. The concentric layers of Gag are clearly seen, as are distinct patches of hexagonal order in the CA and SP1 layers. Averaging unit cells in well-ordered regions leads to a proposal for the structure and role of SP1 in the immature Gag lattice and an explanation for how its cleavage from CA helps trigger maturation.
Results
(Please see the Supplementary Movie online for a summary presentation of the primary data, analyses, and interpretations.)
Electron cryotomography
Immature HIV-1 virions were produced using an R9 proviral expression vector containing inactivating point mutations to the PR, RT, and RNase H enzymes (Wyma et al, 2000; Benjamin et al, 2005). The PR mutations were used to arrest the virion in the immature state; and the RT and RNase H mutations further blocked viral infectivity without altering virion structure. Immature virions were harvested from the supernatant of 293T cells, transfected with the mutant R9 viral expression construct, and concentrated by pelleting through a sucrose cushion. The immature virions were then resuspended, dialyzed, and gently centrifuged to remove excess sucrose and other debris. Several viral preparations were analyzed to ensure the consistency of the results.
Solutions containing immature HIV-1 virions were plunge-frozen onto EM grids and imaged using a 300 kV FEG TEM. In addition to the immature HIV-1 virions, small vesicles and cellular debris were occasionally observed on the grids. Energy filtered tilt series were collected at defocus values ranging from 4 to 8 μm under focus and three-dimensional reconstructions were calculated. Immature virions were extracted from the tomograms and denoised with non-linear anisotropic diffusion. In all, 16 of the highest quality reconstructions were selected for further analysis based on the clarity of the virion and the surrounding ice, and on how well the images of the tilt series could be aligned.
Radial Gag shell structure
The diameters of the selected virions ranged from 115 to 140 nm with a mean of 127 nm, which is in good agreement with previous measurements (Fuller et al, 1997; Wilk et al, 2001). Env spikes were rare, but were sporadically observed on virion exteriors, and further analyses of their structures and positions are currently underway. The concentric shells of the Gag protein layers as well as the hexagonal lattice were clearly visible in slices through the tomograms (Figures 1B–D and 2). The Gag shell was not continuous around the diameter of any of the virions; instead substantial regions lacking ordered Gag were visible (Figures 1B and 2) The presence of ordered ‘sectors' of Gag separated by gaps had been observed previously in projection images of HIV-1 virions and Gag assemblies (Fuller et al, 1997; Wilk et al, 2001); what became evident in observing the virions in 3D was the surprisingly large size of the disordered regions. Above regions of the visibly ordered Gag lattice, the membrane-MA layer appeared bilaminar with a total thickness of 7.8 nm. Elsewhere, the membrane layer appeared unilaminar (i.e., the two leaflets of the lipid bilayer were not resolved) and was 4.8 nm thick. Radial density profiles of the virions revealed multiple peaks (Figure 3B), which were interpreted to be the membrane, MA, CA NTD, CA CTD, and NC domains following previous similar studies (Fuller et al, 1997; Wilk et al, 2001). MA appeared as a shoulder on the inside of the membrane peak. The peak-to-peak distances between the membrane-MA, CA NTD, CA CTD, and NC layers were 3.9, 4.5, and 3.0 nm, respectively, which again agreed well with previous measurements (Fuller et al, 1997; Wilk et al, 2001).
Figure 1.
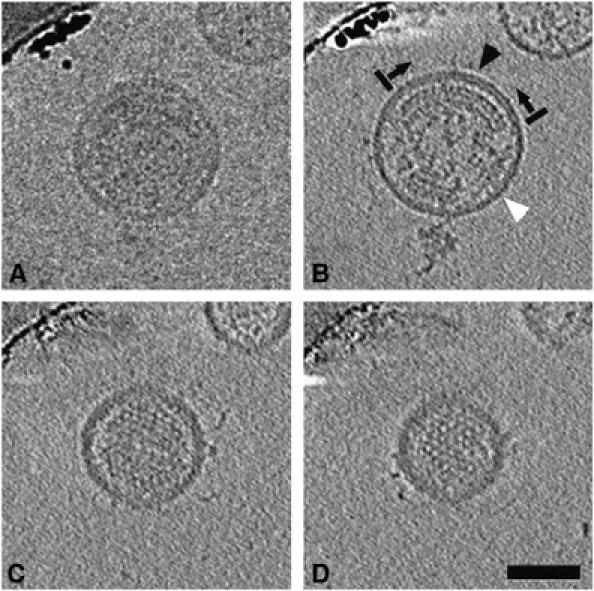
Example raw image and reconstruction. (A) The central image from a tilt series of an isolated immature HIV-1 virion suspended in vitreous ice. (B–D) Slices (5.6 nm) through the middle (B), quarter-plane (C), and near the top (D) of the resulting 3D reconstruction, showing visible order in the Gag lattice. In (B), there are large gaps in the ring of visibly ordered Gag lattice below the membrane (the boundaries of one ordered region are marked by black bars, with arrows pointing into the ordered region). Above regions of visibly ordered Gag lattice, the membrane-MA layer appears bilaminar (black arrowhead). Elsewhere, it appears unilaminar (white arrowhead). Scale bar 50 nm.
Figure 2.
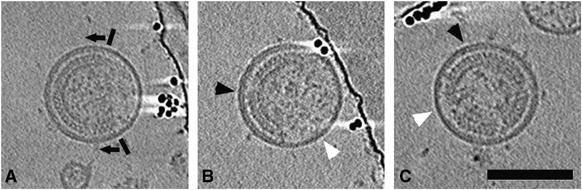
Discontinuities in the Gag lattice and associated changes in the membrane. Each panel is an 11 nm slice through the tomographic reconstruction of three different immature HIV-1 virions. In each case, there are large gaps in the ring of visibly ordered Gag lattice below the membrane (the boundaries of one ordered region are marked by black bars, with arrows pointing into the ordered region). Above regions of visibly ordered Gag lattice, the membrane-MA layer appears bilaminar (black arrowheads). Elsewhere, it appears unilaminar (white arrowheads). Scale bar 100 nm.
Figure 3.
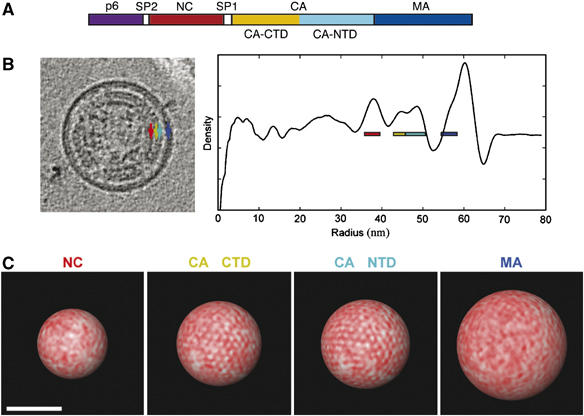
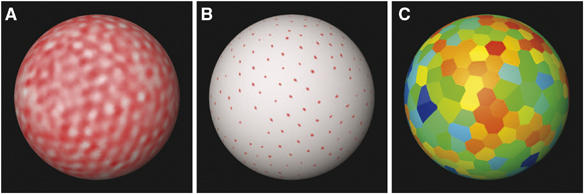
Diagram, radial density plot, and the packing arrangements in each layer of Gag. (A) Diagram of the Gag polyprotein (from left to right: MA (blue), CA NTD (cyan), CA CTD (yellow), SP1 (white), NC (red), SP2 (white), and p6 (purple)). (B) (left): 11 nm slice through the reconstruction of an immature virion. The arrows point to the NC (red), CA CTD (yellow), CA NTD (cyan), and MA (blue) layers of the Gag lattice. (B) (right): average radial density plot calculated from solid angles where the Gag lattice was well ordered, with color-coded boxes labeling the peaks. (C) The density of each layer of the Gag lattice (from left to right: NC, CA CTD, CA NTD, MA) in the virion shown (B) was projected radially onto separate concentric spherical shells to reveal possible packing arrangements. The radial boundaries used for each layer are shown by the color-coded boxes on the radial density plot (A, right). Here red represents higher density. Only the CA layers appear periodic, with patches of hexagonal order. Scale bar (bottom) 50 nm.
Gag lattice analysis
To detect potential periodicity in the different layers of the Gag lattice, the density within each layer was projected radially onto four concentric spherical shells located at the MA, CA NTD, CA CTD, and NC maxima in the radial density plot. Hexagonal lattices were clearly visible in large sectors of the projected density in the two CA layers of the virions but not in the MA or NC layers (Figure 3C). As expected, regions in which the CA lattices were ordered matched those in which the layers of Gag were clearly visible in slices through the tomograms (Figure 4). The percentage of each viral surface covered by well-ordered hexagonal Gag lattice was estimated visually to be ∼40%, on average, and individual measurements ranged from 28 to 60% (see Figure 5 for visual examples of what was considered ‘well-ordered' hexagonal Gag lattice).
Figure 4.
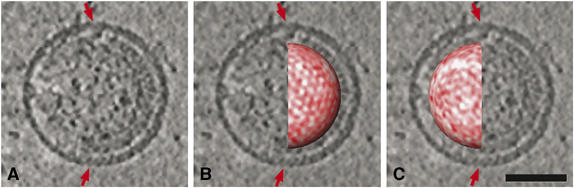
Correspondence of periodicity in the radial projections and the presence of visibly ordered Gag lattice. (A) 11 nm slice through the reconstruction of an immature virion, with a region of visibly ordered Gag lattice extending clockwise beneath the membrane from ‘12' to ‘6' o'clock. (B, C) Same slice as in (A), but with the right (B) and left (C) hemispheres of the CA NTD radial projection superimposed in situ to show that the patches of hexagonal order in the radial projections (seen on the right hemisphere) correspond to regions where ordered Gag lattice is visible in the cross-sectional slices. Scale bar 50 nm.
Figure 5.
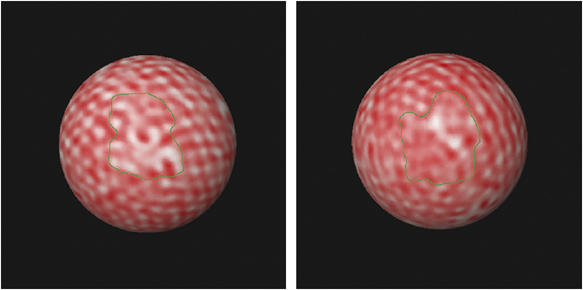
Method for estimating the percent surface area covered by ordered Gag. The percent surface area with visibly ordered Gag was estimated by hand with a segmentation tool. Two examples are shown. The areas inside the green boundaries were considered ‘disordered.'
In order to extract and average periodic features, an automated peak detection procedure was used to locate the putative unit cells of the hexagonal lattice. The standard deviation of the distances to each peak's six nearest neighbors was used as a measure of the local hexagonal order (Figure 6). Importantly, there was no significant correlation between those standard deviations and the polar angle from the peak to the z-axis, indicating that the ‘missing wedge' of information inaccessible in electron tomography (Lucic et al, 2005) did not artefactually cause certain regions to appear to lack order.
Figure 6.
Identification and ranking of unit cells according to local order. (A) Surface projection of the CA NTD layer of Gag in one virion, where red indicates high density. (B) Result of a peak search algorithm, with peaks marked by red dots. (C) Putative unit cells color coded according to the degree of local hexagonal order (red: greatest order, blue: least order).
Real space averaging of Gag unit cells
The 120 ‘unit cells' from the best virion with a standard deviation of neighbor distance less than 1.4 nm (26% of the total viral surface) were averaged as follows. First, the entire viral reconstruction was replicated 120 times (once for each unit cell that would go into the average). Using geographical terminology, the position and orientation of each good unit cell was specified by a ‘latitude,' ‘longitude,' and ‘elevation' (radius). Each unit cell was further specified by an ‘in-plane rotation,' defined as the angle between (1) a vector from the peak of interest to an arbitrarily chosen nearest neighbor and (2) the longitudinal line passing through the peak towards the ‘North' pole. Each replicated reconstruction was then rotated and translated so as to bring one chosen unit cell to the North pole in rotational alignment with all the others. All 120 reconstructions were then averaged in situ.
The layers of this averaged Gag lattice (Figure 7) were interpreted by superimposing the radial density profile shown earlier in Figure 3B. Starting from the outside, the membrane-MA layer appeared unilaminar and lacked periodicity. The fact that this layer appeared bilaminar in individual slices of the original reconstruction but unilaminar in the average suggests that the distance between the CA NTD peak (which was used to assign the ‘elevation' or radius of each unit cell) and the membrane-MA layer varied slightly, blurring fine details. A distinct layer of low density at a radius of 52 nm separated the average MA and CA NTD domains. A clear hexagonal lattice was visible in the CA layers with a hole-to-hole spacing of 8 nm that extended for at least five holes (well beyond the single unit cell used in the alignment). Further towards the particle interior, at the radius corresponding to SP1, another hexagonal lattice emerged with peaks of high density spaced 7.5 nm apart, directly below the low-density holes in rings of the CA layer. Beneath the SP1 layer was another nonperiodic high-density layer corresponding to NC, followed by the relatively uniform density of the viral center. As a control, a similar average computed from the 120 lowest ranked peaks showed only the low density hole that defined each peak, with no surrounding lattice structure apparent in that layer or any other (data not shown).
Figure 7.
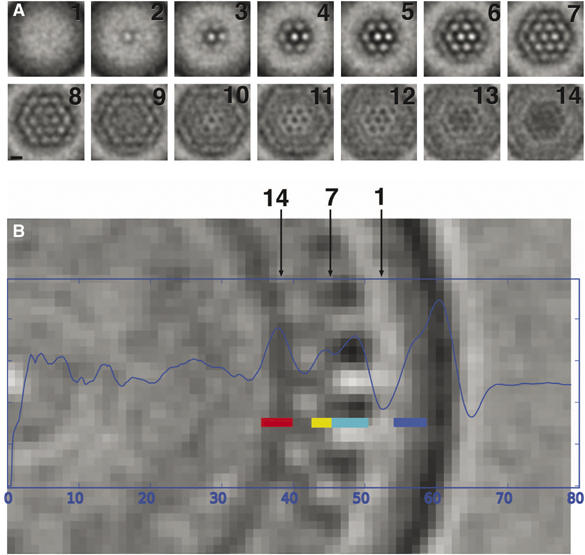
Average unit cell of the Gag lattice. (A) Montage of xy-slices and (B) a single 1.12 nm yz-slice through the averaged Gag lattice. The radial positions of the xy-slices are marked by number on the yz-slice, which in turn can be interpreted by reference to the superimposed radial density plot, color-coded boxes labeling the peaks: NC (red), CA CTD (yellow), CA NTD (cyan), and MA (blue). Scale bar for panel A only, 8 nm.
Discussion
Viewing individual immature HIV-1 virions in 3D by electron cryotomography revealed and confirmed a number of interesting details. The extent of discontinuity in the Gag shell was surprising. Early images of fixed sections had suggested large gaps between ‘crescents' of material, but these were difficult to interpret due to the resolution limitations of stain and plastic embedment (Öhagen et al, 1997). In images of frozen-hydrated virions, small discontinuities had been noted in wild-type viral preparations, and in some cases larger gaps have been visible within HIV-1 virions and VLPs (Fuller et al, 1997; Wilk et al, 2001). The extent of the discontinuous nature of the Gag lattice within immature virions has been difficult to discern, however, because previous images were taken in projection. Here we show that the Gag shell of spherical immature HIV-1 virions consists of a complex 3D patchwork that contains substantial regions of both order and disorder. This observation was not an artefact of any particular sample preparation, the virions' positions within the ice layer, or the missing wedge of information in the tomograms (because there was no correlation between the degree of order observed and the position on the viral shell relative to the plane of the ice). Hence, the patchwork nature of the Gag lattice appears to be a genuine feature of the viral structure.
Whether or not formation of the original Gag lattice in vivo requires the incorporation of pentamers remains unclear. At one extreme, perhaps ‘islands' of Gag hexamers limited by the constraints of intrinsic curvature (curvature within a hexagonal lattice) gather at the membrane surface and become enclosed in the budding virion, and there is no formally closed lattice (and therefore no need for pentamers). At the other extreme, perhaps assembling Gag particles form a neatly closed spherical lattice through inclusion of exactly 12 pentamers, but at some point that strict lattice structure is lost. As virions bud from the cell membrane, for example, some portion of the ‘neck' region of the membrane could become incorporated into the virus, introducing substantial extra surface area for which there is no corresponding Gag. An initially closed Gag lattice may then simply break up into patches. Finally, intermediates between these extremes are also possible: for example, incompletely closed sectors of Gag including some number of pentamers less than 12 could, for example, become enclosed within a budding virion. Interestingly, spherical and semispherical Gag particles can form in vitro in the absence of any membrane (Gross et al, 2000; Campbell et al, 2001; Wilk et al, 2001), and it will be instructive to determine whether or not any of these particles are fully closed. In any case, the Gag lattice is remarkably flexible, accommodating different curvatures and different numbers of ordered patches with various sizes and shapes.
In regions where there was no ordered Gag lattice, the protein density was noticeably lower, suggesting that while it is possible some (disordered) Gag molecules were present there, they were certainly not as densely packed as in the ordered regions. This observation has important implications for estimates of the number of Gag molecules per virion. One previous approach estimated the average number of Gag molecules/virion to be 4–5000 by assuming that the ordered Gag lattice covered the entire membrane surface (Briggs et al, 2004). Our observation that the regular Gag lattice covers only about half of the virion surface suggests that this method may overestimate the number of Gag molecules by up to twofold. Considerable variation clearly occurs, however, as exemplified by the immature virion seen here with 60% of its surface covered by ordered Gag and by our previous characterization of a mature HIV-1 virion with five cores comprising ∼3600 CA subunits (Benjamin et al, 2005). The number of Gag molecules/virion was independently estimated to be 4–5000 based upon STEM measurements of the masses of Gag virus-like particles assembled in vitro (Briggs et al, 2004). Our studies do not address this estimate directly, but do emphasize that it will be important to determine whether authentic virions and VLPs assembled in vitro exhibit the same degree of lattice closure.
The thickness and spacings of the three domains composing the Gag shell in immature virions were measured and found to be consistent with previous measurements from projections (Fuller et al, 1997; Wilk et al, 2001). By looking carefully at individual slices of 3D reconstructions, however, we made the observation that the membrane-MA layer only within regions of ordered Gag appeared bilaminar and was substantially thicker than elsewhere. In part, the increased overall thickness of this layer must reflect the packing of MA molecules against the membrane. However, the presence of MA does not readily explain why two independent maxima can be resolved in the ordered regions. Instead, our observation suggests that the separation between the two leaflets of the bilayer increases above the Gag lattice. We speculate that this increased separation may be caused by insertion of the N-terminal MA myristoyl group into the membrane and/or by alterations in lipid composition, such as increased cholesterol levels (Ono and Freed, 2005).
Projecting the densities of each layer radially onto separate concentric spherical surfaces allowed us to visualize the organization of each protein layer directly. While no periodicity was apparent in MA or NC, clear hexagonal order was visible in the CA NTD, CA CTD, and SP1 layers. Thus, the regions of ordered structure correlated well with the regions of Gag known to be important for virus assembly (Kräusslich et al, 1995; Borsetti et al, 1998; Accola et al, 2000; Ako-Adjei et al, 2005; Alfadhli et al, 2005). Because tomography produces full 3D reconstructions of unique objects, we were able to computationally locate, align, and superimpose just the well-ordered ‘unit cells' within the fragmented Gag lattice in real space, and thus generate an average with higher signal-to-noise ratio. The expected hexagonal lattices (Fuller et al, 1997; Nermut et al, 1998; Wilk et al, 2001; Mayo et al, 2003; Huseby et al, 2005; Briggs et al, 2006b) were observed in both the CA NTD and CTD layers, with 8.0 nm spacing at the level of the NTD. This approach confirmed previous observations of hexagonal packing with the same periodicity that were shown from circumferential 1D Fourier transforms of single projection images to arise from the CA shell at varying radii (Briggs et al, 2004, 2006b), and the overall arrangement of the CA N- and CTDs is similar to that described by Mayo et al (2003). Our studies also revealed a second distinct hexagonal lattice with the slightly smaller spacing of 7.5 nm located between the peaks of density assigned to the CA CTD and NC domains. This lattice is therefore likely to be composed of the final 12 CA residues (which are disordered in crystal structures) and the 14-residue SP1 spacer peptide, which connects CA and NC. Whereas the CA lattice is a layer of high density with hexagonally packed ‘holes,' the lower SP1 lattice is a layer of overall lower density with isolated peaks directly below the holes in the CA rings above.
At the current resolution, the averaged density map could accommodate a number of different possible molecular arrangements of the available atomic models. One arrangement that we found to be consistent with the data (Figure 8) positioned the CA NTD (Kelly et al, 2006) in a configuration similar to that of the model previously established for the mature lattice, with helices 1 and 2 facing the center of each hexamer (Li et al, 2000; Mortuza et al, 2004). The smaller lattice spacing of our density meant that the NTD hexamers came in direct contact with each other. This could be accommodated by a crystal contact found in the X-ray structure of a MA–CA construct, which creates a twofold symmetric dimer mediated by helices 4 and 7 (Kelly et al, 2006). The CA CTDs (Worthylake et al, 1999) were arranged to maintain a dimer interface observed crystallographically (Gamble et al, 1997), stay close enough to the CA NTD to be connected by the linker peptide, and otherwise fill the volume evenly. Again, at this resolution, we cannot rule out other possibilities such as a domain-swapped CTD dimer (Ivanov et al, 2005).
Figure 8.
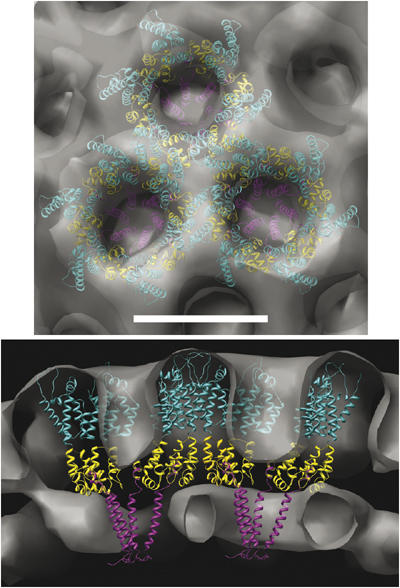
Model for the arrangement of Gag subunits within the immature lattice. Top and side views (top and bottom, respectively) of the averaged Gag lattice (gray surface) with atomic models of CA NTD (cyan), CA CTD (yellow), and SP1 (magenta) fit by eye into the density. Note that the dockings are not exact, as explained in the text, but do present one compelling interpretation of the density in terms of gross molecular architecture. Scale bar 8 nm.
The physiological structure of the SP1 polypeptide is still unclear. NMR studies showed that SP1 has a propensity to form an α-helix, but these experiments were performed in the presence of TFE, which promotes helix formation (Morellet et al, 2005). Mutagenesis studies support the idea that the CA–SP1 junction forms a helix and is also important for Gag multimerization in the immature virus (Accola et al, 1998; Liang et al, 2002), but they are certainly not conclusive. Finally, in other work (Newman et al, 2004), SP1 was not modeled as a helix, but was suggested to have a weak helical propensity. Based on these findings and the fact that the density we saw here below the CA CTD rings matched a bundle of six 14-residue helices well in both length and diameter, we propose that the SP1 does indeed form a six-helix bundle in immature HIV-1 virions. This should be regarded as a strongly predictive working hypothesis that agrees with all the data rather than an unambiguous structural result. It is still unclear, for instance, exactly how many residues are involved, and whether or not adjacent CA and NC residues participate in helix formation. The relative rotation of the helices is also unknown. Despite such uncertainties, we created an illustrative model by attaching the short terminal CA CTD helices (helix 4) to the longer SP1 helices through linkers that spanned the flexible C-terminal 12 residues of the CA CTD and placed the six helices within the density around the sixfold axis.
Our results provide a structural explanation for the critical role of the Gag SP1 region in viral assembly and maturation (Figure 9). As noted earlier, the SP1 spacer is required for viral assembly (Accola et al, 1998; Liang et al, 2002) and even single-point mutations in the SP1 spacer and adjacent CA and NC junction can disrupt assembly (Accola et al, 1998; Gay et al, 1998; Liang et al, 2002; Li et al, 2003). Furthermore, SP1 appears to function as a maturation ‘switch,' because its presence or absence can dictate whether Gag constructs assemble into immature (SP1 present) or mature (SP1 absent) lattices (Accola et al, 1998; Gross et al, 2000). Finally, the CA–SP1 junction has emerged as the probable binding site of the recently discovered small molecule HIV-1 maturation inhibitor, 3-O-(3′,3′-dimethylsuccinyl)-betulinic acid (DSB). DSB inhibits maturation by blocking Gag cleavage at the CA–SP1 junction, and point mutations in residues surrounding this junction can confer drug resistance (Kanamoto et al, 2001; Li et al, 2003; Zhou et al, 2004, 2005; Aiken and Chen, 2005; Yu et al, 2005).
Figure 9.
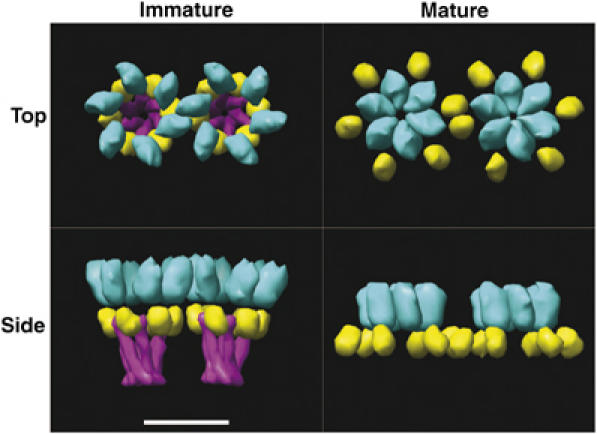
Model for the roles of Gag subunits in the immature and mature lattices. Top and side views (top and bottom, respectively) of low-pass filtered atomic models of the immature (left) and mature (right) lattices (CA NTD in cyan, CA CTD in yellow, and SP1 in magenta). In the immature lattice, hexamers are held together from below by the SP1 bundle and spaced by CA CTD interactions. The CA NTD is not essential for assembly of the immature lattice. Maturation removes SP1 and causes formation of the CA N-terminal β-hairpin, which induces hexameric ring formation in that domain. Thus in the mature lattice, hexamers are held together instead from above, by CA NTD, but are again spaced by CA CTD interactions. Scale bar 8 nm.
In the immature lattice, CA hexamers are stabilized from ‘below' by SP1 bundles, while the interhexamer spacings must be dictated primarily by CA CTD interactions (the only other domain required to form the immature lattice). These tight intra- and interhexamer CA and SP1 contacts combine to create the dense hexagonal Gag lattice of the immature virion. Proteolysis at the CA–SP1 junction promotes the maturation transition by separating the CA and SP1 hexamers. This destabilizes the immature CA hexamers and allows the CA subunits to rearrange into distinct CA hexamers that form the building blocks of the mature capsid lattice. Proteolysis at the MA–CA junction of Gag serves as a second structural switch, releasing CA from the membrane and also triggering a restructuring of the CA N-terminus that promotes formation of mature hexameric CA NTD rings (von Schwedler et al, 1998; Li et al, 2000; Tang et al, 2002; Mayo et al, 2003; von Schwedler et al, 2003; Ganser-Pornillos et al, 2004; Mortuza et al, 2004). The reduced subunit packing density in the mature viral capsid reflects greater spacing between CA hexamers. In both cases, CA CTD domain interactions mediate interhexamer interactions, but in the mature lattice, the CTD domains are displaced away from the local sixfold axes, which increases the interhexamer distance and opens the lattice.
Materials and methods
Preparation of immature virions
Mutations in the PR, RT, and RNase H genes of the HIV-1NL4-3 R9 proviral vector were made to render HIV-1 virions noninfectious and immature. Inactivating point mutations in the RT and RNaseH were cloned from a ΔEnv/RTD185A/RnaseHH539A R9proviral vector (Benjamin et al, 2005) into an R9 backbone plasmid containing three point mutations in the protease active site (DTG to AAA) (Wyma et al, 2000) using BclI and EcoRI restriction sites. Restriction analysis and DNA sequencing confirmed the presence of the inactivating mutations. Virions were produced by transfecting the proviral DNA construct into 293T cells. The cells were grown in DMEM (Gibco/Invitrogen)+10% FBS (Gibco/Invitrogen) in thirty 10 cm plates seeded with 6 × 10⁶ cells per plate. After 24 h, the cells were transfected with 12 μg of the proviral DNA construct and 50 μl Fugene6 transfection reagent (Roche) per plate. At 6 h post-transfection, the medium was replaced with 7 ml DMEM+10% FBS and the cells were incubated for 40 h. The supernatant containing virions was collected and filtered through a 0.45 μm SFCA syringe filter (Corning) to remove debris. The filtered supernatant (∼200 ml) containing the virions was placed onto six separate 5 ml 20% sucrose cushions (20% sucrose W/V in STE buffer (10 mM Tris, pH 7.4; 50 mM NaCl, 1 mM EDTA)) and centrifuged (25 000 r.p.m. for 2.5 h at 4°C in a Beckman SW28 Large Ultracentrifuge Rotor) to concentrate the virions. The viral pellets were resuspended in 1 ml of STE buffer, pooled, and recentrifuged (1 h at 41 000 r.p.m. at 4°C in a Beckman SW41 Small Ultracentrifuge Rotor). The final virion pellet was gently rinsed with 100 μl STE buffer, resuspended in 30 μl STE, and dialyzed in 1 l STE buffer for 2 h in a 50 μl microequilibrium dialyzer (10 000 MWCO Harvard Apparatus) to remove excess sucrose from the preparation. The dialyzed solutions were then gently centrifuged (5000 r.p.m. for 5 min in a microcentrifuge at 4°C) to remove debris, and the supernatants containing the purified virions were used for freezing and imaging. The presence of virions at specific stages of the protocol was verified by SDS–PAGE and Western blot with α-CA, α-MA, and α-Env antibodies (data not shown). However, Env was not consistently observed on the virions when imaged, likely due to low levels of Env incorporation.
Electron cryotomography
Solutions of the purified HIV-1 virions were flash-frozen onto glow-discharged Quantifoil grids (Quantifoil, Germany) in liquid ethane using a Vitrobot (FEI, The Netherlands). Colloidal gold (10 nm) was both combined with the viral solutions and applied separately on the grids before freezing.
All images were captured on the GIF CCD (Gatan) using slit width of 20 eV, a defocus range of 4–8 μm under focus (first CTF zero between 1/2.8 and 1/4/nm, respectively), a total electron dose of 120 e/Å2 or less, liquid nitrogen cooling, and CCD pixel size of 0.46 or 0.56 nm on the specimen. Tilt series were collected from approximately −70° to +70° with 1° and 2° tilt steps automatically using the predictive UCSF tomography package (Zheng et al, 2004).
Analysis of virions
Images were binned twofold and tomographic reconstructions were generated using the IMOD package (Kremer et al, 1996). Individual immature virions were selected manually from the completed tomograms and were denoised by nonlinear anisotropic diffusion as implemented in BSOFT (Benjamin et al, 2005). Radial density profiles were generated by sampling spherical shells of the tomograms and plotting the density per unit area as a function of radius. Surface projections were created by sampling the density in the tomogram along vectors normal to a triangle mesh surface of spherical shape, then assigning to each vertex on the surface the summed density along the vector at that point. To determine the surface areas of ordered and disordered regions within the CA NTD layer, the surface area of the sphere associated with the CA layer was calculated with the Amira (Mercury Computer Systems, Inc.) surface area module. Boundaries around disordered regions (or patches) were drawn by hand and the surface area was calculated (Figure 5). The percent associated with ordered and disordered regions was then computed. To locate the unit cells, the points on the projected surfaces with the least density within a specified radius were selected. Those points were then labeled with the standard deviation of the distance to their six nearest neighbors, as a measure of the local degree of order in the hexagonal lattice. Amira extension modules created within our lab executed the preceding functions. For unit cell averaging, the set of extrema on the projected surface layers having the least variation in the distance to their neighbors was selected. For each of the selected points, a local coordinate system was established comprising the normal vector to the surface (the Z-axis), the vector from the point to its nearest neighbor (the X-axis), and their cross product (the Y-axis). The entire volume containing the virion was then rotated into alignment with the global axes and translated so as to superimpose all of the selected surface extrema. Density renderings of the CA and SP1 domains and atomic model fitting were performed with the UCSF Chimera software package from the Resource for Biocomputing, Visualization, and Informatics at the University of California, San Francisco (Pettersen et al, 2004). Three crystal structures were used for the atomic model fitting: the NTD of CA (PDB 2gon) (Kelly et al, 2006), the CTD of CA (1a43) (Worthylake et al, 1999), and SP1 (1u57) (Morellet et al, 2005).
Supplementary Material
Supplementary Movie
Acknowledgments
This work was supported in part by NIH Grant PO1 GM66521 (to WIS and GJJ), NIH Grant A145405 (to WIS), NIH Grant F32 GM075543 (to ERW), the Beckman Institute at Caltech, and gifts to Caltech from the Ralph M Parsons Foundation, the Agouron Institute, and the Gordon and Betty Moore Foundation.
References
- Accola MA, Höglund S, Göttlinger HG (1998) A putative alpha-helical structure which overlaps the capsid-p2 boundary in the human immunodeficiency virus type 1 Gag precursor is crucial for viral particle assembly. J Virol 72: 2072–2078 [DOI] [PMC free article] [PubMed] [Google Scholar]
- Accola MA, Strack B, Göttlinger HG (2000) Efficient particle production by minimal Gag constructs which retain the carboxy-terminal domain of human immunodeficiency virus type 1 capsid-p2 and a late assembly domain. J Virol 74: 5395–5402 [DOI] [PMC free article] [PubMed] [Google Scholar]
- Aiken C, Chen CH (2005) Betulinic acid derivatives as HIV-1 antivirals. Trends Mol Med 11: 31–36 [DOI] [PubMed] [Google Scholar]
- Ako-Adjei D, Johnson MC, Vogt VM (2005) The retroviral capsid domain dictates virion size, morphology, and coassembly of gag into virus-like particles. J Virol 79: 13463–13472 [DOI] [PMC free article] [PubMed] [Google Scholar]
- Alfadhli A, Dhenub TC, Still A, Barklis E (2005) Analysis of human immunodeficiency virus type 1 Gag dimerization-induced assembly. J Virol 79: 14498–14506 [DOI] [PMC free article] [PubMed] [Google Scholar]
- Benjamin J, Ganser-Pornillos BK, Tivol WF, Sundquist WI, Jensen GJ (2005) Three-dimensional structure of HIV-1 virus-like particles by electron cryotomography. J Mol Biol 346: 577–588 [DOI] [PMC free article] [PubMed] [Google Scholar]
- Bieniasz PD (2006) Late budding domains and host proteins in enveloped virus release. Virology 344: 55–63 [DOI] [PubMed] [Google Scholar]
- Borsetti A, Ohagen A, Gottlinger HG (1998) The C-terminal half of the human immunodeficiency virus type 1 Gag precursor is sufficient for efficient particle assembly. J Virol 72: 9313–9317 [DOI] [PMC free article] [PubMed] [Google Scholar]
- Briggs JA, Grünewald K, Glass B, Förster F, Kräusslich HG, Fuller SD (2006) The mechanism of HIV-1 core assembly: insights from three-dimensional reconstructions of authentic virions. Structure 14: 15–20 [DOI] [PubMed] [Google Scholar]
- Briggs JA, Johnson MC, Simon MN, Fuller SD, Vogt VM (2006) Cryo-electron microscopy reveals conserved and divergent features of gag packing in immature particles of Rous sarcoma virus and human immunodeficiency virus. J Mol Biol 355: 157–168 [DOI] [PubMed] [Google Scholar]
- Briggs JA, Simon MN, Gross I, Kräusslich HG, Fuller SD, Vogt VM, Johnson MC (2004) The stoichiometry of Gag protein in HIV-1. Nat Struct Mol Biol 11: 672–675 [DOI] [PubMed] [Google Scholar]
- Briggs JA, Wilk T, Welker R, Kräusslich HG, Fuller SD (2003) Structural organization of authentic, mature HIV-1 virions and cores. EMBO J 22: 1707–1715 [DOI] [PMC free article] [PubMed] [Google Scholar]
- Campbell S, Fisher RJ, Towler EM, Fox S, Issaq HJ, Wolfe T, Phillips LR, Rein A (2001) Modulation of HIV-like particle assembly in vitro by inositol phosphates. Proc Natl Acad Sci USA 98: 10875–10879 [DOI] [PMC free article] [PubMed] [Google Scholar]
- Craven RC, Leure-duPree AE, Erdie CR, Wilson CB, Wills JW (1993) Necessity of the spacer peptide between CA and NC in the Rous sarcoma virus gag protein. J Virol 67: 6246–6252 [DOI] [PMC free article] [PubMed] [Google Scholar]
- Cimarelli A, Sandin S, Hoglund S, Luban J (2000) Basic residues in human immunodeficiency virus type 1 nucleocapsid promote virion assembly via interaction with RNA. J Virol 74: 3046–3057 [DOI] [PMC free article] [PubMed] [Google Scholar]
- D'Souza V, Summers MF (2005) How retroviruses select their genomes. Nat Rev Microbiol 3: 643–655 [DOI] [PubMed] [Google Scholar]
- Fuller SD, Wilk T, Gowen BE, Kräusslich KA, Vogt VM (1997) Cryo-electron microscopy reveals ordered domains in the immature HIV-1 particle. Curr Biol 7: 729–738 [DOI] [PubMed] [Google Scholar]
- Freed EO (1998) HIV-1 gag proteins: diverse functions in the virus life cycle. Virology 251: 1–15 [DOI] [PubMed] [Google Scholar]
- Gamble TR, Yoo S, Vajdos FF, von Schwedler UK, Worthylake DK, Wang H, McCutcheon JP, Sundquist WI, Hill CP (1997) Structure of the carboxyl-terminal domain of the HIV-1 capsid protein. Science 278: 849–852 [DOI] [PubMed] [Google Scholar]
- Ganser-Pornillos BK, von Schwedler UK, Stray KM, Aiken C, Sundquist WI (2004) Assembly properties of the human immunodeficiency virus type 1 CA protein. J Virol 78: 2545–2552 [DOI] [PMC free article] [PubMed] [Google Scholar]
- Gay B, Tournier J, Chazal N, Carrière C, Boulanger P (1998) Morphopoietic determinants of HIV-1 Gag particles assembled in baculovirus-infected cells. Virology 247: 160–169 [DOI] [PubMed] [Google Scholar]
- Gross I, Hohenberg H, Wilk T, Wiegers K, Grättinger M, Müller B, Fuller S, Kräusslich HG (2000) A conformational switch controlling HIV-1 morphogenesis. EMBO J 19: 103–113 [DOI] [PMC free article] [PubMed] [Google Scholar]
- Guo X, Hu J, Whitney JB, Russell RS, Liang C (2004) Important role for the CA–NC spacer region in the assembly of bovine immunodeficiency virus Gag protein. J Virol 76: 11729–11737 [DOI] [PMC free article] [PubMed] [Google Scholar]
- Hill CP, Worthylake D, Bancroft DP, Christensen AM, Sundquist WI (1996) Crystal structures of the trimeric human immunodeficiency virus type 1 matrix protein: implications for membrane association and assembly. Proc Natl Acad Sci USA 93: 3099–3104 [DOI] [PMC free article] [PubMed] [Google Scholar]
- Huseby D, Barklis RL, Alfadhli A, Barklis E (2005) Assembly of human immunodeficiency virus precursor gag proteins. J Biol Chem 280: 17664–17670 [DOI] [PubMed] [Google Scholar]
- Ivanov D, Stone JR, Maki JL, Collins T, Wagner G (2005) Mammalian SCAN domain dimmer is a domain-swapped homolog of the HIV capsid c-terminal domain. Mol Cell 17: 137–143 [DOI] [PubMed] [Google Scholar]
- Kanamoto T, Kashiwada Y, Kanbara K, Gotoh K, Yoshimori M, Goto T, Sano K, Nakashima H (2001) Anti-human immunodeficiency virus activity of YK-FH312 (a betulinic acid derivative), a novel compound blocking viral maturation. Antimicrob. Agents Chemother. 45: 1225–1230 [DOI] [PMC free article] [PubMed] [Google Scholar]
- Kelly BN, Howard BR, Wang H, Robinson H, Sundquist WI, Hill CP (2006) Implications for viral capsid assembly from crystal structures of HIV-1 Gag(1)(−)(278) and CA(N)(133)(−)(278). Biochemistry 45: 11257–11266 [DOI] [PubMed] [Google Scholar]
- Kräusslich HG, Fäcke M, Heuser AM, Konvalinka J, Zentgraf H (1995) The spacer peptide between human immunodeficiency virus capsid and nucleocapsid proteins is essential for ordered assembly and viral infectivity. J Virol 69: 3407–3419 [DOI] [PMC free article] [PubMed] [Google Scholar]
- Kremer JR, Mastronarde DN, McIntosh JR (1996) Computer visualization of three-dimensional image data using IMOD. J Struct Biol 116: 71–76 [DOI] [PubMed] [Google Scholar]
- Li F, Goila-Gaur R, Salzwedel K, Kilgore NR, Reddick M, Matallana C, Castillo A, Zoumplis D, Martin DE, Orenstein JM, Allaway GP, Freed EO, Wild CT (2003) PA-457: a potent HIV inhibitor that disrupts core condensation by targeting a late step in Gag processing. Proc Natl Acad Sci USA 100: 13555–13560 [DOI] [PMC free article] [PubMed] [Google Scholar]
- Li S, Hill CP, Sundquist WI, Finch JT (2000) Image reconstructions of helical assemblies of the HIV-1 CA protein. Nature 407: 409–413 [DOI] [PubMed] [Google Scholar]
- Liang C, Hu J, Russell RS, Roldan A, Kleiman L, Wainberg MA (2002) Characterization of a putative alpha-helix across the capsid-SP1 boundary that is critical for the multimerization of human immunodeficiency virus type 1 gag. J Virol 76: 11729–11737 [DOI] [PMC free article] [PubMed] [Google Scholar]
- Lucic V, Förster F, Baumeister W (2005) Structural studies by electron tomography: from cells to molecules. Annu Rev Biochem 74: 833–865 [DOI] [PubMed] [Google Scholar]
- Massiah MA, Starich MR, Paschall C, Summers MF, Christensen AM, Sundquist WI (1994) Three-dimensional structure of the human immunodeficiency virus type 1 matrix protein. J Mol Biol 244: 198–223 [DOI] [PubMed] [Google Scholar]
- Mayo K, Huseby D, McDermott J, Arvidson B, Finley L, Baklis E (2003) Retrovirus capsid protein assembly arrangements. J Mol Biol 325: 225–237 [DOI] [PubMed] [Google Scholar]
- Morellet N, Druillennec S, Lenoir C, Bouaziz S, Roques BP (2005) Helical structure determined by NMR of the HIV-1 (345–392) Gag sequence, surrounding p2: implications for particle assembly and RNA packaging. Protein Sci 14: 375–386 [DOI] [PMC free article] [PubMed] [Google Scholar]
- Mortuza GB, Haire LF, Stevens A, Smerdon SJ, Stoye JP, Taylor IA (2004) High-resolution structure of a retroviral capsid hexameric amino-terminal domain. Nature 431: 481–485 [DOI] [PubMed] [Google Scholar]
- Nermut MV, Hockley DJ, Bron P, Thomas D, Zhang WH, Jones IM (1998) Further evidence for hexagonal organization of HIV gag protein in prebudding assemblies and immature virus-like particles. J Struct Biol 123: 143–149 [DOI] [PubMed] [Google Scholar]
- Newman JL, Butcher EW, Patel DT, Mikhaylenko Y, Summers MF (2004) Flexibility in the P2 domain of the HIV-1 Gag polyprotein. Protein Sci 13: 2101–2107 [DOI] [PMC free article] [PubMed] [Google Scholar]
- Öhagen Å, Luftig RB, Reicin AS, Yin L, Ikuta Z, Kimura T, Goff SP, Höglund S (1997) The morphology of the immature HIV-1 virion. Virology 228: 112–114 [DOI] [PubMed] [Google Scholar]
- Ono A, Freed EO (2005) Role of lipid rafts in virus replication. Adv Virus Res 64: 311–358 [DOI] [PubMed] [Google Scholar]
- Pettersen EF, Goddard TD, Huang CC, Couch GS, Greenblatt DM, Meng EC, Ferrin TE (2004) UCSF Chimera—a visualization system for exploratory research and analysis. J Comput Chem 25: 1605–1612 [DOI] [PubMed] [Google Scholar]
- Reil H, Bukovsky AA, Gelderblom HR, Göttlinger HG (1998) Efficient HIV-1 replication can occur in the absence of the viral matrix protein. EMBO J 17: 2699–2708 [DOI] [PMC free article] [PubMed] [Google Scholar]
- Saad JS, Miller J, Tai J, Kim A, Ghanam RH, Summers MF (2006) Structural basis for targeting HIV-1 Gag proteins to the plasma membrane for virus assembly. Proc Natl Acad Sci USA 103: 11364–11369 [DOI] [PMC free article] [PubMed] [Google Scholar]
- Sandefur S, Smith RM, Varthakavi V, Spearman P (2000) Mapping and characterization of the N-terminal I domain of human immunodeficiency virus type 1 Pr55(Gag). J Virol 74: 7238–7249 [DOI] [PMC free article] [PubMed] [Google Scholar]
- Tang C, Ndassa Y, Summers MF (2002) Structure of the N-terminal 283-residue fragment of the immature HIV-1 Gag polyprotein. Nat Struct Biol 9: 537–543 [DOI] [PubMed] [Google Scholar]
- von Schwedler UK, Stemmler TL, Klishko VY, Li S, Albertine KH, Davis DR, Sundquist WI (1998) Proteolytic refolding of the HIV-1 capsid protein amino-terminus facilitates viral core assembly. EMBO J 17: 1555–1568 [DOI] [PMC free article] [PubMed] [Google Scholar]
- von Schwedler UK, Stray KM, Garrus JE, Sundquist WI (2003) Functional surfaces of the human immunodeficiency virus type 1 capsid protein. J Virol 77: 5439–5450 [DOI] [PMC free article] [PubMed] [Google Scholar]
- Wilk T, Gross I, Gowen BE, Rutten T, De Haas F, Welker R., Kräusslich KA, Boulanger P, Fuller SD (2001) Organization of immature human immunodeficiency virus type 1. J Virol 75: 759–771 [DOI] [PMC free article] [PubMed] [Google Scholar]
- Worthylake DK, Wang H, Yoo S, Sundquist WI, Hill CP (1999) Structures of the HIV-1 capsid protein dimerization domain at 2.6 Å resolution. Acta Crystallogr D 55: 85–92 [DOI] [PubMed] [Google Scholar]
- Wyma DJ, Kotov A, Aiken C (2000) Evidence for a stable interaction of gp41 with Pr55(Gag) in immature human immunodeficiency virus type 1 particles. J Virol 74: 9381–9387 [DOI] [PMC free article] [PubMed] [Google Scholar]
- Yu D, Wild CT, Martin DE, Morris-Natschke SL, Chen CH, Allaway GP, Lee KH (2005) The discovery of a class of novel HIV-1 maturation inhibitors and their potential in the therapy of HIV. Expert Opin Investig Drugs 14: 681–693 [DOI] [PubMed] [Google Scholar]
- Zhang Y, Qian H, Love Z, Barklis E (1998) Analysis of the assembly function of the human immunodeficiency virus type 1 gag protein nucleocapsid domain. J Virol 72: 1782–1789 [DOI] [PMC free article] [PubMed] [Google Scholar]
- Zheng QS, Braunfeld MB, Sedat JW, Agard DA (2004) An improved strategy for automated electron microscopic tomography. J Struct Biol 147: 91–101 [DOI] [PubMed] [Google Scholar]
- Zhou J, Huang L, Hachey DL, Chen CH, Aiken C (2005) Inhibition of HIV-1 maturation via drug association with the viral Gag protein in immature HIV-1 particles. J Biol Chem 280: 42149–42155 [DOI] [PubMed] [Google Scholar]
- Zhou J, Yuan X, Dismuke D, Forshey BM, Lundquist C, Lee KH, Aiken C, Chen CH (2004) Small-molecule inhibition of human immunodeficiency virus type 1 replication by targeting of the final step of virion maturation. J Virol 78: 922–929 [DOI] [PMC free article] [PubMed] [Google Scholar]
Associated Data
This section collects any data citations, data availability statements, or supplementary materials included in this article.
Supplementary Materials
Supplementary Movie