

Abstract
Nocturnin (Noc, also called Ccrn4l [carbon catabolite repression 4-like]) is a circadian deadenylase that is rhythmically expressed in multiple tissues in mice with peak mRNA levels in early night. Since several other circadian genes are induced by extracellular stimuli, we tested the hypothesis that Noc is acutely regulated in NIH3T3 cells. A serum shock and the phorbol ester TPA induced Noc transcript levels in quiescent NIH3T3 cultures while dexamethasone and forskolin, which are known to induce other clock genes in culture, were without effect. NOC protein levels also were induced by serum. The half-life of the TPA-induced Noc mRNA is short, and the inhibition of protein synthesis by cycloheximide prevents Noc mRNA degradation and revealed a 30-fold increase in the transcript levels after 4 h of TPA treatment. Since this acute induction is not dependent on protein synthesis, Noc behaves like other immediate early genes. Remarkably, these acute effects are specific to Noc as the mRNAs encoding other known mouse deadenylases, CCR4, CAF1, PAN2, and PARN, were not induced in the same paradigm. Our data show that in addition to its robust circadian regulation, Noc expression can be regulated acutely, and imply that it can respond directly and specifically to physiological cues. NOC may act in turning off the expression of genes that are required to be silenced as a response to these extracellular signals.
Keywords: Nocturnin, deadenylase, mRNA decay, induction, circadian rhythms, immediate early gene (IEG)
INTRODUCTION
Mammalian cells modulate their gene expression in response to extracellular signals. These stimuli induce changes in transcriptional processes modifying the expression of genetic networks. However, post-transcriptional events also play an important role, with regulation of mRNA decay providing an additional critical regulatory step. The half-lives of numerous mRNAs change markedly in response to external cues; the control of this process provides the cell with more flexibility to adjust its physiology (Wilusz et al. 2001; Shim and Karin 2002; Wilusz and Wilusz 2004). Although the mechanism by which different factors activate signaling cascades that in turn induce changes in transcription programs has been extensively studied, much less is known about how external stimuli regulate mRNA stability.
In eukaryotic cells, the major mRNA decay pathways begin with the shortening of the polyA tail at the 3′ end of the transcripts, followed by degradation either by decapping and 5′→3′ exonucleolytic digestion, or alternatively by 3′→5′ exonuclease decay (for review, see Wilusz et al. 2001; Parker and Song 2004). The removal of polyA tails, thought to be the rate-limiting and more-regulated step in mRNA decay (Cao and Parker 2001; Wang et al. 2002), is carried out by a class of ribonucleases called deadenylases.
Nocturnin (Noc; also known as Ccrn4l) is a deadenylase that was originally identified in a screen for circadian clock-regulated genes in Xenopus retina (Green and Besharse 1996a); it was subsequently shown to be a Mg2+-dependent polyA-specific exoribonuclease (Baggs and Green 2003). Noc mRNA levels oscillate, peaking at night in both Xenopus (Green and Besharse 1996a; Liu and Green 2002) and mouse (Wang et al. 2001; Barbot et al. 2002).
Circadian rhythms are biological variables displaying ∼24 h cycles even in the absence of external cues. These oscillations are endogenously controlled, genetically determined, ubiquitous, and observed at molecular, physiological, behavioral, and even population levels (for review, see Reppert and Weaver 2002; Lowrey and Takahashi 2004). The circadian system provides organisms with a temporal organization and allows them to predict environmental cyclic changes and adapt their physiology accordingly (Pittendrigh 1993). Circadian clocks are intracellular mechanisms present in many cells and tissues throughout the body. For example, mammalian fibroblasts contain functional clocks that drive circadian rhythms in gene expression (Balsalobre et al. 1998; Nagoshi et al. 2004; Welsh et al. 2004) and metabolism (Marquez et al. 2004). These oscillations can be observed in vitro after the synchronization of the cell population by a serum shock or other stimuli. Fibroblast cultures have emerged as an excellent model to study cellular clocks and their interaction with physiological signals (Nagoshi et al. 2005).
In this study we investigated, in NIH3T3 cultures, the response of mouse Noc (mNoc) to different extracellular stimuli that entrain circadian clocks and affect the stability of many mRNAs. We found that mNoc expression was induced by serum and the phorbol ester TPA. This acute induction was observed even in the presence of protein synthesis inhibitors, indicating that mNoc is an immediate early gene (IEG). Remarkably, mNoc was the unique deadenylase induced by serum shock among the five polyA-specific ribonucleases described thus far in mouse. Our results suggest that mNOC plays a role in turning off the expression of genes that are silenced under this paradigm.
RESULTS
mNOC is a deadenylase
The C terminus of Xenopus NOC (xNOC) and its mouse ortholog has strong sequence similarity with the C terminus of yeast CCR4 (Green and Besharse 1996a; Dupressoir et al. 1999, 2001; Wang et al. 2001). This is the catalytic domain responsible for the deadenylase activity of yCCR4 and because of this, mNoc is also known as Ccrn4l (carbon catabolite repression 4-like).
We have previously shown that xNOC is a Mg2+-dependent polyA-specific exoribonuclease (Baggs and Green 2003). We sought to verify that mNOC also displays deadenylase activity (Fig. 1). Recombinant GST-tagged mNOC (GST-mNOC) was incubated with a synthetic (32P)-RNA substrate (body of 86 nucleotides [nt] of the β-globin 3′ UTR, and polyA tail of 100 nt) in the presence of Mg2+ and buffer. Xenopus polyA-specific ribonuclease with a C-terminal His-tag (xPARN-His) was assayed as a positive control (Copeland and Wormington 2001; Baggs and Green 2003). In addition to the enzyme blank, we included three different negative controls: mouse CRY2, the protein product of a clock gene unrelated to nucleases; a predicted Mg2+-binding mutant; and mNOC plus the divalent ion chelator EDTA. In the Mg2+-binding mutant protein we replaced the glutamic acid at position 193 with an alanine (E193A in the mNOC sequence). This is a conserved Mg2+-binding residue in the CCR4, DNase I, APE1, and IP5P family (Dlakic 2000; Dupressoir et al. 2001). It has been shown before that this mutation impairs deadenylase activity in yCCR4 (Chen et al. 2002) and xNOC (Baggs and Green 2003). The radiolabeled substrate and products were separated by polyacrylamide gel electrophoresis (Fig. 1A) or thin layer chromatography (TLC; Fig. 1B) and detected by autoradiography as described previously (Copeland and Wormington 2001; Baggs and Green 2003).
FIGURE 1.

mNOC is a processive deadenylase. (A) Autoradiography showing the products of an in vitro deadenylase assay separated by electrophoresis in a polyacrylamide/urea gel. The synthetic RNA substrate (body, 86 nt; polyA tail, 100 nt; 1 × 10⁵ dpm, ∼1.5 ng) was labeled with (α-32P)-UTP and incubated for 30 min with different proteins (500 ng) in the presence of buffer and Mg2+. (B) Autoradiography showing the products of a deadenylase assay where the substrate was transcribed in the presence of (α-32P)-ATP (both tail and body were radiolabeled) and resolved by TLC. (C) Deadenylation assay (as in A) showing the product accumulation over time (minutes indicated on the top). The experiments shown are representative of n = 4 in A, n = 1 in B, and n = 2 in C. (Blank) No protein control, (H+dT) the substrate was incubated with RNase H in the presence of oligo(dT) to generate a deadenylated marker, (mNOC) GST-mNOC, (mCRY2) GST-mCRY2, (E193A) predicted GST-mNOC Mg2+-binding mutant, (EDTA) 25 mM EDTA, and GST-mNOC were added at the beginning of the reaction, (xPARN) xPARN-His. Note that while the GST-tagged proteins were incubated linked to sepharose beads, PARN-His was added in solution. (Black arrow) Mobility of the deadenylated product, (gray arrow) a PARN activity product (this enzyme, in addition to the polyA tail, trims a few nucleotides into the body), and (asterisk) nonspecific band present in all lanes.
The deadenylase assay (Fig. 1A) showed that GST-mNOC generated an RNA product with identical electrophoretic mobility to the deadenylated marker. This band was not observed in the enzyme blank or the three negative controls. The mNOC product runs slightly larger than the product generated by xPARN-His, which has been shown to remove nucleotides slightly beyond the polyA tract (Copeland and Wormington 2001; Baggs and Green 2003). This was also previously observed with xNOC (Baggs and Green 2003). The fraction of substrate deadenylated by GST-mNOC was consistently lower than that obtained with xPARN-His. The TLC analysis (Fig. 1B) showed a product of GST-mNOC activity with mobility indistinguishable from the 5′-AMP observed in the xPARN-His lane (Copeland and Wormington 2001). This product is nearly undetectable in the GST-CRY2 and the GST-mNOC Mg2+-binding mutant lanes. We tested whether longer incubation times would produce full deadenylation of the substrate (Fig. 1C). Deadenylated product was not detectable after 5 min of incubation, but became visible after 15 min and continued to increase over time. However, even after 1 h, the fraction of nondeadenylated substrate is still high. Therefore, mNOC has specific polyA exonuclease activity, but this activity is not robust in vitro.
mNoc expression is acutely induced in quiescent NIH3T3 cells by serum shock and TPA
Mammalian fibroblasts contain functional clocks that sustain circadian rhythms in culture (Balsalobre et al. 1998; for review, see Nagoshi et al. 2005). Despite the fact that individual cells exhibit ongoing circadian rhythms (Nagoshi et al. 2004; Welsh et al. 2004), in order to be able to measure oscillations in a cell population the culture must be synchronized with an external cue. A serum shock (Balsalobre et al. 1998; Nagoshi et al. 2004), the phorbol ester TPA (Akashi and Nishida 2000), forskolin (Balsalobre et al. 2000; Yagita and Okamura 2000), and dexamethasone (Balsalobre et al. 2000) are factors capable of synchronizing fibroblast clocks in culture.
Because mNoc is a circadian clock controlled gene, we examined its expression in rhythmic NIH3T3 cultures, which provide a valuable in vitro model system. In doing so we found that mNoc expression was acutely induced by some of the entrainment stimuli. Confluent NIH3T3 cultures were maintained for 2 d in 1% FBS-DMEM; thus, cells were quiescent and serum-starved before the stimulation. When fibroblasts were treated with 100 nM TPA, a rapid increase in the mNoc mRNA levels was observed, with about eightfold higher levels after 1 h (Fig. 2A). To check whether this treatment induced clock gene expression, the mRNA levels of mPer1 were also analyzed. As expected, TPA increased the relative quantities of this transcript to an extent similar to that previously reported (Akashi and Nishida 2000). A serum shock (50% FBS-DMEM) also induced mNoc, again with maximal values about eightfold higher compared with untreated cells and with a temporal profile similar to TPA (Fig. 2B). In both cases the maximal increases were observed during the first hour post-stimulation, and after 1.5 h mRNA levels begin to decline. Note that while TPA remained in the medium throughout the experiment, serum was replaced after 2 h by 1% FBS-DMEM. We also tested the effect of a 15 min TPA pulse, and the results were similar to those obtained with the chronic treatment (data not shown). In contrast with these agents, a 15 min treatment with 10 μM forskolin or 100 nM dexamethasone did not increase mNoc message levels (data not shown).
FIGURE 2.

Acute induction of mNoc in NIH3T3 cultures. 100 nM TPA (A) or 50% FBS-DMEM (B) produced approximately an eightfold increment in mNoc mRNA levels in quiescent and serum-starved cells. TPA also induced the clock gene mPer1. Confluent cultures were maintained for 2 d in 1% FBS-DMEM before the treatment. Relative transcript levels were determined by Northern blot, quantified by densitometry, and normalized by rRNA content. Values represent the mean ± SEM of three independent experiments in A (n = 8–9/group, F = 10.4, p = 1.3E-12 by ANOVA) and two in B (n = 5/group, F = 15.4, p = 1.8E-10 by ANOVA). (*) p < 0.01, (**) p < 0.001 by post hoc comparisons.
mNoc is an immediate early gene (IEG)
Rapid induction is a signature of IEGs, and the mNoc-stimulation curves resemble an IEG-like response. As is stated in their name, IEGs are involved in the first stage of the cellular response to a stimulus, and by definition their induction does not require new protein synthesis. To determine whether mNoc is an IEG, we analyzed the effect of protein synthesis inhibition on the TPA induction of mNoc.
Cycloheximide (CHX) was added to the cultures 1 h before the stimulation and maintained throughout the experiment. Figure 3 shows that this treatment did not abolish the TPA mNoc induction. Moreover, the increment in mRNA levels was threefold larger than the control (25-fold versus eightfold comparing T = 0 with the peak). During the first hour the mRNA accumulation rates were similar. However, in CHX-treated cells the levels increased continually for 3.5 h, whereas the control began to decline after ∼1.5 h. Since the acute induction by an extracellular signal does not require de novo protein synthesis, we conclude that mNoc is an IEG.
FIGURE 3.

mNoc is an immediate early gene (IEG). Quiescent and serum-starved NIH3T3 cells were treated with 10 μM cycloheximide (CHX) 1 h before induction of mNoc with 100 nM TPA as was described in Fig. 2. This treatment showed that TPA acute induction is independent of protein synthesis; thus, mNoc is an IEG. Results are the mean ± SEM of three independent experiments by triplicate (n = 9/group). The effect of the CHX was statistically significant (F = 145, p = 9.11E-25 by ANOVA). (*) p < 0.05, (**) p < 0.01, (***) p < 0.001 by post hoc comparisons.
mNoc transcript has a short half-life and is stabilized by protein synthesis inhibition
To characterize the transient induction of mNoc, we determined the half-life of the TPA-induced transcript when its levels were highest. We treated NIH3T3 cells with TPA as in Figures 2 and 3. After 2 h, transcription was inhibited with the addition of actinomycin D to the culture medium, and the cells were harvested at different times after the treatment. The mRNA decay rate was determined by Northern blot. Figure 4A shows a representative Northern blot, and Figure 4B shows the graph obtained by the quantification of four such experiments. The half-life of the mNoc message induced after 2 h of TPA induction was ∼50 min.
FIGURE 4.

mNoc-induced transcript has a short half-life and is stabilized by cycloheximide. (A) Northern blot showing the mNoc mRNA levels after actinomycin D addition. Quiescent NIH3T3 cells were TPA stimulated as in Fig 2; after 2 h, transcription was inhibited by the addition of actinomycin D. (B) Quantification of the transcript decay rate and effect of CHX on mNoc mRNA half-life. Control NIH3T3 cultures were processed as in A; CHX-treated cells received 10 μM of this translation inhibitor 1 h before TPA stimulation. Values are the mean ± SEM (n = 4/group). mNoc mRNA half-life was estimated to be ∼50 min (dotted line). The effect of the CHX on mRNA half-life was statistically significant (F = 123.00; p = 7.68E-15 by ANOVA). (*) p < 0.05, (**) p < 0.001 by post hoc comparisons.
Subsequently, we asked whether the CHX treatment has an effect on the mNoc transcript stability. We utilized the same experimental scheme described above to determine mRNA half-life, but adding CHX 1 h before stimulation of the cultures (as had been done in Fig. 3). Inhibition of protein synthesis had a protective effect on the mNoc message induced by TPA stimulation (Fig. 4B). Thus, the “superinduction” of mNoc shown in Figure 3 is, at least in part, caused by transcript stabilization.
mNoc is the unique deadenylase induced in serum-stimulated NIH3T3 cells
The cellular response to extracellular stimuli includes the transcriptional activation of several genes, but also the silencing of others. Moreover, many genes involved in the early response are induced only transiently. In order to turn off the expression of these genes, transcription must be discontinued, but it is also necessary to degrade their mRNAs. Since mNOC is part of this early response, we hypothesized that it could be involved in the degradation of these transcripts. However, there are other known deadenylases that may also participate in this response. To try to elucidate this point, we measured the mRNA levels of the other known mouse deadenylases during this acute induction paradigm.
These determinations were done by real-time RT-PCR. The accurate normalization of the data obtained with this method is an important issue since the expression of housekeeping genes can vary considerably in different cells and circumstances (Vandesompele et al. 2002). We measured, in our specific experimental conditions, five potential internal control RNAs: 18S rRNA, GAPDH, HRPT1, TBP, and β2M (see Table 1 for complete names and GenBank accession numbers). To determine the expression regularity of these genes on the basis of nonnormalized data, we applied the principle that the expression ratio of two or more ideal internal control genes should be identical in all samples (Vandesompele et al. 2002). Figure 5A shows the relative RNA values of these genes at different time points after a serum shock. The data are expressed as fold changes compared with nonstimulated cells (T = 0). The RNA profiles obtained for 18S rRNA, TBP, and β2M were similar and did not show significant changes after the stimulation. This is consistent with the report by Schmittgen and Zakrajsek (2000), who showed that β2M and 18S rRNA, but not GAPDH, follow the same profile as total mRNA in serum-stimulated NIH3T3 cells. We selected β2M for data normalization because it showed less variation than TBP, and its levels are more similar to specific mRNAs as compared with the highly abundant 18S rRNA.
TABLE 1.
Primer sequences for real-time RT-PCR

FIGURE 5.

mNoc is the unique deadenylase induced in serum-stimulated NIH3T3 cells. Quiescent NIH3T3 cells were serum starved for 16 h in 0.5% FBS-DMEM, then stimulated with 50% horse serum-DMEM, and after 2 h the medium was replaced by 0.5% FBS-DMEM. The specific mRNA levels were determined by real-time RT-PCR. (A) Analysis of potential “housekeeping” genes for data normalization. The total RNA starting quantities were similar in all time points, the data were normalized as fold change compared with T = 0. (B) Effect of serum shock on five deadenylase mRNA levels. mNoc transcript, but not CCR4, CAF1, PAN2, and PARN mRNAs, is induced in serum-shocked NIH3T3 cells. (C) The same data presented in B were plotted again with a different scale to visualize changes in CCR4, CAF1, PAN2, and PARN mRNAs. In B and C, individual data were normalized by the Pfaffl method considering T = 0 values as the calibrator, and β2M as the reference gene. The graphs show the results of two independent experiments in which measurements were done by triplicate (n = 6/group); values are the mean ± SEM. Only mNoc (F = 42, p = 5.6E-17) and CAF1 (F = 8, p = 2.4E-06) showed significant changes by ANOVA. (**) p < 0.001 by post hoc comparisons.
We examined the relative mRNA values of five polyA-specific ribonucleases or catalytic subunits of deadenylase complexes: Noc (Fig. 1; Baggs and Green 2003), CCR4 (Dupressoir et al. 2001; Chen et al. 2002), CAF1 (Viswanathan et al. 2004), PARN (Korner and Wahle 1997; Korner et al. 1998), and PAN2 (Uchida et al. 2004) (see Table 1 for full names and GenBank accession numbers). To our knowledge, this includes all the currently identified mouse deadenylases (for review, see Parker and Song 2004).
Figure 5B shows clearly that the only deadenylase mRNA induced by serum shock is mNoc. The magnitude of the mRNA level increase was exceptionally high (∼30-fold) in this experiment, in contrast to eightfold seen in Figure 2. This variation probably reflects differences in experimental design and the use of RT-PCR rather than Northern blot for quantification. The data in Figure 2 involved starvation in 1% FBS and stimulation with 50% FBS followed by Northern blot analysis, while those in Figure 5 involved starvation in 0.5% FBS and stimulation with 50% horse serum followed by real-time RT-PCR analysis. In addition, when cultures were not serum deprived (maintained in 10% FBS before the stimulation), the horse serum induction observed was about sevenfold (data not shown), denoting that in serum-starved cells the mNoc transcript levels are low.
In contrast to the acute induction of mNoc, the other deadenylases tested were not induced by serum shock (Fig. 5B,C). Only CAF1 message levels showed a significant increase of 50% 2 h after serum treatment. However, the magnitude of the CAF1 increment (1.5-fold) is fairly moderate compared with the mNoc acute induction (30-fold).
mNOC protein, but not PARN, is serum induced
We next examined whether the mNoc mRNA acute induction is reflected by similar changes in protein levels. We raised an antibody against mNOC utilizing a recombinant truncated version of the protein (see Materials and Methods). The specificity of the antibody was examined by Western blot (Fig. 6A). The immunoreactivity of the antibody was compared in lysates of 3T3 cells and mouse embryo fibroblasts (MEFs) obtained from both mNoc+/+ and mNoc−/− mice. We developed the mNoc−/− mice for studies of NOC function; this animal model is being presented elsewhere (C.B. Green, N. Douris, S. Kojima, C.A. Strayer, J. Fogerty, D. Lourim, S.R. Keller, and J.C. Besharse, in prep.). The antibody recognized a unique band with an electrophoretic mobility corresponding to ∼42 kDa that is present in NIH3T3 and wild-type MEF but not in serum-stimulated mNoc−/− MEF lysates. In addition, we have verified the antibody specificity in immunoblots utilizing recombinant-tagged proteins and tissues from mNoc−/− versus wild-type mouse (data not shown).
FIGURE 6.

mNOC protein induction by serum shock. (A) Western blot showing the temporal profile of the mNOC and PARN protein levels after a serum shock. Cells were treated as in Fig 5. The lanes containing lysates of mouse embryo fibroblasts (MEFs) obtained from mNoc+/+ and mNoc−/− mice serve as positive and negative controls. MEFs were serum stimulated for 2 h. In the lower panel, an immunoblot of the same membrane using α-tubulin antiserum as a loading control. (B) The results of three blots were quantified with the Scion Image software; the graph shows the mean ± SEM. (*) p < 0.05.
The mNOC protein levels in serum-stimulated NIH3T3 cells increased approximately ninefold compared with the nonstimulated control (Fig. 6). The mNOC temporal profile resembles the mRNA response shown in Figures 2 and 5B. The mRNA peak (2 h after serum stimulation, Fig. 5B) precedes the highest levels of protein (2.5 h after serum shock) by ∼30 min. The increase in mRNA levels was 30-fold versus ninefold for the protein (cf. Figs. 5 and 6, which used the same stimulation paradigm). The levels of mNOC protein begin to decline after 2.5 h, indicating that it has a short half-life and that in the absence of stimulation its levels are low.
We also measured the levels of PARN protein in the same lysates of serum-stimulated NIH3T3 (Fig. 6). The relative values of this deadenylase showed a weak diminution but did not change significantly after the serum shock.
DISCUSSION
This paper reports an acute induction of the deadenylase mNOC as a cellular response to two different stimuli. This induction showed the typical characteristics of an immediate early gene response. mNOC was the unique polyA-specific ribonuclease induced by serum among the five described in the mouse. This suggests that mNOC plays an important role triggering the degradation and/or silencing of mRNAs of genes that are turned off under the paradigm studied.
mNOC deadenylase activity
The high similarity between the mNOC C terminus and the catalytic domain of CCR4, as well as the demonstration that xNOC is a deadenylase, strongly suggested that mNOC was also a polyA-specific ribonuclease (Green and Besharse 1996a; Dupressoir et al. 1999, 2001; Wang et al. 2001; Baggs and Green 2003); however, this hypothesis had not been verified until this study (Fig. 1). Although our results demonstrate that mNOC has specific deadenylase activity, the in vitro activity of GST-mNOC is weak compared with xPARN-His, as reflected in the fraction of substrate that remains adenylated. This is also true for xNOC (Baggs and Green 2003). Taking into account that we assayed a recombinant protein in vitro, many facts could explain the modest enzymatic activity: (1) we have not identified the optimal conditions; (2) the recombinant protein does not have the proper conformation or post-translational modifications; (3) it has very specific targets, and thus is not efficient at degrading generic substrates; and (4) it may require other interacting proteins, a particular cellular environment, and/or modifications produced after a specific event (e.g., serum or TPA induction).
mNoc induction
Noc was originally identified by virtue of its rhythmic mRNA profiles; we have previously shown that circadian clocks control Noc mRNA and protein expression in Xenopus retina (Green and Besharse 1996a; Liu and Green 2001, 2002; Baggs and Green 2003). Likewise, in mouse, Noc shows a high-amplitude mRNA content rhythm in a wide range of tissues (Wang et al. 2001; Barbot et al. 2002). Here, we show that extracellular factors also modulate mNoc expression through an acute induction. Serum and TPA—but not forskolin or dexamethasone—induced mNoc levels (Figs. 2, 5, 6). The increase in the transcript levels generated by TPA was not dependent on protein synthesis (Fig. 3), and the half-life of the induced message is short (Fig. 4), a requisite to obtain a transient response. These results support our conclusion that mNoc is an IEG. Since extracellular signals modulate expression programs, it is reasonable that in addition to transcription factors, mRNA decay-promoting factors also participate in the immediate early response.
Addition of CHX protected mNoc mRNA from degradation (Fig. 4). This is consistent with previous reports showing that inhibition of translation stabilizes many mRNAs (Jacobson and Peltz 1996). Since the effect of CHX on mNoc is so dramatic (Fig. 3), we cannot rule out the possibility that CHX inhibits the synthesis of factors normally involved in mNoc mRNA degradation and/or transcriptional repression following the induction.
The mechanism involved in the mNoc induction is not clear since the stimuli utilized activate numerous signaling pathways. Serum, TPA, forskolin, and dexamethasone were tested due to their capacity to entrain circadian clocks in mammalian fibroblast cultures (Balsalobre et al. 1998, 2000; Akashi and Nishida 2000; Yagita and Okamura 2000; Yagita et al. 2001; Nagoshi et al. 2004). The mechanism by which these factors synchronize molecular oscillators is thought to be through the immediate early activation of the clock gene Per1. Although mNoc and mPer1 have similar TPA-induction profiles, mNoc was not activated by forskolin or dexamethasone. Thus, it is clear that mPer1 induction and/or resetting of circadian clocks are not sufficient for stimulation of mNoc expression. Moreover, mNoc induction by TPA does not require protein synthesis, indicating that it does not require the induction of any clock protein (components of the intracellular molecular clock mechanism). These experiments also show that mNoc induction is not required for the synchronization of circadian gene expression triggered by forskolin and dexamethasone.
Circadian gene expression is modulated through various mechanisms (for review, see Reppert and Weaver 2002; Schibler et al. 2003; Lowrey and Takahashi 2004). The central clock mechanism consists of transcription factors or regulators that rhythmically activate the transcription of some circadian clock controlled genes (ccgs). A number of these direct target genes are also transcription factors that in turn regulate the cyclic expression of indirect ccgs. In addition, in multicellular organisms, the circadian system regulates the secretion of a number of hormones and humoral factors, activity and feeding behaviors, as well as body temperature, among other variables. As a consequence, many systemic physiological signals display daily oscillations (Schibler et al. 2003). This raises the question of whether rhythmic mNoc expression in vivo is the result of a daily acute induction through a systemic circadian signal that triggers its expression in different tissues, as opposed to cell-autonomous control by the intracellular clockwork. The fact that the cellular oscillator does not mediate the acute response of mNoc to extracellular stimuli (see above) suggests that some rhythmic systemic signals may directly induce mNoc expression in vivo. This hypothesis could explain why the phase of mNoc expression in different tissues is similar (Wang et al. 2001) despite the fact that central clock genes show phase differences among those same tissues. This idea is also supported by recent work demonstrating that in transgenic mice with liver-specific loss of circadian clock function (but with the other body clocks intact), mNoc is one of the few mRNAs that continue to exhibit rhythmic expression in the liver, suggesting that it can be driven from systemic rhythmic signals (Kornmann et al. 2007).
mNoc transcript is the unique deadenylase mRNA induced by serum
Among the five deadenylases described in mouse, mNoc message was the only one induced by serum stimulation (Fig. 5). Taking into account that deadenylation is considered to be the event that triggers the degradation of the majority of transcripts (Cao and Parker 2001; Wang et al. 2002), our results suggest an important role for mNOC in the destabilization of mRNAs that decay under these conditions.
The fates of specific mRNAs are known to be modulated by extracellular signals. This is produced by post-transcriptional modifications, relocalization to different cellular compartments, and/or expression rate changes of the factors interacting with messages (Shim and Karin 2002; Wilusz and Wilusz 2004). Several reports have shown the stabilization of specific transcripts—including proto-oncogenes, cytokine, and chemokine genes—following cell stimulation (Shim and Karin 2002; Dean et al. 2004; Briata et al. 2005, and references therein). In contrast, we are not aware of any previous study showing transcript destabilization, or activation of mRNA decay-promoting factors, by serum or TPA stimulation.
PAN2 and CCR4 were recently proposed to be the major polyA nucleases responsible for cytoplasmic deadenylation in NIH3T3 cultures (Yamashita et al. 2005). This statement is supported by experiments conducted in proliferating and nonstimulated cells. Our results suggest that in confluent cultures, where proliferation is inhibited, and after a serum or TPA stimulation, mNOC is a major deadenylase. Since we have not determined the specific activity of each deadenylase, further studies will be needed to directly demonstrate this. It is important to consider that whereas some transcripts increase their half-life in response to an external stimulus simultaneously, others are destabilized or are just transiently stabilized (for example, IEGs). In other words, regulation of stability is likely different for different sets of mRNAs, and the ability of different deadenylases to act on different message populations or in different physiological situations could be an important point of regulation in this process. During the last few years, many factors (cis- and trans-acting elements) have been identified, including even new cytoplasmic subdomains involved in mRNA surveillance. However, we still do not understand how mRNA stability is controlled in different cells/tissues under diverse physiological conditions. The elucidation of this complex regulation may help give a better understanding of gene expression and some diseases including cancer, chronic inflammatory responses, and coronary disease (Wilusz et al. 2001).
In summary, our studies have been focused on understanding the specific function of a deadenylase, a factor involved in triggering mRNA degradation or silencing (Baggs and Green 2006). We have shown that mouse mNoc is expressed under circadian control in numerous tissues during the early night (Wang et al. 2001) and that it is acutely induced by extracellular stimulation (this report). These two characteristics differentiate mNOC from the other deadenylases, suggesting that it has specific mRNA targets and/or it is active only during specific time windows or physiological conditions.
MATERIALS AND METHODS
DNA plasmids and protein purification
Mouse Noc (GenBank Accession Number AF199491) and Cry2 (AF156987) were cloned in a pDEST15 vector (Invitrogen) for Escherichia coli expression with an N-terminal GST-tag. The predicted mNoc Mg2+-binding (D193A) mutant was generated by site-directed mutagenesis (QuikChange kit, Stratagene) on the pDEST15-mNoc plasmid DNA.
BL21 cells were transformed with the expression plasmids, and induced and homogenized in lysis buffer (20 mM HEPES pH 8; 150 mM NaOAc, 1 mM MgOAc, 10 mM KOAc) containing 0.2 μg/mL lysozyme, 5 μg/mL DNase I, 1% Triton X-100, and protease inhibitors. The lysates were clarified by centrifugation (34,000 RFC, 20 min), and 10% glycerol was added to the supernatant. The protein was affinity purified with Glutathione Sepharose (Amersham). The column was washed 2× with lysis buffer containing 0.5% Triton X-100 and 10% glycerol, 3× with wash buffer (100 mM Tris-OAc pH 8, 150 mM KOAc, 0.05% igepal, 0.01% SDS, 20% glycerol, and 1 mM DTT), 2× with storage buffer (50 mM HEPES pH 8, 0.01 mM MgOAc, 20 mM KOAc, 20% glycerol, and 0.1% igepal), and stored at 4°C in this buffer containing protease inhibitors. Xenopus PARN was the only protein expressed with a different vector (His-tagged) and that was eluted from the affinity resin. It was produced and purified as described (Copeland and Wormington 2001; Baggs and Green 2003). The proteins linked to Sepharose and xPARN-His were analyzed by SDS-PAGE followed by silver staining, and the concentration was estimated by running a BSA standard curve in the same gel. The band densities were calculated with Scion Image software.
Deadenylase assay
The deadenylase assay was carried out as described previously (Copeland and Wormington 2001; Baggs and Green 2003) with modifications inspired by Viswanathan and coworkers (2003). The RNA substrate was synthesized from the G52 plasmid containing the last 86 nt of the globin 3′ UTR followed by a 100-nt polyA tail. A radiolabeled RNA substrate was synthesized by transcribing BamHI-linearized DNA constructs with SP6 polymerase (GIBCO-BRL) in the presence of (α-32P)-UTP (800 Ci/mmol, NEN) and 625 μM of a 5′ GpppG cap analog (Amersham Pharmacia Biotech). Resulting RNA products were separated on 6% polyacrylamide/7 M urea gels and eluted in TNES buffer (0.1 M Tris-HCl pH 7.5, 0.3 M NaCl, 0.01 M EDTA, 2% w/v SDS) overnight at room temperature. Purified RNA (1 × 10⁵ cpm, ∼1.5 ng) was incubated with the GST-recombinant proteins (500 ng) linked to sepharose in reaction buffer (50 mM HEPES-NaOH pH 8, 0.01 mM MgOAc, 20 mM KOAc) for 30 min (or the indicated times) at 37°C in the presence of 5 U of RNase Block (Stratagene). The xPARN-His protein assay conditions were identical to that described previously with no modifications (Copeland and Wormington 2001; Baggs and Green 2003). The reaction was stopped by the addition of formamide and heating for 5 min at 85°C. The products were separated on 6% polyacrylamide/7 M urea gels and revealed by autoradiography. The RNA substrate and deadenylated product were identified by comparing their electrophoretic mobility with the enzyme blank and RNase H (Invitrogen)-treated substrate in the presence of oligo(dT), respectively. Alternatively, the reaction products were analyzed by TLC in PEI cellulose plates (Sigma), and developed in 15:1:10 isobutyric acid:NH4OH:H2O as described by Copeland and Wormington (2001).
Cell cultures
NIH/Swiss 3T3 fibroblasts (ATCC) were grown at 37°C, under 5% CO2 and 95% air, in Dulbecco's Modified Eagle Medium (DMEM, Gibco) supplemented with 10% fetal bovine serum (FBS, Gibco). Experiments were done 48–72 h after cultures reached confluence. Serum starvation was initiated 16–48 h before the experiment by replacing the DMEM containing 10% FBS with DMEM containing either 1% or 0.5% FBS as specified.
Serum shock: At T = 0 (nonstimulated cells), medium was exchanged for prewarmed 50% FBS or horse serum (Gibco)–DMEM. After 2 h of incubation, the medium was replaced with either 1% or 0.5% FBS-DMEM (modified from Balsalobre et al. 1998; Nagoshi et al. 2004). TPA: The phorbol ester 12-O-tetradecanoyl phorbol 13-acetate (Sigma, stock 1 mM in DMSO) was diluted to 2.5 μM in medium and added to the cultures to a final concentration of 100 nM (modified from Akashi and Nishida 2000). Forskolin and dexamethasone were added to a final concentration of 10 μM and 100 nM, respectively; 15 min later, the medium was replaced by 1% FBS-DMEM (modified from Balsalobre et al. 2000; Yagita and Okamura 2000). Cycloheximide (CHX, 10 μM, Sigma) was added 1 h before cell stimulation, and actinomycin D (1 μg/mL, Sigma) 2 h after TPA induction. Cells were washed in PBS and harvested at the indicated times after stimulation in TRIzol reagent (Invitrogen) for RNA extraction, or in lysis buffer (T-PER, Pierce) containing 2 mM DTT, 1 mM EDTA, and protease inhibitor cocktail (Sigma) for protein analysis.
RNA isolation and cDNA synthesis
Total RNA was purified using TRIzol reagent according to the manufacturer's instructions (Invitrogen). One microgram of total RNA was utilized as a template for the cDNA synthesis reaction using iScript reverse transcriptase and a blend of oligo (dT) and random hexamers in a final volume of 20 μL (iScript cDNA synthesis kit, Bio-Rad).
Northern blot
Northern blots were done as described (Green and Besharse 1996b). Briefly, 10 μg of total RNA was separated by electrophoresis in a 1% agarose formaldehyde gel and transferred to BrightStar membranes (Ambion). Membranes were hybridized utilizing ULTRAhyb hybridization buffer (Ambion) according to the manufacturer's instructions with a 5 × 10⁵ cpm/mL probe for 16 h at 45°C. The probe was synthesized by PCR in the presence of (α-32P)-dCTP (NEN) utilizing the primers: 5′-AACCATGCAGGTACAGTCT-3′ and 5′-GTTTGGAAGAGGCTTCAAC-3′, and plasmid DNA containing the mNoc sequence as a template. The probe was purified with the DyeEx Spin kit (Qiagen). Membranes were washed two times with 1× SSC, 0.1% SDS for 15 min at 50°C, and then two more times with 0.1× SSC, 0.5% SDS for 15 min at 50°C. The hybridization signal was quantified utilizing a Storm PhosphorImager system (Molecular Dynamics) followed by densitometric analysis using an imaging program. Values were normalized by densitometric values for the 28S rRNA band stained with methylene blue. Transcript size was determined using Perfect RNA markers (Novagen).
Real-time quantitative PCR
The primers utilized for real-time quantitative PCR (Invitrogen) are listed in Table 1. The sequences were taken from the Harvard Primer Bank (Wang and Seed 2003) except for the 18S rRNA primer pair that was reported by Yamamoto et al. (2005). The quantification was performed in a MyiQ single-color real-time PCR detection system (Bio-Rad). The amplification mix contained 1 μL of the cDNA synthesis reaction, 0.8 μM of each primer, and 12.5 μL of iQ SYBR green supermix (Bio-Rad) in a total volume of 25 μL. The cycling conditions were 30 sec polymerase activation at 95.0°C, and 40 cycles of 95.0°C for 30 sec, 60.0°C for 30 sec, and 72.0°C for 30 sec. Each assay included a standard curve in duplicate, utilizing 1:5 serial dilutions of cDNA from 2 h serum-stimulated cells. Samples were measured in triplicate. The PCR product was checked by melt curve analysis, and the standard curve linearity and PCR efficiency were optimized. For housekeeping genes (Fig. 6A), the relative RNA starting quantities generated by the Optical system software (Bio-Rad) were normalized setting the nonstimulated cells (T = 0) equal to 1. For the deadenylases (Fig. 6B,C), the data were normalized by the Pfaffl method (Real-Time PCR Applications Guide, Bio-Rad):
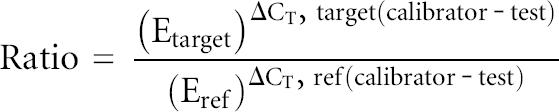 |
where E represents PCR efficiency; Ref represents β2-microglobulin; calibrator represents no stimulated cells; and CT represents the threshold cycle.
Western blotting
Protein lysates (5 μg) were separated in 10% SDS polyacrylamide gels and transferred to PVDF membranes (Bio-Rad) using standard protocols for Western blotting. We developed an antibody for mNOC detection. The DNA sequence coding for amino acids A152-F429 of mNOC (GenBank Accession Number AF199491) was cloned in a pDEST17 vector (Invitrogen) and expressed in bacteria. The 6× His-tagged recombinant protein was affinity purified using His-Bind resin according to the manufacturer's instructions (Novagen). This recombinant protein was utilized as an immunogen to raise an antibody in chickens (Covance). Sera and total egg IgY were affinity purified using recombinant GST-NOC following a protocol from Bar-Peled and Raikhel (1996). The anti-PARN antibody (Korner et al. 1998) was generously provided by Michael Wormington (University of Virginia). A mouse monoclonal anti-alpha tubulin antibody (Sigma) was utilized for tubulin detection. The secondary antibodies were HRP conjugated, and the detection was done utilizing a chemiluminescent system (Roche). The signal was quantified by Scion Image software.
Statistical analysis
Statistical analyses involved analysis of variance (ANOVA) with Newman-Keuls post hoc tests when appropriate.
ACKNOWLEDGMENTS
We thank Mike Wormington (University of Virginia) for helpful discussion, criticism of the manuscript, and for providing the PARN antibody and plasmid. This work was supported by NIH Grants EY11489 (C.B.G.), GM076626 (C.B.G.), and EY02414 (J.C.B.), and Development Funds from the Medical College of Wisconsin (J.C.B.).
Footnotes
Article published online ahead of print. Article and publication date are at http://www.rnajournal.org/cgi/doi/10.1261/rna.286507.
REFERENCES
- Akashi, M., Nishida, E. Involvement of the MAP kinase cascade in resetting of the mammalian circadian clock. Genes & Dev. 2000;14:645–649. [PMC free article] [PubMed] [Google Scholar]
- Baggs, J.E., Green, C.B. Nocturnin, a deadenylase in Xenopus laevis retina: A mechanism for post-transcriptional control of circadian-related mRNA. Curr. Biol. 2003;13:189–198. doi: 10.1016/s0960-9822(03)00014-9. [DOI] [PubMed] [Google Scholar]
- Baggs, J.E., Green, C.B. Functional analysis of nocturnin: A circadian clock-regulated gene identified by differential display. Methods Mol. Biol. 2006;317:243–254. doi: 10.1385/1-59259-968-0:243. [DOI] [PubMed] [Google Scholar]
- Balsalobre, A., Damiola, F., Schibler, U. A serum shock induces circadian gene expression in mammalian tissue culture cells. Cell. 1998;93:929–937. doi: 10.1016/s0092-8674(00)81199-x. [DOI] [PubMed] [Google Scholar]
- Balsalobre, A., Marcacci, L., Schibler, U. Multiple signaling pathways elicit circadian gene expression in cultured Rat-1 fibroblasts. Curr. Biol. 2000;10:1291–1294. doi: 10.1016/s0960-9822(00)00758-2. [DOI] [PubMed] [Google Scholar]
- Barbot, W., Wasowicz, M., Dupressoir, A., Versaux-Botteri, C., Heidmann, T. A murine gene with circadian expression revealed by transposon insertion: Self-sustained rhythmicity in the liver and the photoreceptors. Biochim. Biophys. Acta. 2002;1576:81–91. doi: 10.1016/s0167-4781(02)00296-8. [DOI] [PubMed] [Google Scholar]
- Bar-Peled, M., Raikhel, N.V. A method for isolation and purification of specific antibodies to a protein fused to the GST. Anal. Biochem. 1996;241:140–142. doi: 10.1006/abio.1996.0390. [DOI] [PubMed] [Google Scholar]
- Briata, P., Forcales, S.V., Ponassi, M., Corte, G., Chen, C.Y., Karin, M., Puri, P.L., Gherzi, R. p38-dependent phosphorylation of the mRNA decay-promoting factor KSRP controls the stability of select myogenic transcripts. Mol. Cell. 2005;20:891–903. doi: 10.1016/j.molcel.2005.10.021. [DOI] [PubMed] [Google Scholar]
- Cao, D., Parker, R. Computational modeling of eukaryotic mRNA turnover. RNA. 2001;7:1192–1212. doi: 10.1017/s1355838201010330. [DOI] [PMC free article] [PubMed] [Google Scholar]
- Chen, J., Chiang, Y.C., Denis, C.L. CCR4, a 3′-5′ poly(A) RNA and ssDNA exonuclease, is the catalytic component of the cytoplasmic deadenylase. EMBO J. 2002;21:1414–1426. doi: 10.1093/emboj/21.6.1414. [DOI] [PMC free article] [PubMed] [Google Scholar]
- Copeland, P.R., Wormington, M. The mechanism and regulation of deadenylation: Identification and characterization of Xenopus PARN. RNA. 2001;7:875–886. doi: 10.1017/s1355838201010020. [DOI] [PMC free article] [PubMed] [Google Scholar]
- Dean, J.L., Sully, G., Clark, A.R., Saklatvala, J. The involvement of AU-rich element-binding proteins in p38 mitogen-activated protein kinase pathway-mediated mRNA stabilization. Cell. Signal. 2004;16:1113–1121. doi: 10.1016/j.cellsig.2004.04.006. [DOI] [PubMed] [Google Scholar]
- Dlakic, M. Functionally unrelated signalling proteins contain a fold similar to Mg2+-dependent endonucleases. Trends Biochem. Sci. 2000;25:272–273. doi: 10.1016/s0968-0004(00)01582-6. [DOI] [PubMed] [Google Scholar]
- Dupressoir, A., Barbot, W., Loireau, M.P., Heidmann, T. Characterization of a mammalian gene related to the yeast CCR4 general transcription factor and revealed by transposon insertion. J. Biol. Chem. 1999;274:31068–31075. doi: 10.1074/jbc.274.43.31068. [DOI] [PubMed] [Google Scholar]
- Dupressoir, A., Morel, A.P., Barbot, W., Loireau, M.P., Corbo, L., Heidmann, T. Identification of four families of yCCR4- and Mg2+-dependent endonuclease-related proteins in higher eukaryotes, and characterization of orthologs of yCCR4 with a conserved leucine-rich repeat essential for hCAF1/hPOP2 binding. BMC Genomics. 2001;2:9. doi: 10.1186/1471-2164-2-9. [DOI] [PMC free article] [PubMed] [Google Scholar]
- Green, C.B., Besharse, J.C. Identification of a novel vertebrate circadian clock-regulated gene encoding the protein nocturnin. Proc. Natl. Acad. Sci. 1996a;93:14884–14888. doi: 10.1073/pnas.93.25.14884. [DOI] [PMC free article] [PubMed] [Google Scholar]
- Green, C.B., Besharse, J.C. Use of a high-stringency differential display screen for identification of retinal mRNAs that are regulated by a circadian clock. Brain Res. 1996b;37:157–165. doi: 10.1016/0169-328x(95)00307-e. [DOI] [PubMed] [Google Scholar]
- Jacobson, A., Peltz, S.W. Interrelationships of the pathways of mRNA decay and translation in eukaryotic cells. Annu. Rev. Biochem. 1996;65:693–739. doi: 10.1146/annurev.bi.65.070196.003401. [DOI] [PubMed] [Google Scholar]
- Korner, C.G., Wahle, E. Poly(A) tail shortening by a mammalian poly(A)-specific 3′-exoribonuclease. J. Biol. Chem. 1997;272:10448–10456. doi: 10.1074/jbc.272.16.10448. [DOI] [PubMed] [Google Scholar]
- Korner, C.G., Wormington, M., Muckenthaler, M., Schneider, S., Dehlin, E., Wahle, E. The deadenylating nuclease (DAN) is involved in poly(A) tail removal during the meiotic maturation of Xenopus oocytes. EMBO J. 1998;17:5427–5437. doi: 10.1093/emboj/17.18.5427. [DOI] [PMC free article] [PubMed] [Google Scholar]
- Kornmann, B., Schaad, O., Bujard, H., Takahashi, J.S., Schibler, U. System-driven and oscillator-dependent circadian transcription in mice with a conditionally active liver clock. PLoS Biol. 2007;5:1–11. doi: 10.1371/journal.pbio.0050034. [DOI] [PMC free article] [PubMed] [Google Scholar]
- Liu, X., Green, C.B. A novel promoter element, photoreceptor conserved element II, directs photoreceptor-specific expression of nocturnin in Xenopus laevis. J. Biol. Chem. 2001;276:15146–15154. doi: 10.1074/jbc.M009970200. [DOI] [PubMed] [Google Scholar]
- Liu, X., Green, C.B. Circadian regulation of nocturnin transcription by phosphorylated CREB in Xenopus retinal photoreceptor cells. Mol. Cell. Biol. 2002;22:7501–7511. doi: 10.1128/MCB.22.21.7501-7511.2002. [DOI] [PMC free article] [PubMed] [Google Scholar]
- Lowrey, P.L., Takahashi, J.S. Mammalian circadian biology: Elucidating genome-wide levels of temporal organization. Annu. Rev. Genomics Hum. Genet. 2004;5:407–441. doi: 10.1146/annurev.genom.5.061903.175925. [DOI] [PMC free article] [PubMed] [Google Scholar]
- Marquez, S., Crespo, P., Carlini, V., Garbarino-Pico, E., Baler, R., Caputto, B.L., Guido, M.E. The metabolism of phospholipids oscillates rhythmically in cultures of fibroblasts and is regulated by the clock protein PERIOD 1. FASEB J. 2004;18:519–521. doi: 10.1096/fj.03-0417fje. [DOI] [PubMed] [Google Scholar]
- Nagoshi, E., Saini, C., Bauer, C., Laroche, T., Naef, F., Schibler, U. Circadian gene expression in individual fibroblasts: Cell-autonomous and self-sustained oscillators pass time to daughter cells. Cell. 2004;119:693–705. doi: 10.1016/j.cell.2004.11.015. [DOI] [PubMed] [Google Scholar]
- Nagoshi, E., Brown, S.A., Dibner, C., Kornmann, B., Schibler, U. Circadian gene expression in cultured cells. Methods Enzymol. 2005;393:543–557. doi: 10.1016/S0076-6879(05)93028-0. [DOI] [PubMed] [Google Scholar]
- Parker, R., Song, H. The enzymes and control of eukaryotic mRNA turnover. Nat. Struct. Mol. Biol. 2004;11:121–127. doi: 10.1038/nsmb724. [DOI] [PubMed] [Google Scholar]
- Pittendrigh, C.S. Temporal organization: Reflections of a Darwinian clock watcher. Annu. Rev. Physiol. 1993;55:16–54. doi: 10.1146/annurev.ph.55.030193.000313. [DOI] [PubMed] [Google Scholar]
- Reppert, S.M., Weaver, D.R. Coordination of circadian timing in mammals. Nature. 2002;418:935–941. doi: 10.1038/nature00965. [DOI] [PubMed] [Google Scholar]
- Schibler, U., Ripperger, J., Brown, S.A. Peripheral circadian oscillators in mammals: Time and food. J. Biol. Rhythms. 2003;18:250–260. doi: 10.1177/0748730403018003007. [DOI] [PubMed] [Google Scholar]
- Schmittgen, T.D., Zakrajsek, B.A. Effect of experimental treatment on housekeeping gene expression: Validation by real-time, quantitative RT-PCR. J. Biochem. Biophys. Methods. 2000;46:69–81. doi: 10.1016/s0165-022x(00)00129-9. [DOI] [PubMed] [Google Scholar]
- Shim, J., Karin, M. The control of mRNA stability in response to extracellular stimuli. Mol. Cells. 2002;14:323–331. [PubMed] [Google Scholar]
- Uchida, N., Hoshino, S., Katada, T. Identification of a human cytoplasmic poly(A) nuclease complex stimulated by poly(A)-binding protein. J. Biol. Chem. 2004;279:1383–1391. doi: 10.1074/jbc.M309125200. [DOI] [PubMed] [Google Scholar]
- Vandesompele, J., De Preter, K., Pattyn, F., Poppe, B., Van Roy, N., De Paepe, A., Speleman, F. Accurate normalization of real-time quantitative RT-PCR data by geometric averaging of multiple internal control genes. Genome Biol. 2002;3 doi: 10.1186/gb-2002-3-7-research0034. RESEARCH0034. [DOI] [PMC free article] [PubMed] [Google Scholar]
- Viswanathan, P., Chen, J., Chiang, Y.C., Denis, C.L. Identification of multiple RNA features that influence CCR4 deadenylation activity. J. Biol. Chem. 2003;278:14949–14955. doi: 10.1074/jbc.M211794200. [DOI] [PubMed] [Google Scholar]
- Viswanathan, P., Ohn, T., Chiang, Y.C., Chen, J., Denis, C.L. Mouse CAF1 can function as a processive deadenylase/3′-5′-exonuclease in vitro but in yeast the deadenylase function of CAF1 is not required for mRNA poly(A) removal. J. Biol. Chem. 2004;279:23988–23995. doi: 10.1074/jbc.M402803200. [DOI] [PubMed] [Google Scholar]
- Wang, X., Seed, B. A PCR primer bank for quantitative gene expression analysis. Nucleic Acids Res. 2003;31:e154. doi: 10.1093/nar/gng154. [DOI] [PMC free article] [PubMed] [Google Scholar]
- Wang, Y., Osterbur, D.L., Megaw, P.L., Tosini, G., Fukuhara, C., Green, C.B., Besharse, J.C. Rhythmic expression of Nocturnin mRNA in multiple tissues of the mouse. BMC Dev. Biol. 2001;1:9. doi: 10.1186/1471-213X-1-9. [DOI] [PMC free article] [PubMed] [Google Scholar]
- Wang, Y., Liu, C.L., Storey, J.D., Tibshirani, R.J., Herschlag, D., Brown, P.O. Precision and functional specificity in mRNA decay. Proc. Natl. Acad. Sci. 2002;99:5860–5865. doi: 10.1073/pnas.092538799. [DOI] [PMC free article] [PubMed] [Google Scholar]
- Welsh, D.K., Yoo, S.H., Liu, A.C., Takahashi, J.S., Kay, S.A. Bioluminescence imaging of individual fibroblasts reveals persistent, independently phased circadian rhythms of clock gene expression. Curr. Biol. 2004;14:2289–2295. doi: 10.1016/j.cub.2004.11.057. [DOI] [PMC free article] [PubMed] [Google Scholar]
- Wilusz, C.J., Wilusz, J. Bringing the role of mRNA decay in the control of gene expression into focus. Trends Genet. 2004;20:491–497. doi: 10.1016/j.tig.2004.07.011. [DOI] [PubMed] [Google Scholar]
- Wilusz, C.J., Wormington, M., Peltz, S.W. The cap-to-tail guide to mRNA turnover. Nat. Rev. Mol. Cell Biol. 2001;2:237–246. doi: 10.1038/35067025. [DOI] [PubMed] [Google Scholar]
- Yagita, K., Okamura, H. Forskolin induces circadian gene expression of rPer1, rPer2 and dbp in mammalian rat-1 fibroblasts. FEBS Lett. 2000;465:79–82. doi: 10.1016/s0014-5793(99)01724-x. [DOI] [PubMed] [Google Scholar]
- Yagita, K., Tamanini, F., van Der Horst, G.T., Okamura, H. Molecular mechanisms of the biological clock in cultured fibroblasts. Science. 2001;292:278–281. doi: 10.1126/science.1059542. [DOI] [PubMed] [Google Scholar]
- Yamamoto, T., Nakahata, Y., Tanaka, M., Yoshida, M., Soma, H., Shinohara, K., Yasuda, A., Mamine, T., Takumi, T. Acute physical stress elevates mouse period1 mRNA expression in mouse peripheral tissues via a glucocorticoid-responsive element. J. Biol. Chem. 2005;280:42036–42043. doi: 10.1074/jbc.M509600200. [DOI] [PubMed] [Google Scholar]
- Yamashita, A., Chang, T.C., Yamashita, Y., Zhu, W., Zhong, Z., Chen, C.Y., Shyu, A.B. Concerted action of poly(A) nucleases and decapping enzyme in mammalian mRNA turnover. Nat. Struct. Mol. Biol. 2005;12:1054–1063. doi: 10.1038/nsmb1016. [DOI] [PubMed] [Google Scholar]